What is Clustering? Discovering the Hidden Tribes in Your Data
Turn this article into takeaways for your work.


Each assistant summarizes the article only for you and suggests best practices for your work.
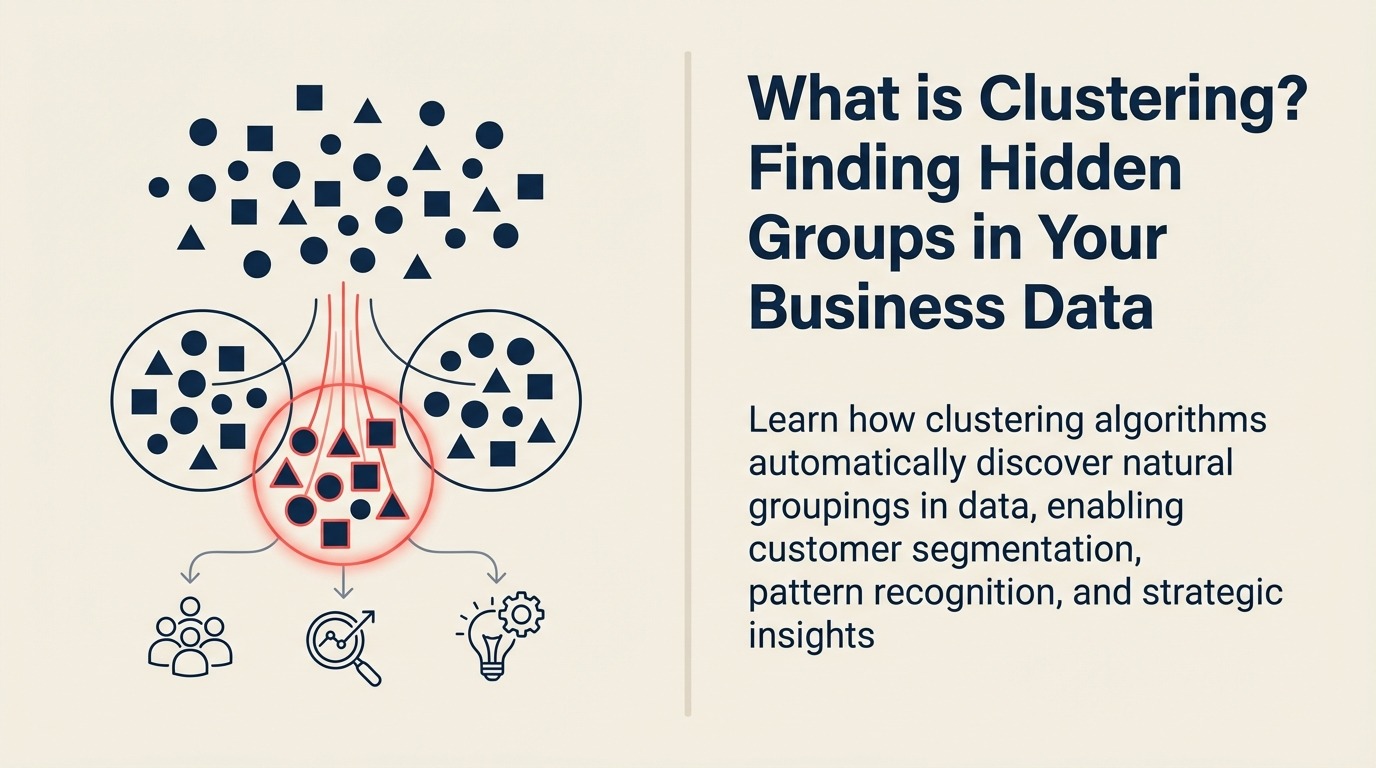
Business clustering is an unsupervised machine learning technique that groups customers, products, or markets into natural segments based on how they actually behave, without you defining the groups in advance. It reveals high-value segments traditional demographics miss, which is why companies use it for customer segmentation, market analysis, and pattern discovery.
87% of businesses segment customers wrong. They use basic demographics - age, income, location - when the real gold lies in behavioral patterns. That's where clustering comes in. It's AI that finds natural groups in your data, revealing segments you never knew existed. Like the retailer who discovered their "Sunday morning yogurt buyers" were their most profitable segment.
Understanding Clustering
You know how people naturally form groups at parties? Sports fans gravitate together, parents find each other, tech folks cluster in corners. Clustering algorithms do the same thing with data - finding natural groupings without being told what to look for.
More technically, clustering is an unsupervised machine learning technique that groups similar data points together based on their characteristics. Unlike classification (which needs labels), clustering discovers patterns on its own.
The key difference is discovery versus prediction. Supervised learning classification asks "Is this customer high-value?" when you already know what high-value means. Clustering asks "What kinds of customers do we have?" and lets the data reveal the answer.
How Clustering Actually Works
Clustering operates through measuring similarity. First, it represents each data point in mathematical space - customer age might be one dimension, purchase frequency another, average order value a third. Like plotting points on a multi-dimensional map.
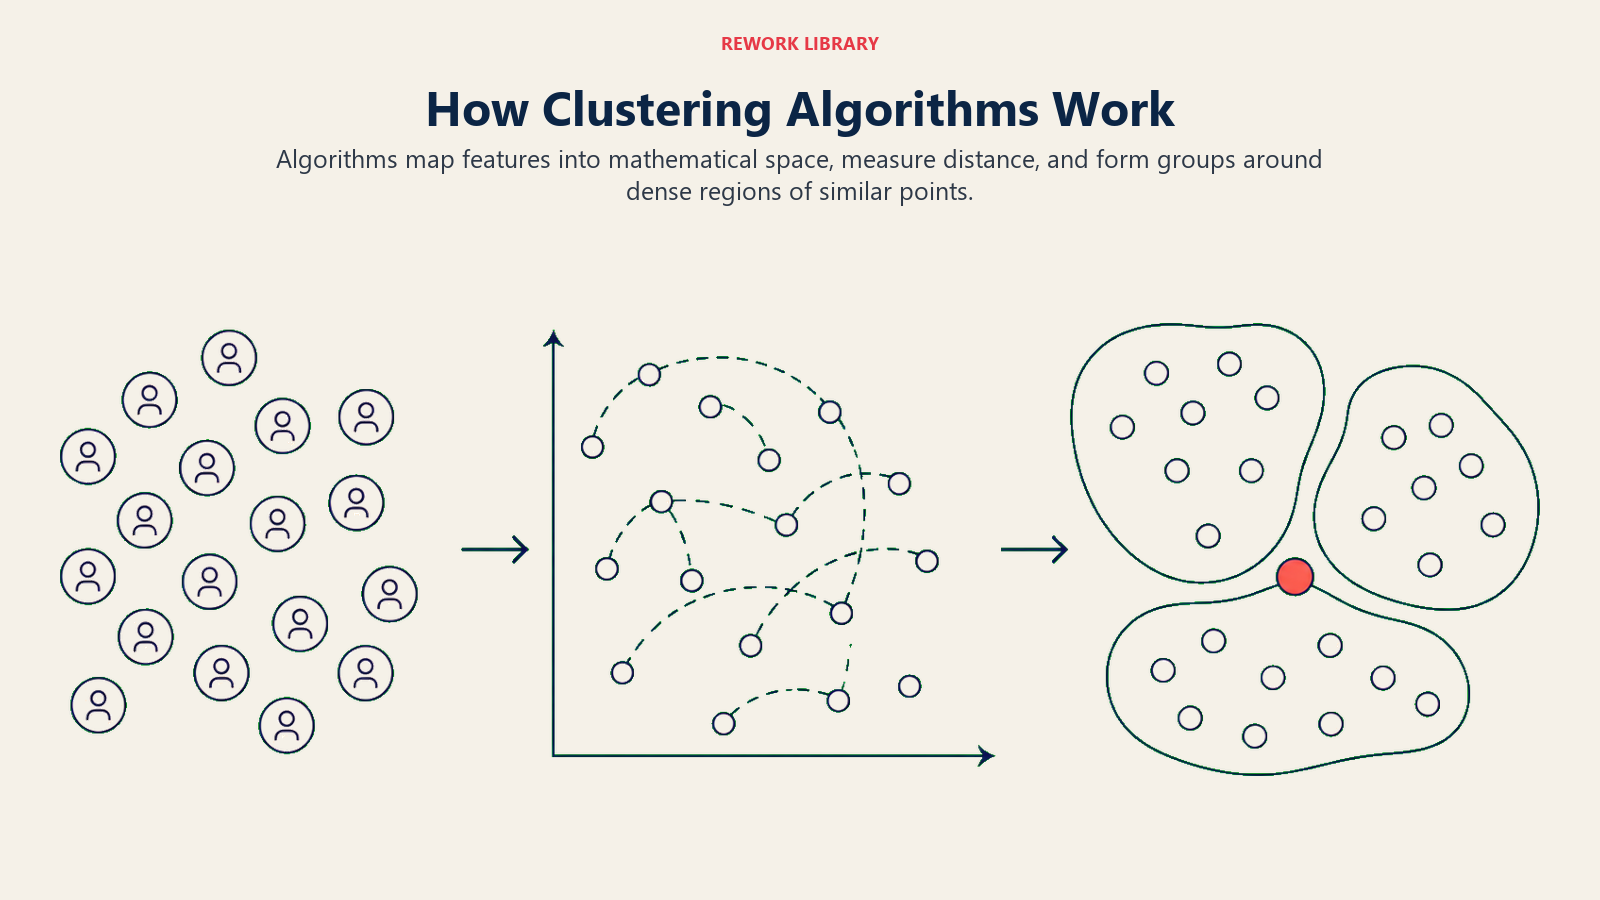
Then, algorithms calculate distances between all points. Similar items are close together, different items far apart. A luxury buyer and budget shopper might be distant even if they're the same age and location.
Finally, groups form based on proximity. The algorithm draws boundaries around dense areas of similar points. You might discover five distinct customer segments where you thought you had two.
The magic happens in defining "similarity" - modern machine learning algorithms can handle hundreds of dimensions and complex relationships humans can't visualize.
Real-World Clustering Applications
Retail Customer Segmentation A fashion retailer applied clustering to purchase history, browsing behavior, and return patterns. Discovered seven segments including "trend followers" (buy immediately after launch) and "sale hunters" (only purchase discounted items). Personalized marketing to each segment increased revenue 34%.
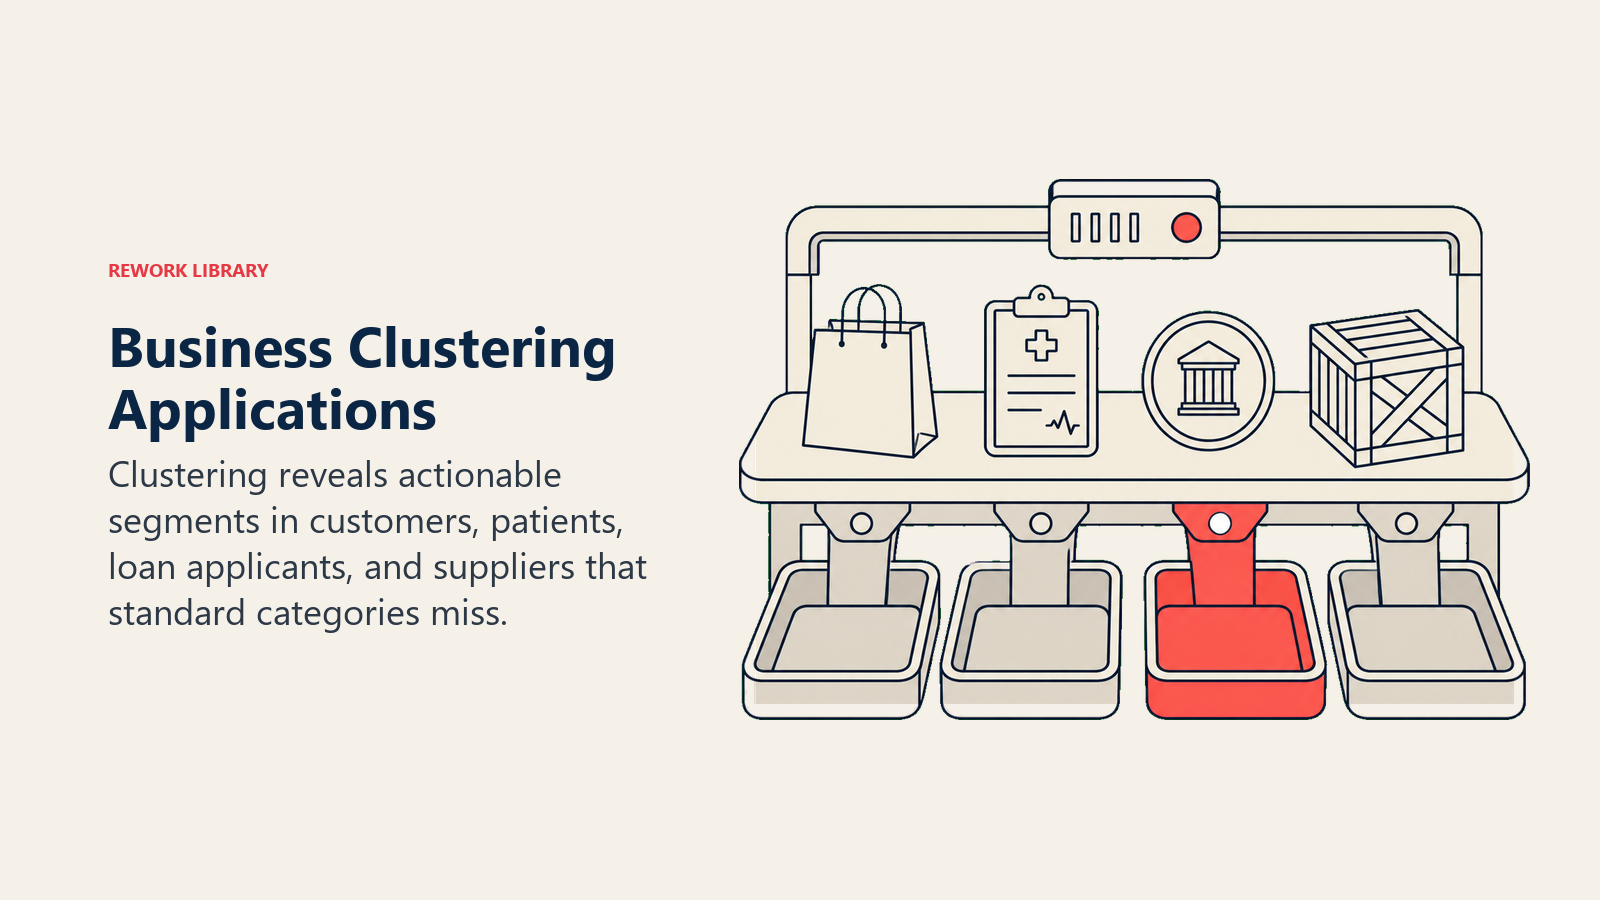
Healthcare Patient Groups Hospital clustered patient data beyond traditional risk factors. Found subgroups responding differently to treatments. One diabetes cluster responded 3x better to lifestyle interventions than medication. Treatment personalization improved outcomes 40%.
Financial Risk Assessment Bank clustered small business loan applicants using financial metrics, industry data, and transaction patterns. Identified risk clusters traditional scoring missed. Default rates dropped 25% while approval rates increased 15%.
Supply Chain Optimization Manufacturer clustered suppliers by delivery performance, quality metrics, and communication patterns. Revealed hidden reliability patterns. Restructured supplier relationships, reducing delays by 30%.
Types of Clustering Algorithms
K-Means Clustering The workhorse of clustering. You specify how many clusters you want, it finds the best groupings. Perfect for customer segmentation where you need distinct, non-overlapping groups. Fast and scalable.
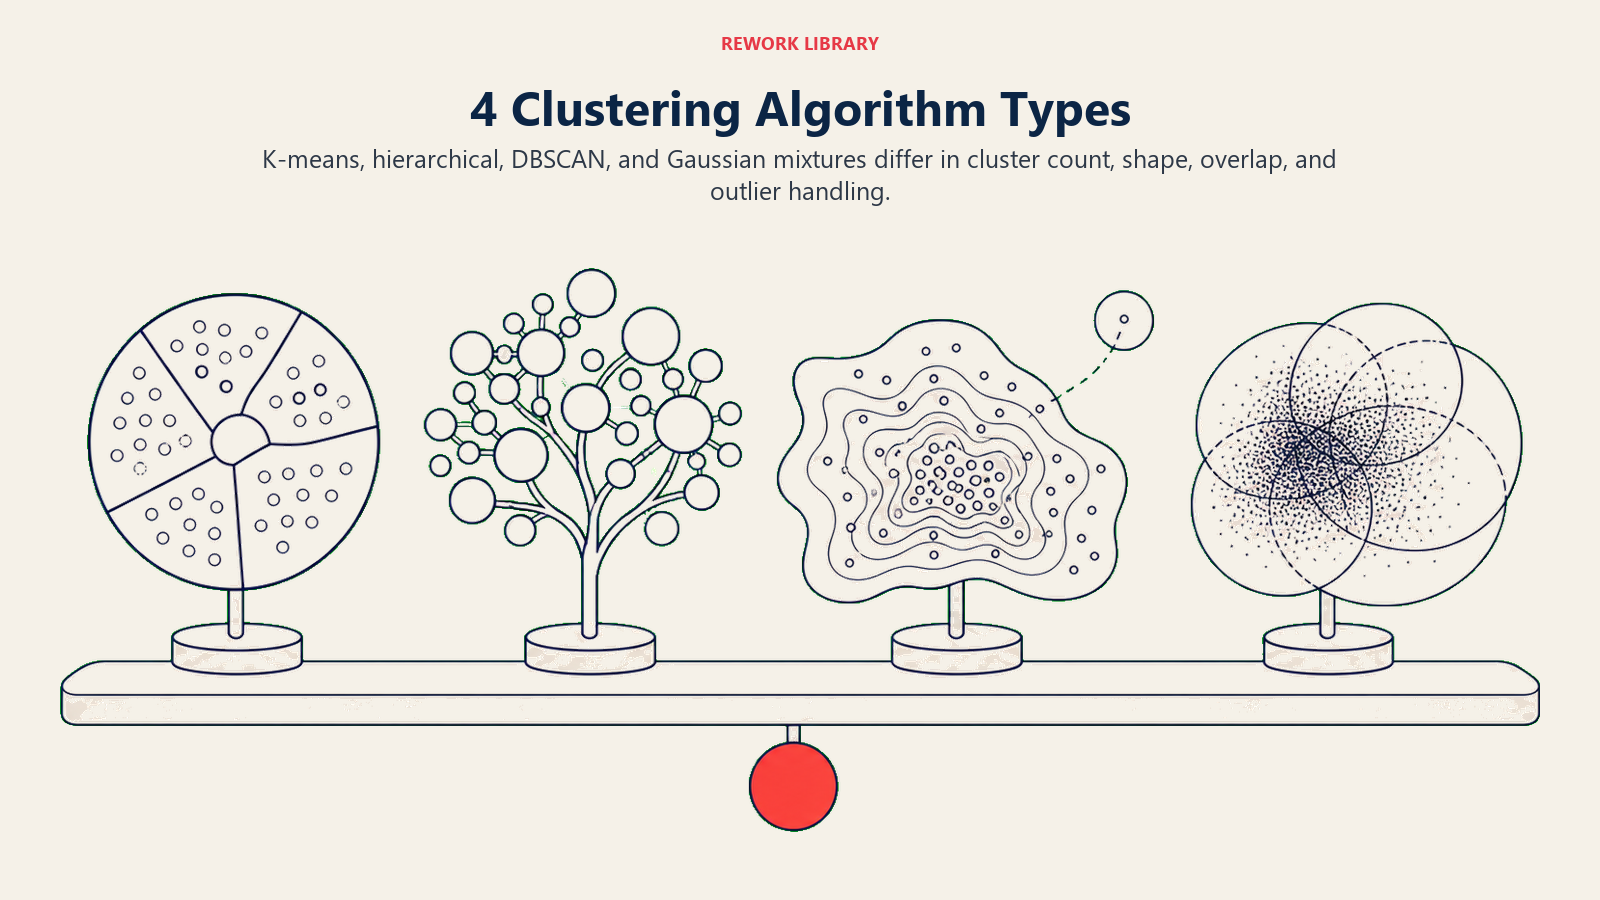
Hierarchical Clustering Builds a tree of clusters - like organizing a company from departments to teams to individuals. Great when you need different levels of granularity. Retail chains use this for store groupings.
DBSCAN (Density-Based) Finds clusters of arbitrary shape and identifies outliers. Excellent for fraud detection and anomaly detection - normal transactions cluster together, fraudulent ones stand out as outliers.
Gaussian Mixture Models Assumes data comes from multiple statistical distributions. Sophisticated but powerful. Used in manufacturing to identify different quality states in production.
Picking the right algorithm comes down to whether you already know how many groups you expect, whether the groups overlap, and whether you need to flag outliers. This table maps each algorithm to the business situation it fits best:
| Algorithm | Need to set cluster count? | Handles outliers | Best business use |
|---|---|---|---|
| K-Means | Yes | No (forces every point into a group) | Clean, distinct customer segments |
| Hierarchical | No | Limited | Store or product groupings at multiple levels |
| DBSCAN | No | Yes (isolates them) | Fraud and anomaly detection |
| Gaussian Mixture | Yes | Soft (probabilistic) | Overlapping segments, quality states |
A practical rule: start with K-Means when you want simple, non-overlapping segments and have a rough idea of how many to expect, then test DBSCAN if your data has noise or you care about the points that don't fit any group. Hierarchical clustering earns its place when one segmentation has to serve several decisions at once, like a regional view and a store-level view from the same data.
The Clustering Difference
Before Clustering: Marketing sends same campaign to "Women 25-34" After Clustering: Five distinct segments identified:
- Career-focused professionals (respond to efficiency messaging)
- New mothers (value safety and convenience)
- Fitness enthusiasts (want performance features)
- Budget-conscious students (price-sensitive)
- Eco-conscious buyers (sustainability matters)
Result: Click-through rates increased 250%. Same audience, smarter segmentation.
When Clustering Makes Sense
Imagine you have thousands of products but don't know how to organize them. Traditional categories (electronics, clothing) are too broad. Clustering reveals natural groupings based on how customers actually shop - "grab-and-go essentials" or "research-heavy purchases."
Or say you're entering a new market. You don't know the customer segments yet. Clustering analyzes early adopters and reveals distinct user types to target.
Implementation Roadmap
Week 1: Data Preparation
- Gather relevant features (behavior > demographics)
- Clean and normalize data through proper data curation (critical for clustering)
- Remove obvious outliers
- Create derived features (ratios, frequencies)
Week 2: Exploration
- Try multiple algorithms
- Experiment with different numbers of clusters
- Validate results make business sense
- Get stakeholder input on groupings
Week 3-4: Validation
- Test cluster stability over time
- Ensure clusters are actionable
- Calculate business metrics per cluster
- Design cluster-specific strategies
Month 2+: Operationalization
- Automate cluster assignment for new data via MLOps practices
- Create monitoring dashboards
- Develop cluster-specific treatments
- Measure impact and refine
Tools for Clustering
No-Code Solutions:
- Tableau - Built-in clustering ($70/user/month)
- Microsoft Power BI - Auto-clustering features ($10/user/month)
- Google Analytics 4 - Audience discovery (Free with limits)
Python Libraries (Free):
- scikit-learn - All major algorithms
- HDBSCAN - Advanced density clustering
- pyclustering - Specialized algorithms
Enterprise Platforms:
- SAS Enterprise Miner - Full clustering suite (Custom pricing)
- IBM SPSS Modeler - Visual clustering ($99/user/month)
- DataRobot - Automated clustering ($75K+/year)
Cloud Services:
- AWS SageMaker - Built-in clustering ($0.05/hour)
- Google Vertex AI - AutoML clustering ($20/hour)
- Azure ML - Clustering modules ($9.90/compute hour)
Common Clustering Pitfalls
Pitfall 1: Forcing Wrong Number of Clusters CEO wants 5 customer segments because competitors have 5. Data clearly shows 3 or 8 natural groups. Solution: Let data guide cluster numbers. Use elbow plots and silhouette scores. Business logic should refine, not define.
Pitfall 2: Using Wrong Features Clustering customers by age and income when purchase behavior varies more by lifestyle and values. Solution: Focus on behavioral and transactional features. Demographics are supporting actors, not leads.
Pitfall 3: Ignoring Cluster Evolution Customer segments defined in 2019, never updated. COVID changed everything. Solution: Reclustering quarterly or when major events occur. Implement model monitoring to track cluster drift.
Advanced Clustering Strategies
Multi-View Clustering Combine different data perspectives. Cluster customers by purchase behavior AND support interactions AND website activity. Reveals richer segments.
Semi-Supervised Clustering Incorporate some known labels to guide clustering. "We know these are VIP customers, find similar groups." Balances discovery with business knowledge.
Dynamic Clustering Clusters that evolve over time. Track how customers move between segments. Use time series analysis to predict segment transitions. Enable proactive interventions.
Measuring Clustering Success
Technical Metrics:
- Silhouette coefficient (cluster separation)
- Davies-Bouldin index (cluster compactness)
- Calinski-Harabasz score (cluster definition)
Business Metrics:
- Revenue per cluster
- Marketing response rates by cluster
- Retention differences between clusters
- Operational costs per cluster
Actionability Test: Can you create distinct strategies per cluster? If all clusters get same treatment, clustering failed.
Industry-Specific Clustering
E-commerce:
- Product affinity groups
- Shopping behavior segments
- Seasonal buyer clusters
- Price sensitivity groups
B2B:
- Account segmentation
- Usage pattern groups
- Growth potential clusters enhanced by predictive analytics
- Risk profile segments
Healthcare:
- Patient risk groups
- Treatment response clusters
- Resource utilization segments
- Outcome prediction groups
Making Clustering Work for You
Look, clustering isn't magic. But if you're treating all customers the same, you're leaving money on the table.
Start small: cluster your top 1000 customers by purchase behavior. You'll find segments you never imagined.
Learn More
Explore related concepts to deepen your understanding of clustering and data-driven discovery:
- Unsupervised Learning - The broader category of ML techniques that discover patterns without labels
- Deep Learning - Advanced neural approaches for complex clustering tasks
- Neural Networks - The underlying architecture powering modern clustering algorithms
- Business Intelligence - How clustering insights feed into strategic decision-making
External Resources
- Stanford HAI: Clustering Research - Academic research on clustering algorithms
- Scikit-learn Clustering Guide - Practical implementation documentation
- Papers With Code: Clustering - Latest clustering techniques and benchmarks
Frequently Asked Questions about Clustering
What is Clustering?
Clustering is an unsupervised machine learning technique that groups similar data points together based on their characteristics, discovering natural patterns without being told what to look for.
What's the difference between clustering and classification?
Classification predicts categories when you already know what categories exist. Clustering discovers unknown groups in data without predefined labels or categories.
What are the four main types of clustering algorithms?
K-Means (specify number of clusters), Hierarchical (builds tree of clusters), DBSCAN (finds arbitrary shapes and outliers), and Gaussian Mixture Models (assumes statistical distributions).
What are the key benefits of clustering for business?
Discovery of hidden customer segments, improved personalization, better market understanding, resource optimization, and identification of patterns that traditional segmentation misses.
What are common pitfalls in clustering implementation?
Forcing wrong number of clusters (let data guide), using wrong features (focus on behavior over demographics), and ignoring cluster evolution (segments change over time).
Part of the AI Terms Collection. Last updated: 2026-07-21

Co-Founder, Rework.com
On this page
- Understanding Clustering
- How Clustering Actually Works
- Real-World Clustering Applications
- Types of Clustering Algorithms
- The Clustering Difference
- When Clustering Makes Sense
- Implementation Roadmap
- Tools for Clustering
- Common Clustering Pitfalls
- Advanced Clustering Strategies
- Measuring Clustering Success
- Industry-Specific Clustering
- Making Clustering Work for You
- Learn More
- External Resources