New vs Used Vehicle Profitability - 2026 Guide
Turn this article into takeaways for your work.
Each assistant summarizes the article only for you and suggests best practices for your work.
Walk into a dealer's finance office 20 years ago and you'd see a business built on new vehicle sales. Used cars were an afterthought - something to do with trade-ins while the real money came from franchise allocation.
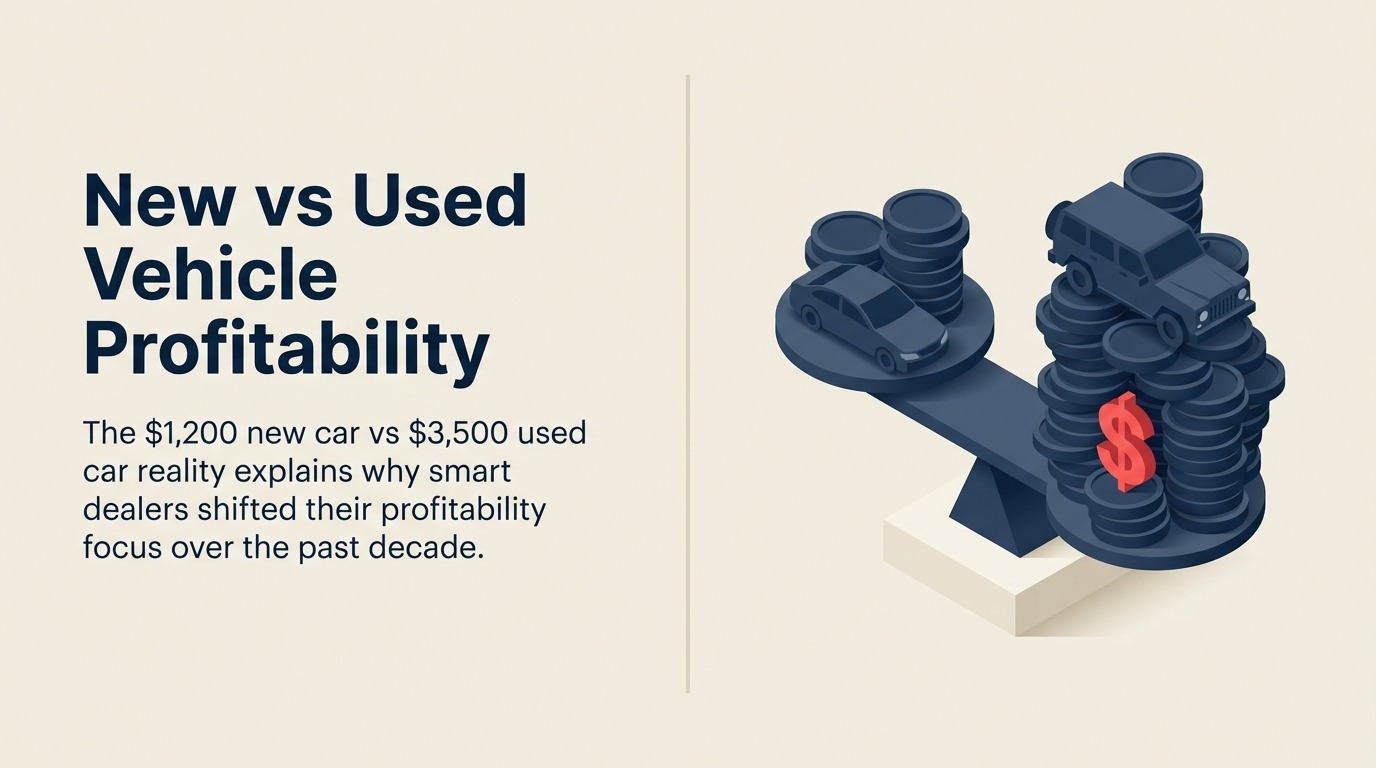
Today, the best-performing dealerships generate 50-60% of vehicle gross profit from used car operations. They don't make more selling new vehicles - they make less. And they've optimized accordingly.
This isn't about market conditions or temporary trends. The fundamental economics of new vs used vehicle profitability shifted, and dealers who recognized it early pulled ahead while others kept chasing shrinking new car margins.
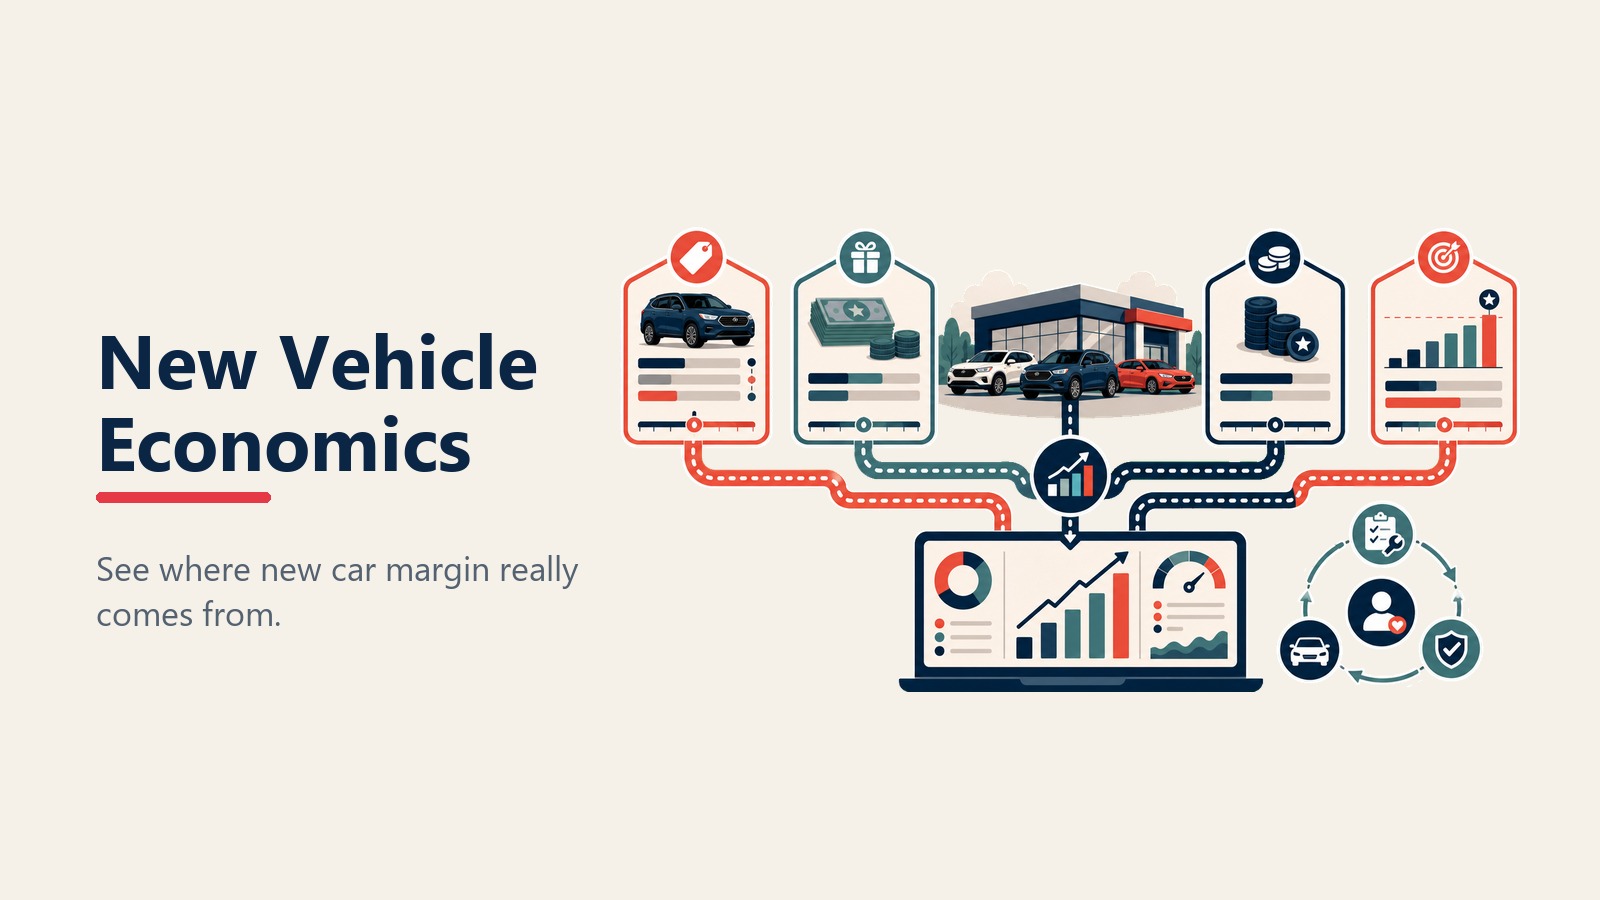
New Vehicle Economics
Let's start with the reality of new vehicle profitability in 2026, because most customers still think you're making $5,000-$8,000 per sale.
Invoice vs MSRP reality sets the foundation. MSRP (Manufacturer's Suggested Retail Price) runs 8-13% above invoice depending on brand and segment. A $40,000 MSRP vehicle has roughly $36,400 invoice pricing.
But here's what customers miss: you rarely sell at MSRP (except on high-demand limited inventory), and invoice isn't your actual cost.
Manufacturer incentives and holdbacks reduce your true vehicle cost below invoice. Holdback is typically 2-3% of MSRP ($800-$1,200 on a $40,000 vehicle) that the manufacturer withholds from invoice pricing but reimburses after you sell the unit.
Dealer cash incentives add another $500-$2,000 depending on model priority and inventory age. Regional advertising credits contribute $200-$400. Floor plan assistance can offset 30-60 days of interest costs.
When you factor in all programs, your actual cost on that $36,400 invoice vehicle might be $34,800-$35,600.
Volume bonuses and stair-step programs create the biggest profit opportunity and the biggest risk. Hit your monthly target (let's say 120 units) and earn $500 per vehicle retroactively - a $60,000 bonus. Miss the target by 3 units and earn nothing.
This is why dealers sell vehicles at invoice or below on the last day of the month. They're not being generous or desperate. They're protecting six-figure bonus payments that make up for thin per-unit margins.
True front gross after all incentives averages $2,400-$3,200 per vehicle when you include holdback, dealer cash, and volume bonuses. But this assumes you hit your targets and maximize programs.
Without volume bonuses, average front gross drops to $1,200-$1,800 per new vehicle. And that's before sales commissions ($300-$450), advertising costs ($200-$300), BDC expenses ($80-$120), and floor plan interest ($200-$400).
Your net profit per new vehicle sale? Around $400-$900 from front-end gross alone.
Why new vehicles build service customers is the strategic value beyond immediate profit. Customers who buy new vehicles from you are 3x more likely to service with you compared to used vehicle buyers. They're under warranty (which drives early service visits), they trust your brand expertise, and they've already established the relationship.
New vehicle customers generate $3,500-$5,500 in service gross profit over the first 5 years of ownership. They also become your repeat and referral source when it's time to trade.
But if you're counting on service retention to justify new vehicle losses, you need retention systems that actually work - not just hopes that customers come back.
Used Vehicle Economics
This is where the math shifted in dealers' favor over the past 15 years.
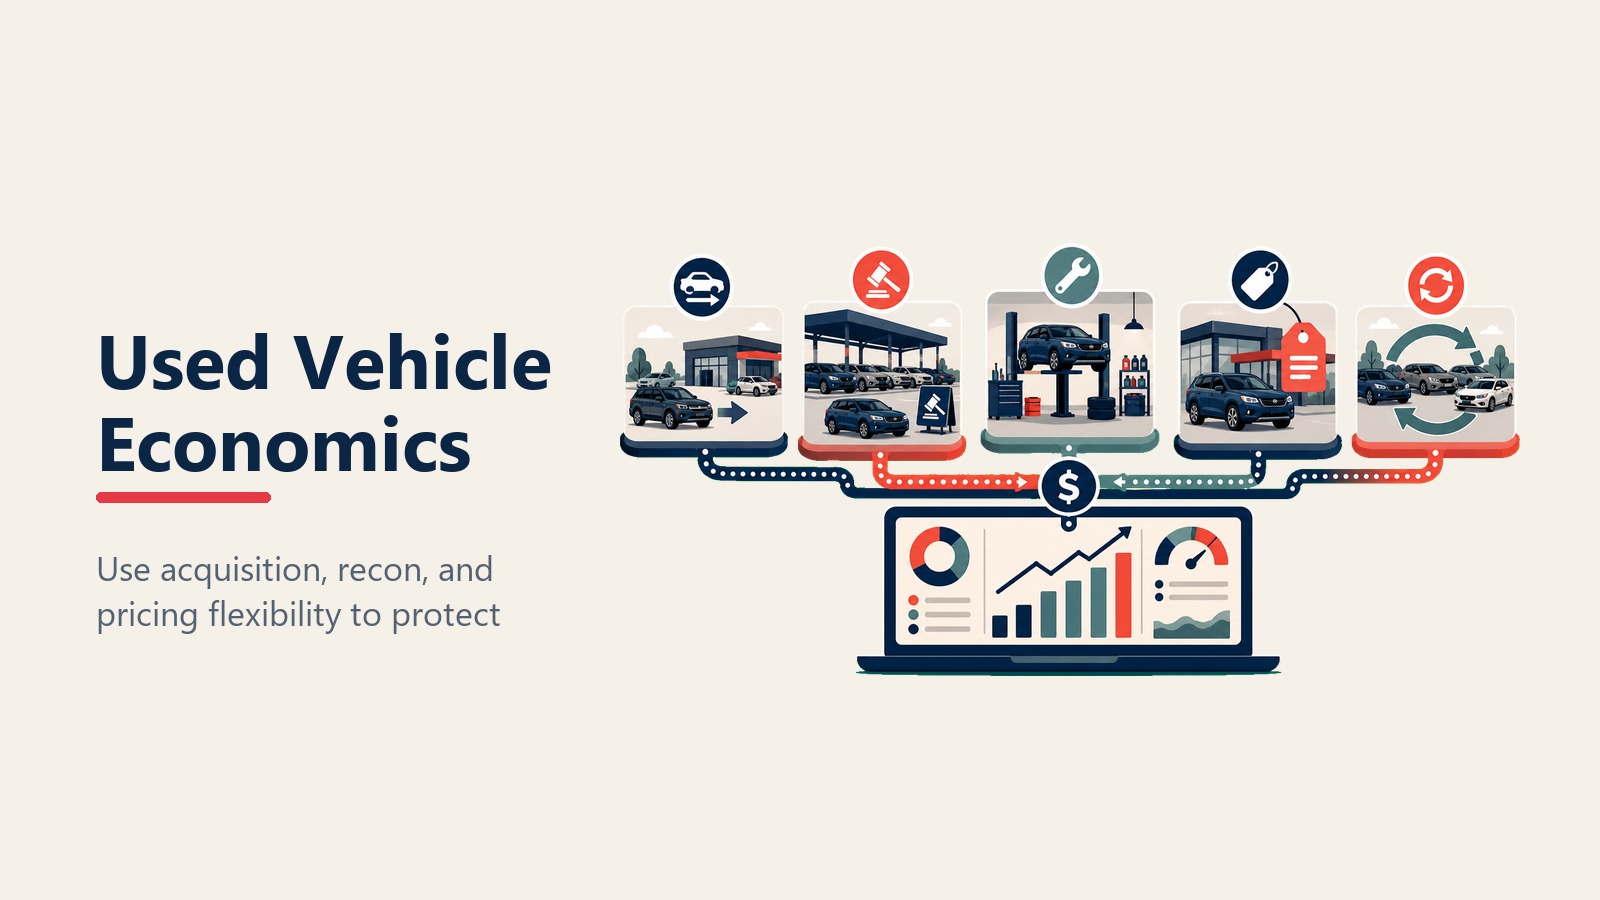
Acquisition cost advantages determine everything in used vehicle profitability. Trade-ins typically offer the best margins because customers prioritize convenience over maximizing value. They want immediate credit toward their new purchase, and they don't want to deal with private party sales.
You're acquiring vehicles at wholesale market value or below, which creates $2,000-$4,000 in acquisition advantage before you even recondition and list the vehicle.
Auction purchases give you selection and volume but reduce margin. You're bidding against other dealers, independent lots, and wholesalers. Strong auction buyers know market trends, can assess condition quickly, and have discipline to walk away from overpriced units.
Off-lease vehicles through manufacturer CPO programs offer certified product but tighter margins because acquisition costs run higher. You're paying close to market wholesale because the manufacturer knows the vehicle's value.
Higher gross profit potential on used vehicles runs $2,500-$4,000 on average across all segments. Luxury and specialty vehicles can hit $5,000-$7,500 gross. High-demand trucks and SUVs in good condition generate $4,500-$6,500.
You're not constrained by MSRP or manufacturer pricing. You set retail price based on market conditions, vehicle condition, and competitive landscape. That pricing flexibility creates margin opportunity that doesn't exist in new vehicle sales.
No factory allocation constraints means you can sell as many used vehicles as you can acquire and market. New vehicle sales hit a ceiling when the manufacturer caps your allocation. Used vehicle sales scale with your acquisition capability and lot capacity.
This is why multi-franchise dealers often expand used vehicle operations faster than adding new franchises. The growth path is clearer and the economics are better.
Market-based pricing flexibility allows you to respond to demand in real-time. Hot-selling model with limited supply? Price it aggressively and take maximum margin. Aging inventory that's been on the lot 60+ days? Discount it and turn the asset before holding costs erode profit.
You can't do this with new vehicles because manufacturer programs and market transparency limit pricing decisions.
CPO program margins vs non-certified creates an interesting profitability comparison. Certified Pre-Owned vehicles require meeting manufacturer age, mileage, and condition standards. You pay certification fees ($600-$1,200), but you gain factory warranty backing, manufacturer marketing support, and customer confidence.
CPO vehicles typically generate $2,800-$3,800 gross profit and sell in 18-25 days. Non-certified used vehicles generate $3,500-$5,200 gross but take 35-50 days to sell.
When you factor in holding costs ($20 per day average), the CPO vehicle delivers better annualized profit despite lower per-unit gross. You're turning the asset faster and freeing capital for the next acquisition.
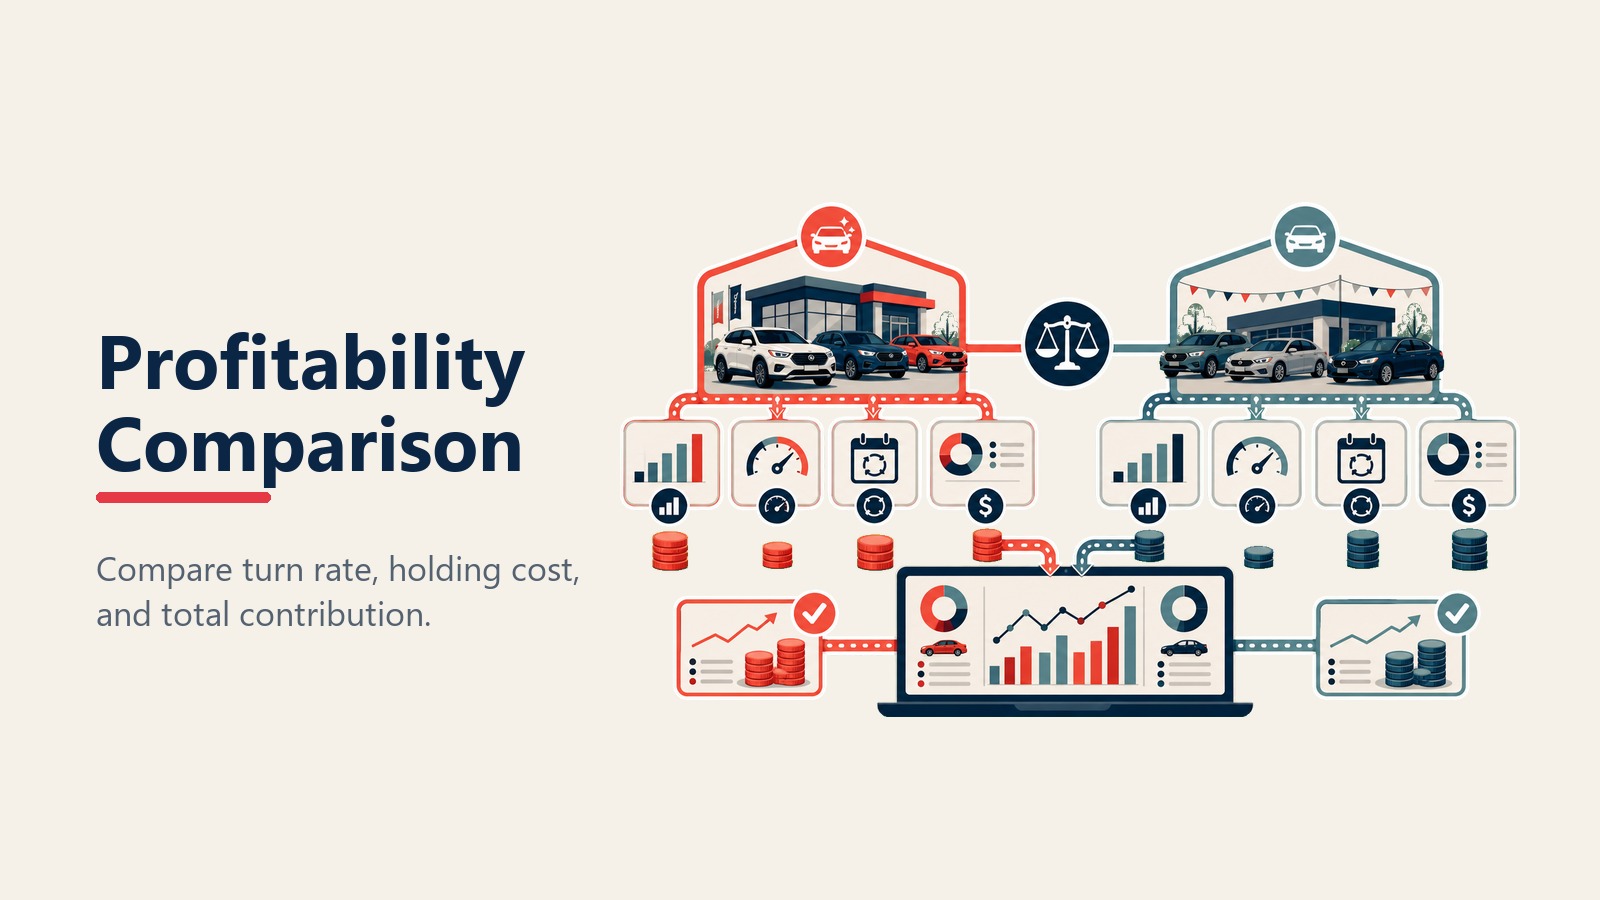
The Profitability Comparison
Let's run the actual numbers comparing new vs used vehicle operations.
Average gross per unit breaks down like this:
- New vehicles: $2,200 front gross + $1,800 F&I = $4,000 total gross
- Used vehicles: $3,600 front gross + $1,600 F&I = $5,200 total gross
Used vehicles generate $1,200 more gross profit per sale before considering costs. But costs differ too.
Turn rate differences affect profitability significantly. New vehicles in high demand turn in 20-35 days. Slower-selling models sit 45-75 days. Used vehicles should turn in 30-45 days on average, with CPO units at 18-28 days.
The faster you turn inventory, the less you pay in floor plan interest and the more capital efficiency you generate.
Days to sale impact on profit creates this scenario:
- New vehicle: $4,000 total gross, 45-day average turn, $22 daily holding cost = $990 holding cost. Net gross: $3,010.
- Used vehicle: $5,200 total gross, 32-day average turn, $18 daily holding cost = $576 holding cost. Net gross: $4,624.
The used vehicle delivers 54% higher net gross profit per sale with faster turn rate.
Holding costs comparison runs $20-$28 per day for new vehicles (higher floor plan interest due to higher vehicle cost) and $15-$22 per day for used vehicles. But the bigger difference is turn rate - new vehicles tend to sit longer while waiting for the right buyer.
Total contribution including F&I factors in that new vehicle buyers finance at slightly higher rates (better credit, newer vehicles) and purchase F&I products at higher penetration (60-70% vs 50-60% for used vehicles).
But even with better F&I attachment, total contribution favors used vehicles because front-end gross advantage outweighs F&I differences.
The math: dealership selling 60% new and 40% used generates lower total gross profit than a dealership selling 45% new and 55% used with the same unit volume.
Strategic Mix Considerations
You can't just sell all used vehicles and ignore new vehicle operations, because OEM relationships and market positioning matter.
OEM requirements and CSI implications mean your manufacturer expects minimum new vehicle volume to maintain franchise agreements. Fall below targets and you risk allocation cuts, facility upgrade requirements, or even franchise termination.
Customer Satisfaction Index (CSI) scores from new vehicle sales also affect manufacturer support, volume bonuses, and program eligibility. J.D. Power CSI studies show that customer satisfaction directly influences manufacturer support and long-term dealership success. You can't abandon new vehicle sales without damaging your franchise relationship.
Service absorption rate impact depends heavily on new vehicle sales volume. New vehicle buyers service at your dealership at 65-75% retention rate in the first 3 years. Used vehicle buyers service at 35-45% rate.
If you want to reach 100%+ service absorption (where service gross profit covers total dealership overhead), you need the customer base that comes from new vehicle sales.
Brand reputation factors come into play because customers perceive new vehicle operations as a mark of legitimacy and manufacturer backing. A lot full of used vehicles with minimal new inventory sends a message about your market position.
Premium and luxury franchises especially depend on new vehicle showroom presentation to maintain brand perception.
Market segment positioning varies by franchise type. Luxury brands run 70% new vehicle sales because customers want the latest models and technology. Volume brands split 50/50 between new and used. Domestic franchises often skew 40% new, 60% used because used trucks and SUVs generate better margins.
Used-to-new ratios by franchise benchmark like this:
- Luxury (Mercedes, BMW, Lexus): 30% used, 70% new
- Import premium (Honda, Toyota): 45% used, 55% new
- Domestic (Ford, GM, Stellantis): 58% used, 42% new
- High-volume import (Nissan, Hyundai, Kia): 50% used, 50% new
Your optimal mix depends on manufacturer requirements, service retention goals, and capital availability for inventory investment.
The CPO Sweet Spot
Certified Pre-Owned programs deserve special attention because they combine the margin benefits of used vehicles with the trust and warranty backing of new vehicle programs.
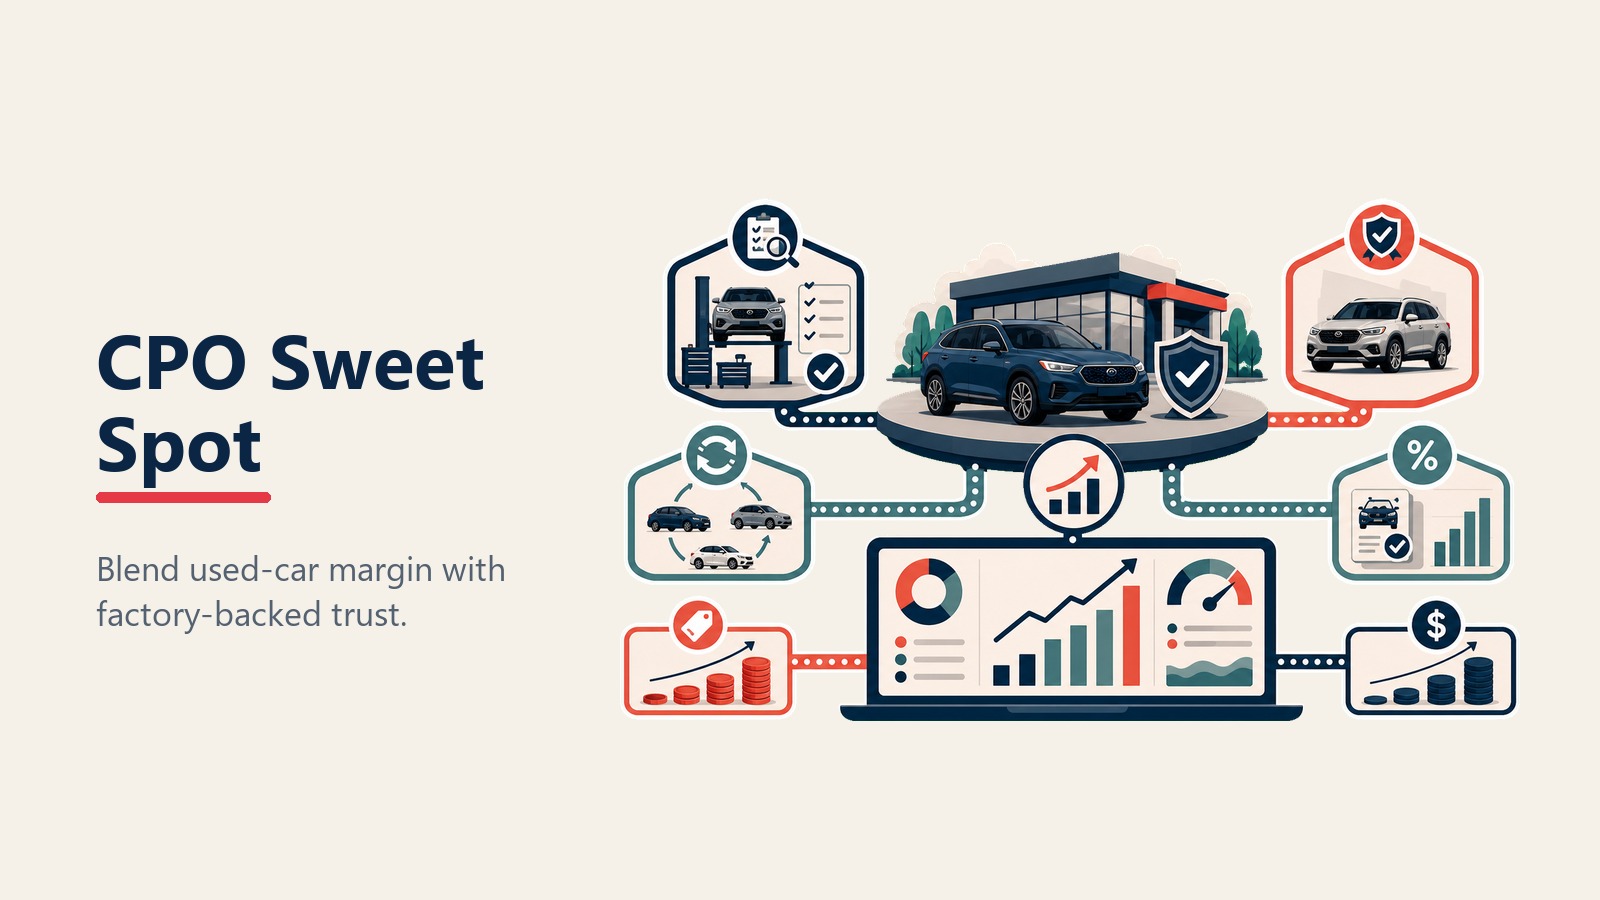
Factory program benefits include extended warranty coverage (typically 1 year / 12,000 miles beyond original warranty), roadside assistance, and manufacturer marketing support. CPO vehicles appear in manufacturer advertising and online inventory systems alongside new vehicles.
This drives customer traffic and increases closing rates because buyers trust factory certification over independent dealer inspections.
Warranty coverage value makes CPO vehicles easier to sell and finance. Banks offer better rates on CPO vehicles (often matching new vehicle rates) because warranty coverage reduces their risk. Customers pay premium prices because they're getting near-new vehicle reliability with used vehicle pricing.
Higher gross than non-certified seems counterintuitive, but it's true in many markets. CPO vehicles command $1,200-$2,500 pricing premium over equivalent non-certified units because buyers value the warranty and certification process. According to NADA data, certified pre-owned programs deliver both margin expansion and faster turn rates compared to non-certified inventory.
Your acquisition cost is similar (maybe $200-$400 higher for certification fees and inspection), but selling price jumps $1,200-$2,500. That's pure margin expansion.
Financing rate advantages improve F&I profitability because lower interest rates increase loan approval rates and allow higher vehicle pricing. A customer with 680 credit score might get 8.9% APR on a non-certified used vehicle but 5.9% APR on CPO.
Lower monthly payments support higher selling prices and improve closing rates.
Lower days-to-sale average 18-25 days for CPO vehicles compared to 35-50 days for non-certified. Customers shopping CPO inventory are ready to buy - they've already decided they want certified coverage and they're comparing vehicles, not deciding whether to purchase.
This turn rate advantage reduces holding costs and improves capital efficiency significantly.
Inventory Strategy Implications
Understanding profitability differences should drive how you allocate capital and make acquisition decisions.
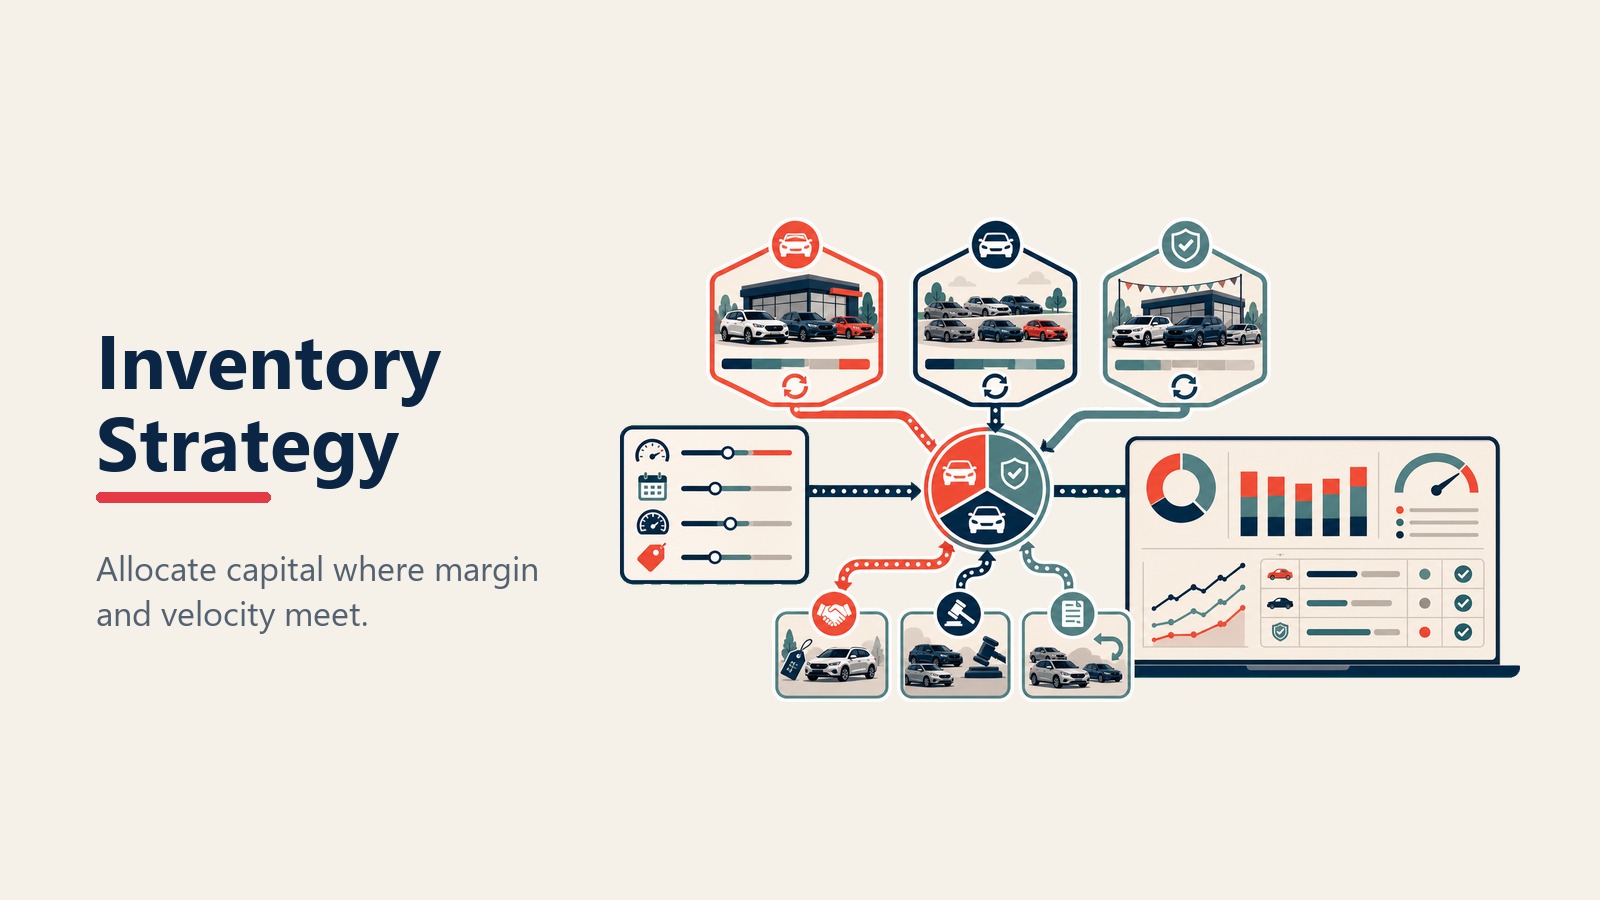
Capital allocation priorities need to balance OEM requirements (minimum new vehicle inventory to maintain allocation) with profit optimization (maximum used vehicle inventory within lot capacity and capital limits).
Most successful dealers run 60-75 days of new vehicle inventory and 45-60 days of used vehicle inventory. This provides selection without excessive holding costs.
Turn goals by vehicle type should target:
- New vehicles: 35-50 days average (varies by model popularity)
- CPO vehicles: 20-30 days average
- Non-certified used: 30-45 days average
- Aged inventory (60+ days): aggressive pricing to move in next 15-30 days
Track turn rate weekly and adjust pricing when vehicles exceed target days-to-sale.
Age/mileage targeting for used vehicle acquisition focuses on the sweet spot where customer demand and profit margin intersect. For CPO programs, you're typically targeting 2-4 years old with under 48,000 miles.
For non-certified used, 3-7 years old with 35,000-85,000 miles generates best margins. Newer vehicles cost more to acquire and compete with new vehicle pricing. Older vehicles require more reconditioning and carry higher risk.
Acquisition source optimization means balancing trade-ins (best margins but limited volume), auction purchases (volume and selection but lower margins), and off-lease CPO (warranty backing but tighter margins).
Top dealers acquire 50-60% from trade-ins, 30-40% from auctions, and 10-15% from lease returns. This mix optimizes margin while providing inventory flow.
Future Trends Impact
The profitability dynamics between new and used vehicles continue shifting, and understanding these trends helps you plan strategically.
EV transition effects on margins create uncertainty because used EV values are volatile and customer demand is still developing. Battery degradation concerns, charging infrastructure gaps, and rapidly improving new EV technology all pressure used EV values.
This might compress used vehicle margins on EVs while new vehicle margins benefit from manufacturer incentives designed to drive EV adoption.
Agency model threat to new vehicle profits is real. Several manufacturers are testing direct-to-consumer sales models where dealers handle delivery and service but don't control pricing or take inventory risk. You earn a fixed commission ($1,000-$2,000 per vehicle) instead of negotiating margin.
If this expands across more brands, new vehicle profitability shifts from gross profit to fixed fees. Used vehicle operations become even more important for dealership profitability.
Online retailing compression affects both new and used vehicle margins as pricing transparency increases and customers complete more of the purchase process online before visiting dealerships. This reduces your negotiating leverage and compresses margins across both segments.
The counter-strategy is building trust, delivering exceptional customer experience, and providing value beyond the vehicle transaction.
Strategic responses for dealers include:
- Expanding used vehicle operations and CPO programs to offset new vehicle margin pressure
- Building service retention systems that maximize lifetime customer value
- Investing in F&I training and product penetration to improve back-end gross
- Developing online retailing capabilities that capture digital shoppers
- Creating customer experience differentiation that justifies premium pricing
The dealers winning in 2026 stopped thinking about new vs used as separate businesses. They're optimizing total profitability across the full vehicle lifecycle - using new vehicle sales to build customer relationships, used vehicle sales to generate margin, CPO programs to combine both benefits, and service operations to maximize lifetime value.
That's the strategic shift that separates profitable growth from just selling more cars. Explore related strategies in automotive dealership growth model, dealership revenue streams, automotive inventory strategy, gross profit optimization, and service absorption rate.

Senior Implementation Consultant