Dealership Revenue Streams: 5 Profit Centers (2026 Data)
Turn this article into takeaways for your work.
Each assistant summarizes the article only for you and suggests best practices for your work.
Ask most customers where dealerships make money, and they'll say vehicle sales with massive markups. Ask most salespeople, and they'll say the same thing. But ask a dealer principal who's actually seen the financials, and they'll tell you the truth: front-end gross profit on new vehicles barely covers the cost to sell them.
The real money comes from places customers never think about and salespeople rarely see. Understanding these revenue streams and their actual profit contribution is what separates struggling dealerships from ones that scale profitably.
New Vehicle Sales Revenue
Let's start with the department everyone thinks drives dealership wealth. New vehicle sales generate revenue from multiple sources, but the total gross profit might surprise you.
Front gross is the difference between what you pay the manufacturer and what the customer pays you. In 2026, average front gross runs $1,200-$2,500 depending on brand and segment. Luxury vehicles pull higher gross ($3,000-$4,500), while domestics and high-volume imports compress to $800-$1,500.
But that's not the whole story. Most customers see MSRP stickers and assume you're making thousands on every sale. They don't see invoice pricing (which is typically 7-12% below MSRP), and they definitely don't see manufacturer incentives that reduce your actual cost.
OEM incentives and holdbacks add $500-$1,500 to your profit on many vehicles. Holdback is typically 2-3% of MSRP that the manufacturer withholds from invoice pricing but refunds after you sell the vehicle. Incentives include floor plan assistance, regional advertising credits, and model-specific bonuses designed to move specific inventory.
These aren't guaranteed on every vehicle, and they change monthly based on manufacturer priorities.
Volume bonuses and stair-step programs create the most significant profit opportunity in new vehicle sales, but they're also the riskiest. Here's how they work: hit 100 units in a month, earn $500 per vehicle retroactively ($50,000 total bonus). Miss 100 units by a single sale, earn nothing.
This is why dealers sometimes sell vehicles at invoice or below on the last day of the month. They're not being generous - they're protecting a six-figure bonus payment.
So are new cars loss leaders? Not quite. When you factor in all revenue sources (front gross, holdback, incentives, and volume bonuses), a well-managed new vehicle department generates $2,500-$3,500 per unit. But here's the catch: sales commissions, advertising costs, BDC expenses, and floor plan interest consume $1,800-$2,200 of that gross.
Your real profit per new vehicle? Around $800-$1,300 before covering overhead.
New vehicle sales serve a strategic purpose beyond immediate profit: they build your customer database, create service opportunities, and generate F&I revenue. They're the front door to a longer relationship, not the profit center themselves.
Used Vehicle Sales Revenue
This is where smart dealers shifted focus over the past decade, and the numbers explain why.
Higher gross potential on used vehicles runs $2,500-$4,000 on average, with luxury and specialty vehicles reaching $5,000-$7,000. You're not constrained by MSRP or invoice pricing. You buy vehicles based on market conditions, recondition them, and price them based on supply and demand.
The market sets your selling price, but you control your acquisition cost. That's power you don't have with new vehicles.
Acquisition cost determines everything in used vehicle profitability. Trade-ins typically offer the best margins because customers prioritize convenience and immediate credit toward their new purchase over maximizing trade value. You're buying below wholesale market.
Auction purchases provide volume and selection but reduce margin because you're competing with other dealers. Off-lease vehicles through manufacturer CPO programs offer certified product with warranty backing, but acquisition costs run higher.
The best used vehicle managers balance acquisition sources to optimize turn rate and gross profit simultaneously.
CPO vs non-certified margins create an interesting trade-off. Certified Pre-Owned programs require vehicles to meet specific age, mileage, and condition criteria. You pay certification fees ($600-$1,200), but you gain warranty coverage, manufacturer marketing support, and customer confidence.
CPO vehicles sell faster (18-22 days average) and generate slightly lower gross ($2,800-$3,200) compared to non-certified used ($3,500-$4,200 gross, 30-40 days to sale). But when you factor in faster turn rate and lower holding costs, CPO often delivers better annual profitability.
Turn rate vs gross profit trade-offs define your used vehicle strategy. You can hold out for maximum gross and watch vehicles age on your lot (costing $15-$25 per day in floor plan interest), or you can price aggressively for fast turn and generate volume-based profit.
Most successful dealers target 30-45 day turn rates and accept slightly lower gross in exchange for inventory velocity. The math works: selling 100 vehicles at $3,000 gross with 30-day turn generates more annual profit than selling 80 vehicles at $3,800 gross with 50-day turn.
Used vehicle operations contribute 30-35% of total dealership gross profit, and they do it without OEM allocation constraints, stair-step stress, or fixed MSRP pricing. This is why multi-franchise dealers often expand used vehicle operations faster than new.
Finance & Insurance Revenue
Here's the department that changed everything about dealership economics over the past 20 years.
Reserve income from lenders represents the difference between the interest rate the bank approves and the interest rate you sell to the customer. If a customer qualifies for 5.9% APR but accepts 7.4%, you earn the 1.5% spread as reserve income over the life of the loan.
This used to generate huge F&I profits ($1,000-$1,500 per deal) until regulations limited dealer markup to 1.25-2.00% depending on jurisdiction. Today, reserve income contributes $300-$600 per deal on financed purchases. According to NADA financial benchmarks, average F&I per vehicle retail (PVR) runs $1,900-$2,400 depending on dealership type and market conditions.
But most F&I profit comes from product sales, not rate markup.
Extended warranty commissions generate $600-$1,200 per contract sold. You're selling vehicle service contracts (VSCs) that cover mechanical repairs after manufacturer warranty expires. Customers pay $1,800-$3,500 depending on coverage term and deductible. You earn 40-60% commission from the warranty provider.
Top F&I managers sell VSCs on 65-75% of financed deals by demonstrating value (repair cost protection) rather than pushing price. Average performers hit 35-45% penetration.
GAP insurance, maintenance plans, and ancillary products add $800-$1,400 in F&I profit per deal. GAP covers the difference between insurance payout and loan balance if the vehicle is totaled. Maintenance plans prepay scheduled service. Tire and wheel protection, key replacement, paintless dent repair, and theft protection round out the menu.
Each product addresses a real customer need, which is why educated F&I presentation drives penetration. Customers who understand what they're buying see value. Customers who feel pushed say no.
Why F&I represents 40-60% of total gross becomes clear when you run the math. A typical deal generates $1,800 front gross, $1,400 F&I gross, totaling $3,200 gross profit. F&I contributed 44% of total gross without any inventory risk, floor plan costs, or reconditioning expenses.
Scale this across 100 deals per month, and F&I delivers $140,000 in monthly gross profit. That's why dealer principals invest in F&I training, menu design, compliance systems, and compensation plans that incentivize performance.
The best F&I departments average $2,000-$2,200 PVR (per vehicle retail) by combining rate reserve, warranty penetration, and multi-product menus. Average departments struggle to hit $1,400 PVR because they view F&I as transaction completion rather than value delivery.
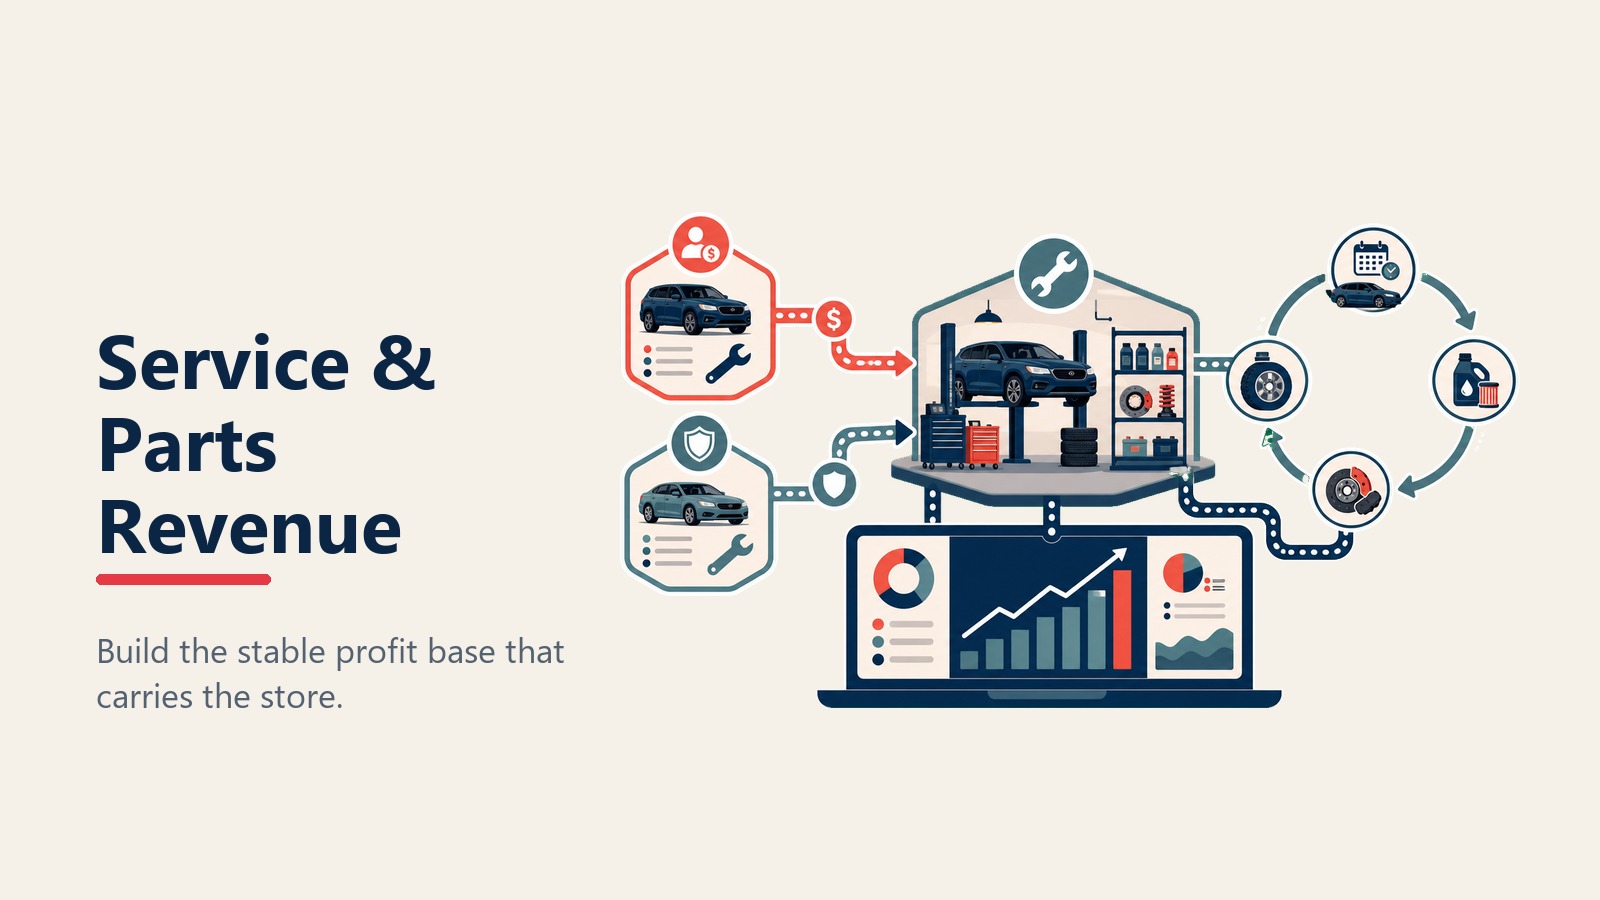
Service & Parts Revenue
This is your profit stabilizer - the department that keeps you operating when vehicle sales slow down.
Customer pay vs warranty work defines service profitability. Customer pay service (maintenance, repairs, and diagnostics that customers fund directly) generates 60-70% gross margin. You control labor rates ($125-$195 per hour), parts markup (30-40% over cost), and shop supply fees.
Warranty work pays whatever the manufacturer authorizes, which is typically 30-40% below your customer pay rates. You still make money on warranty claims, but margin drops to 10-15% because OEM reimbursement doesn't match retail pricing.
High-performing service departments maximize customer pay hours through retention programs, service marketing, and value-added services. They process warranty work efficiently but don't depend on it for profitability.
Internal vs retail parts sales creates two revenue streams within parts department. Internal parts support service repairs (70-80% of parts revenue). Retail parts sales (over-the-counter purchases for DIY customers) add 15-20%.
Some dealerships wholesale parts to independent repair shops, body shops, and fleet operations. This generates volume but reduces margin to 10-15% over cost.
Maintenance contracts sold in F&I feed service retention and parts revenue. When customers prepay maintenance through F&I, they're more likely to return to your dealership for service (85-90% retention vs 35-40% without contracts). They're also more likely to approve recommended repairs because they're already in your system.
Smart dealers view prepaid maintenance as customer acquisition cost for service department, not just F&I profit.
Collision center operations diversify revenue and capture accident-related repairs that customers might otherwise take to independent body shops. Collision centers generate 35-45% gross margin through insurance-paid repairs and run independently from service operations.
Not all dealerships operate collision centers (requires separate facility, different technicians, and insurance certification), but those that do add $500K-$2M in annual gross profit.
Service and parts contribute 40-50% of total dealership gross profit and create the foundation for sustainable operations. When your service absorption rate (service gross profit divided by total fixed costs) exceeds 100%, you've built a dealership that survives market downturns. Cox Automotive dealer profitability data shows that dealerships with strong fixed operations demonstrate greater resilience during periods of new vehicle sales volatility.
Other Revenue Sources
Beyond the core departments, successful dealerships tap into additional revenue opportunities that many competitors ignore.
Lease renewals and equity captures generate sales without marketing cost. When a lease approaches maturity, you already have the customer relationship, vehicle history, and financing information. Reaching out 90 days before lease end with upgrade options converts 25-35% of lessees into new sales.
Customers with owned vehicles also build equity over time. When a customer owes $18,000 on a vehicle worth $24,000, that's $6,000 in trade equity you can apply toward a new purchase. Proactive equity mining (tracking customer accounts and initiating trade conversations) converts 8-12% of service customers annually.
Wholesale vehicle disposition handles trade-ins you don't want to retail. Off-brand trades, high-mileage vehicles, or units with condition issues go to auction. You're not generating huge profit ($200-$500 per unit after auction fees and transportation), but you're moving inventory that would otherwise sit aging on your lot.
Some dealers develop wholesale relationships with independent lots who buy inventory directly, eliminating auction costs.
Aftermarket accessories (window tint, remote start, bed liners, roof racks, paint protection, all-weather mats) add $400-$800 in gross profit per sale when integrated into vehicle delivery. Customers buying trucks want bed liners and tonneau covers. Customers in climates with harsh winters want remote start and all-weather protection.
Offering these accessories during F&I presentation or delivery increases attachment rate from 15-20% to 45-60% compared to asking at point of sale.
Fleet and commercial sales create volume opportunities for dealers located near business centers or municipal operations. Fleet sales generate lower gross per unit ($800-$1,200) but require less marketing investment and sales process time. A fleet order for 15 vehicles closes in one transaction.
The real value in fleet sales is service retention. Commercial customers service vehicles regularly, pay invoices promptly, and generate consistent service revenue over vehicle lifecycle.
The Shift in Profit Mix (2015 vs 2026)
The composition of dealership profit changed dramatically over the past decade, and understanding this shift helps you optimize for current market reality.
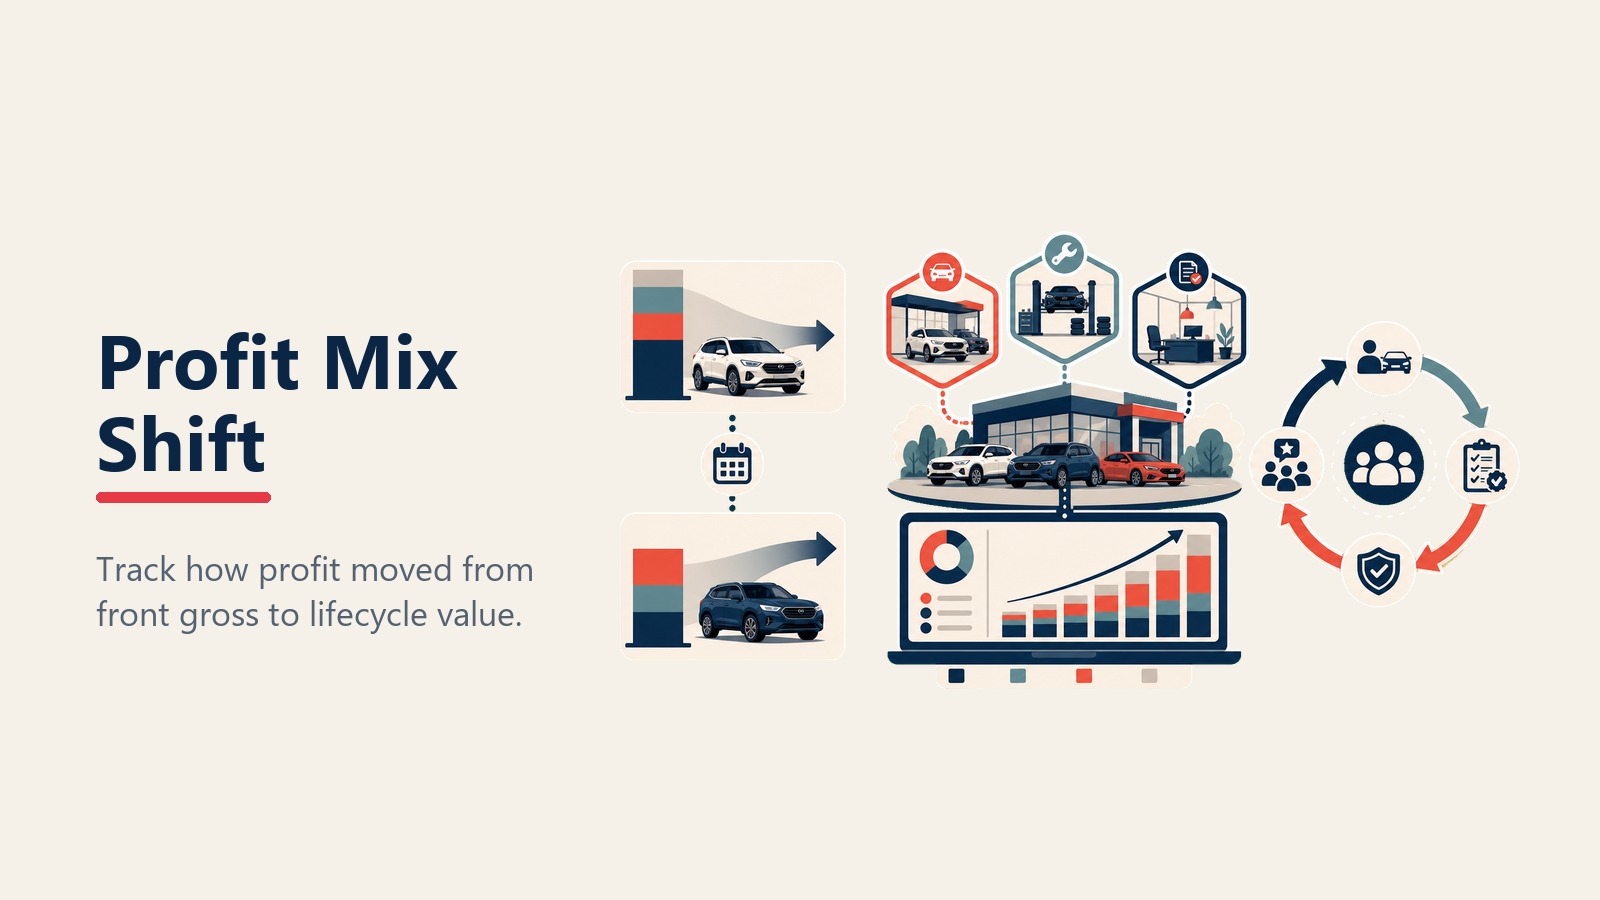
In 2015, new vehicle sales contributed 45-50% of total gross profit. Front gross averaged $2,800-$3,200 before manufacturer programs compressed pricing. F&I generated 25-30% of gross profit at $1,200-$1,400 PVR. Service and parts delivered 25-30%.
In 2026, F&I now contributes 40-45% of gross profit at $1,800-$2,200 PVR. Service and parts grew to 40-45%. New vehicle sales dropped to 30-35% as margin compression and allocation constraints limited growth. Used vehicles expanded share within variable operations. Industry analysis shows this profit mix evolution reflects fundamental changes in automotive retail economics and consumer behavior.
What drove this shift? Digital pricing transparency made front gross negotiation more aggressive. Manufacturer direct-to-consumer initiatives (agency models, online sales) threatened dealer margins. And customers became more sophisticated about researching pricing before visiting dealerships.
F&I became essential (not optional) because it's the last department where customer experience and expert presentation drive profit more than pricing algorithms.
Service grew importance as dealerships realized lifetime customer value exceeds point-of-sale profit. A customer who buys one vehicle and services elsewhere generates $3,200 total gross. A customer who buys one vehicle and services with you for 5 years generates $8,000-$11,000 total gross.
The dealerships winning in 2026 optimize the full customer lifecycle, not just vehicle transactions.
Revenue Stream Health Metrics
Knowing whether your revenue mix is healthy requires benchmarking against industry standards by dealership size and franchise type.
Small dealerships (50-75 units/month): New vehicle gross should contribute 35-40% of total gross, used vehicles 25-30%, F&I 20-25%, service 15-20%. Total monthly gross profit typically runs $280K-$400K.
Mid-size dealerships (100-150 units/month): New vehicles 30-35%, used vehicles 25-30%, F&I 25-30%, service 25-30%. Total monthly gross profit runs $550K-$750K.
Large dealerships (200+ units/month): New vehicles 25-30%, used vehicles 25-30%, F&I 30-35%, service 30-35%. Total monthly gross profit exceeds $1.1M.
Red flags and warning signs include:
- New vehicle gross below 25% (over-dependence on volume, margin compression)
- F&I below 20% (poor penetration, weak menu, presentation issues)
- Service below 20% (retention problem, competition from independents)
- Service absorption below 75% (fixed cost coverage issue, operational inefficiency)
When you see these patterns, you know which departments need intervention.
Optimization priorities by stream: Start with F&I if you're below $1,600 PVR - this offers the fastest profit improvement with proper training and menu design. Next, address service retention if you're below 50% customer capture rate. Finally, optimize used vehicle operations if turn rate exceeds 50 days or gross profit falls below $2,800 per unit.
Don't try to fix everything simultaneously. Pick the biggest profit gap, implement systems, measure results, then move to the next opportunity.
Revenue streams aren't independent silos. They're interconnected profit centers that compound when you build the right systems and optimize the right sequence. That's how you scale from good to great.
