Automotive Sales Economics: 7 Profit Levers (2026)
Turn this article into takeaways for your work.
Each assistant summarizes the article only for you and suggests best practices for your work.
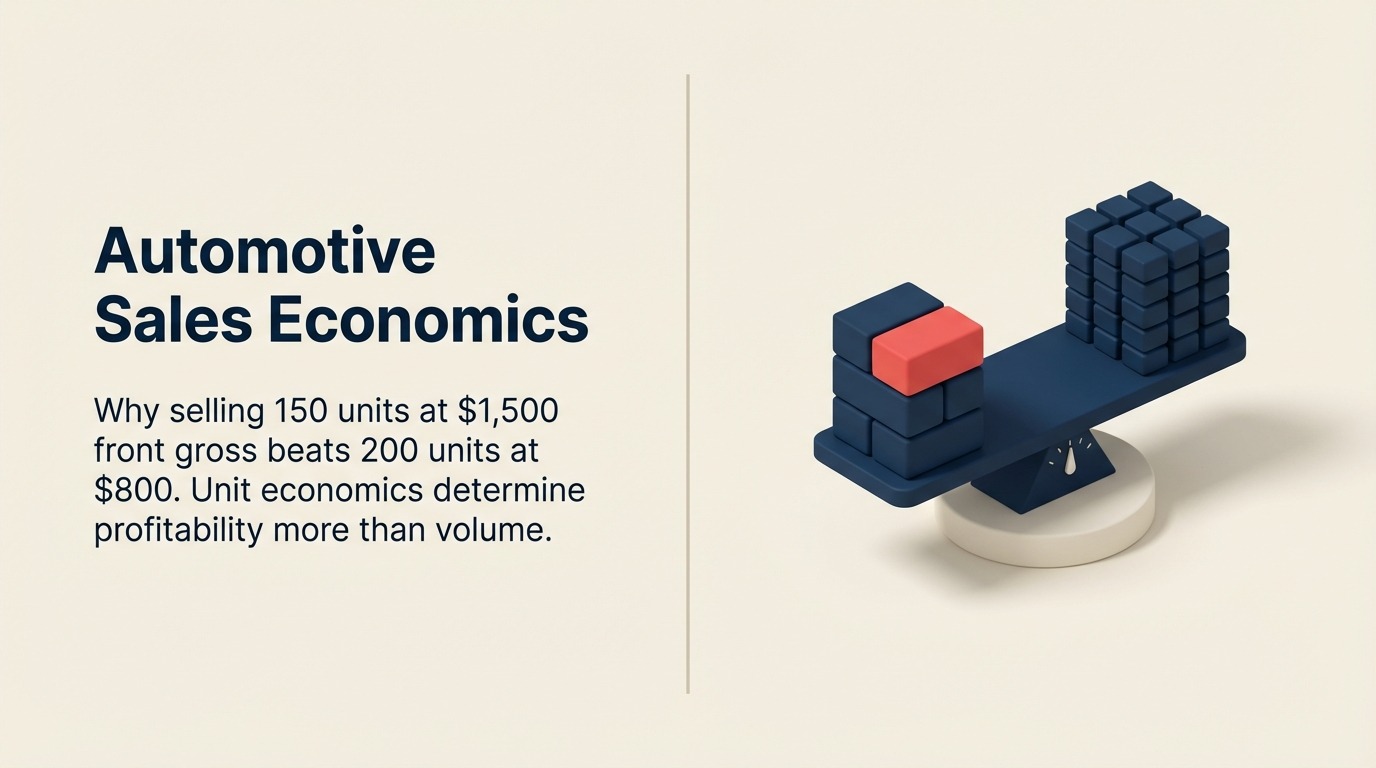
Volume solves everything, right? Sell more cars, make more money. That's what most sales managers believe until they see the actual numbers.
Here's what really happens: a dealership sells 200 vehicles per month at $800 average front gross and generates $160,000 in front-end gross profit. Another dealership sells 150 vehicles at $1,500 front gross and generates $225,000. Same market, different economics.
The second dealer made $65,000 more while selling 50 fewer vehicles. They spent less on advertising, paid fewer sales commissions, reduced floor plan interest, and needed less working capital. Volume without margin is just expensive activity.
Understanding unit economics - the actual profit and cost per vehicle sold - determines whether you scale profitably or burn cash chasing vanity metrics.
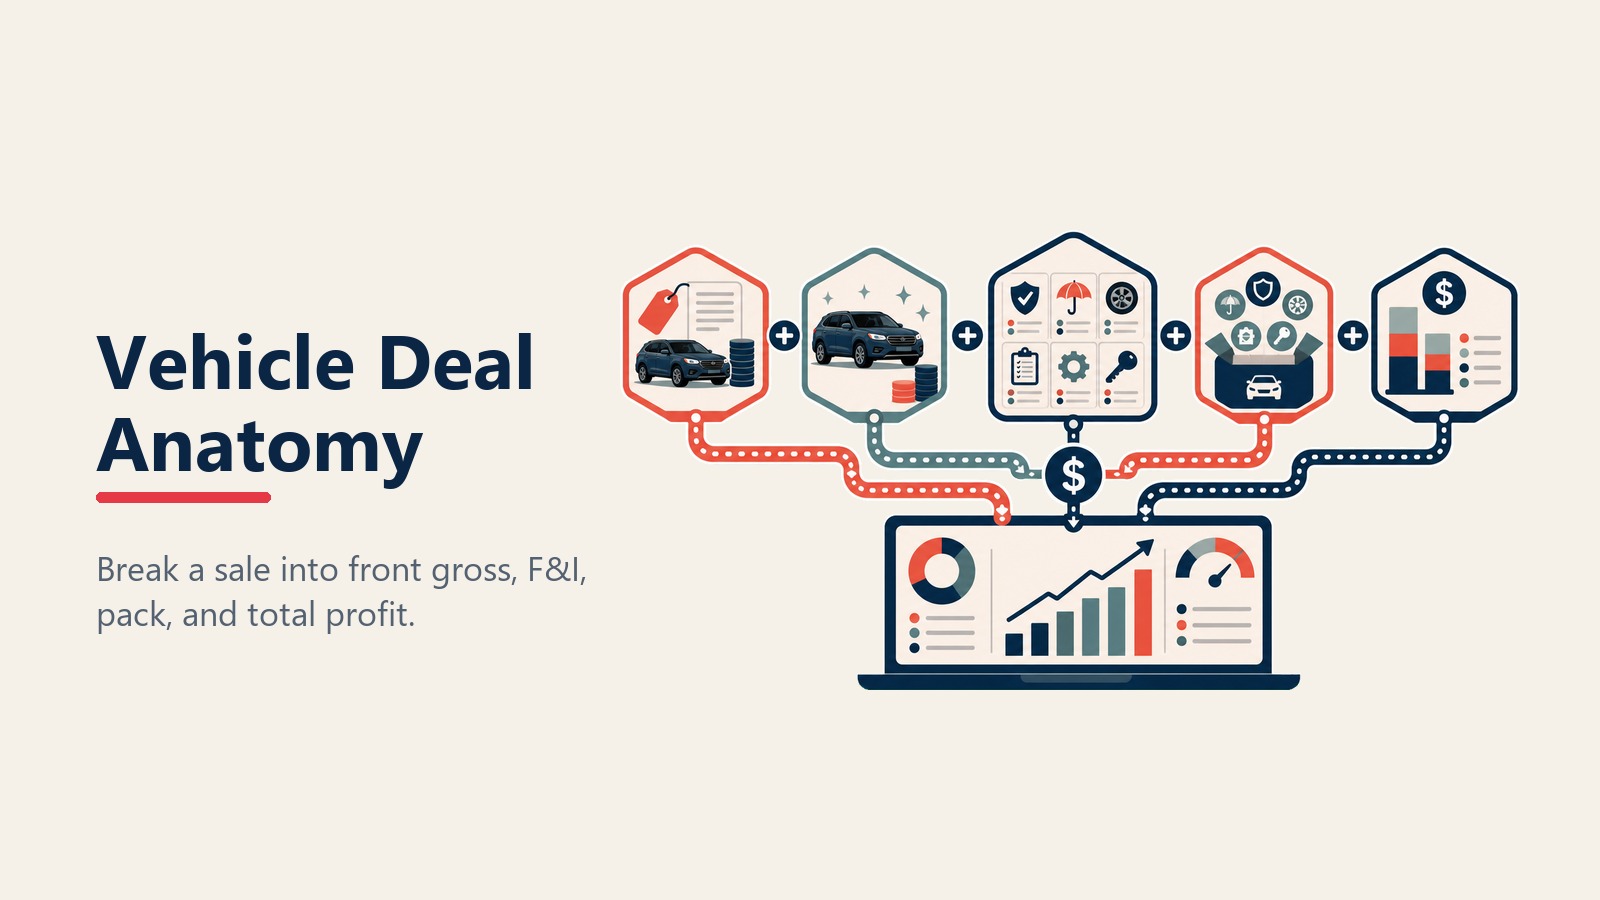
The Anatomy of a Vehicle Deal
Let's break down what actually happens financially when you sell a vehicle, because the sticker price tells you almost nothing about profit.
Front-end gross breakdown starts with the difference between your cost and the customer's price. On new vehicles, you're typically paying invoice (which is 7-12% below MSRP), then selling somewhere between invoice and MSRP depending on negotiation and market conditions.
A $35,000 MSRP vehicle might have $32,000 invoice pricing. You sell it for $34,200 after negotiation. That's $2,200 front gross before considering manufacturer incentives.
But add in $800 in dealer cash incentives, $600 in holdback, and you're at $3,600 total front-end gross. This is the number that matters, not the sticker-to-sales-price margin.
Used vehicles work differently. You acquire a trade-in for $18,000, invest $1,200 in reconditioning, and list it at $24,995. Customer negotiates to $23,800. Your gross is $23,800 minus $19,200 (acquisition plus recon), which equals $4,600.
Back-end (F&I) gross breakdown includes multiple revenue sources bundled in the finance office. Extended warranty generates $900 commission. GAP insurance adds $400. Prepaid maintenance contributes $350. Tire and wheel protection adds $250. Rate reserve (interest rate markup) brings in $450.
Total F&I gross on this deal: $2,350. Combined with front-end gross, you're looking at total gross profit of $5,800-$6,950 depending on new vs used vehicle.
Pack and dealership fees reduce the gross profit available for sales commission. Pack is a fixed amount ($500-$1,200) deducted from gross before calculating salesperson commission. It covers marketing costs, lot expenses, and contribution to overhead.
Some dealerships add doc fees ($300-$700 depending on state regulations) that customers pay but don't appear in gross profit calculation because they're designed to offset administrative costs.
Total gross per unit reality averages $3,200 on new vehicles (including all manufacturer programs and F&I) and $4,400 on used vehicles. But this is before sales costs, which is where most dealers lose track of actual profitability. NADA dealership financial profiles provide detailed benchmarks for comparing your unit economics against industry standards.
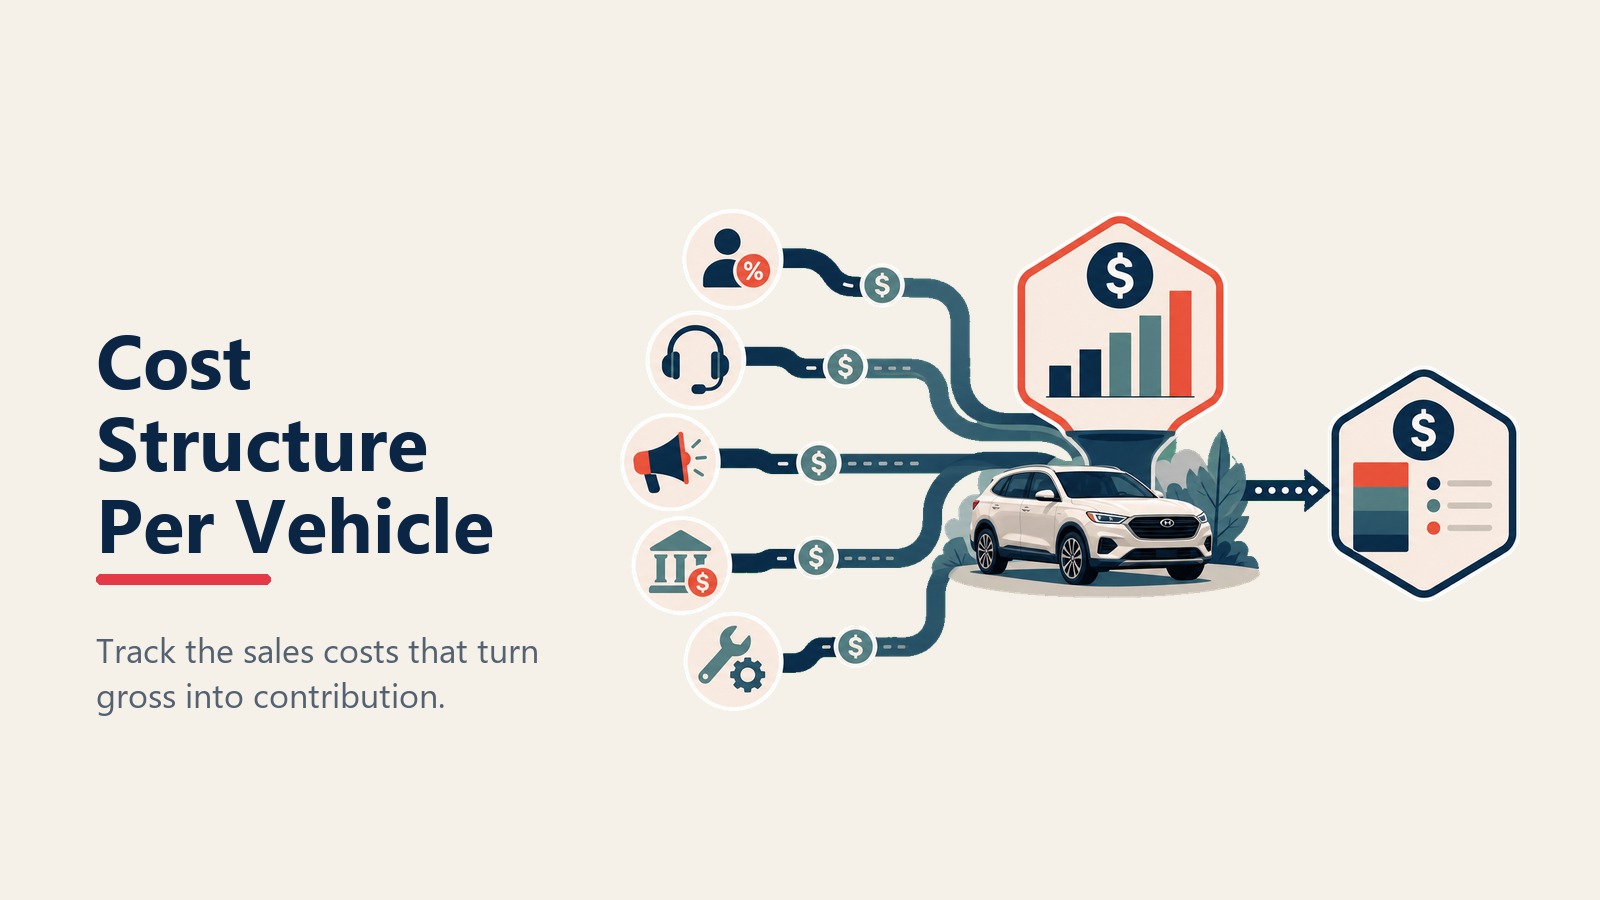
Cost Structure Per Vehicle
Gross profit is revenue. Net profit requires subtracting what you spent to generate that sale.
Sales commission typically runs 25% of front gross, though some dealers use tiered structures or unit-based minimums. On a $2,200 front gross deal, the salesperson earns $550. On a $4,600 used vehicle gross, commission is $1,150.
This is your largest per-vehicle sales cost, and it's directly variable with front gross performance.
Sales manager override adds another 3-5% of front gross ($66-$110 on a $2,200 deal) as compensation for sales managers who work deals, approve pricing, and oversee closing.
BDC and lead costs are harder to allocate per vehicle because you're spending on leads that don't convert. If you spend $8,000 monthly on BDC salaries and leads, and you close 100 sales from 350 leads, your effective cost per sale is $80. But if close rate drops to 20%, cost per sale jumps to $114.
This is why lead conversion rate matters as much as lead volume.
Advertising cost per sale requires tracking total marketing spend against sales generated. If you spend $40,000 monthly on digital marketing, TV, direct mail, and events, and you sell 150 vehicles, your ad cost per sale is $267.
Top-performing dealers reduce this through repeat and referral business (which costs almost nothing to generate) and efficient digital marketing that tracks conversion by source.
Floor plan interest runs $15-$25 per day per vehicle depending on interest rates and vehicle cost. New vehicles averaging 45 days on lot cost $675-$1,125 in floor plan interest. Used vehicles at 30 days cost $450-$750.
Fast turn rate isn't just about inventory management - it's about reducing per-unit interest expense.
Reconditioning costs on used vehicles include mechanical inspection, repairs, detail work, and cosmetic fixes. Average recon runs $800-$1,500 per vehicle, but older or higher-mileage units can hit $2,500-$4,000.
This is why acquisition price isn't the only cost metric. A $15,000 trade-in needing $3,000 in recon is less profitable than an $18,000 trade-in needing $800 in work.
Total acquisition cost per vehicle combines all these elements. For new vehicles: floor plan interest + advertising + sales commission + manager override + BDC allocation = $1,800-$2,400 per sale. For used vehicles, add reconditioning to reach $2,600-$3,400 total cost per sale.
When you subtract total acquisition cost from gross profit, you get contribution margin - the amount each sale contributes to covering dealership overhead and generating net profit.
Break-Even Analysis
Every dealership has a monthly sales volume where total revenue equals total costs. Below that number, you're losing money. Above it, you're profitable.
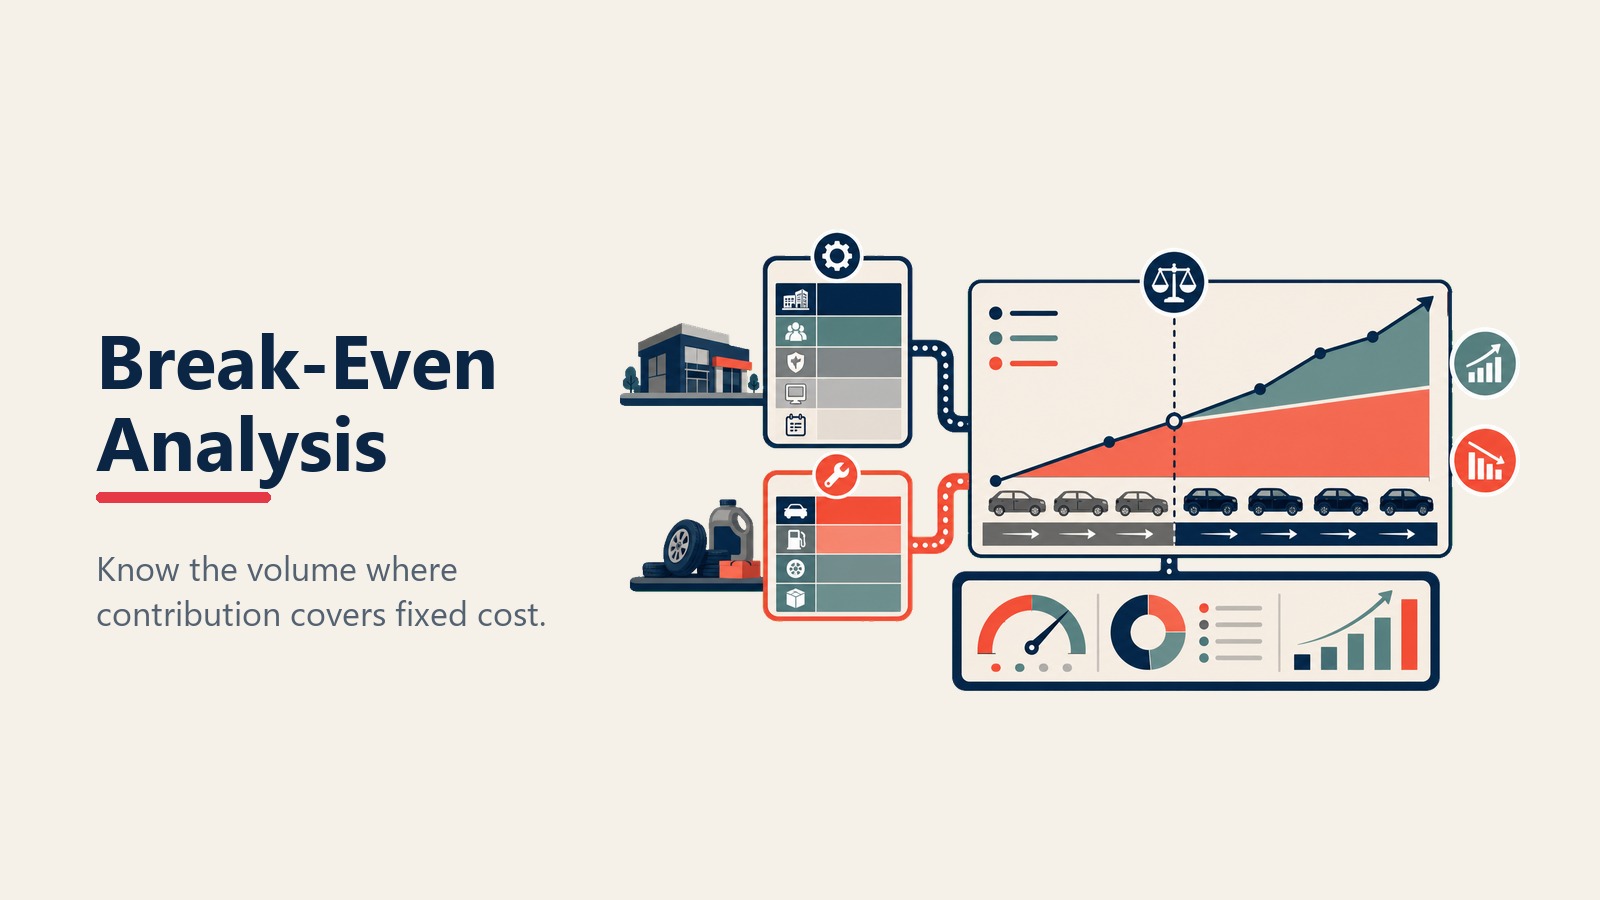
Fixed costs allocation per unit includes facility rent or mortgage, utilities, insurance, DMS subscriptions, administrative salaries, and management compensation. For a mid-size dealership, fixed costs might run $180,000-$250,000 monthly.
If you sell 100 vehicles per month, you're allocating $1,800-$2,500 in fixed costs per vehicle. Sell 150 units, and per-unit fixed cost drops to $1,200-$1,667. This is the leverage that makes growth profitable - fixed costs don't scale linearly with volume.
Variable costs per unit include everything that increases with each sale: sales commission, manager override, floor plan interest, reconditioning (used vehicles), and direct marketing costs. These average $1,800-$2,400 per vehicle on new sales, $2,600-$3,400 on used sales.
Break-even volume by franchise varies based on fixed cost structure and average gross profit. A domestic franchise averaging $2,800 total gross per vehicle with $200,000 monthly fixed costs needs to sell approximately 125 units to break even ($2,800 gross - $2,000 variable costs = $800 contribution margin per unit; $200,000 fixed costs ÷ $800 = 250 units... wait, that math doesn't work).
Let me recalculate: if total gross is $2,800 and variable costs are $2,000, contribution margin is $800 per vehicle. To cover $200,000 in fixed costs requires 250 units ($200,000 ÷ $800). But that seems high for break-even.
The reality is contribution margin should be higher because total gross includes F&I (which has minimal variable costs). Better calculation: $2,800 total gross, $1,200 variable costs on the vehicle sale itself, $1,600 contribution margin per unit. Break-even at 125 units per month ($200,000 ÷ $1,600).
Why volume isn't always the answer: pushing volume at reduced margin can actually hurt profitability. If you discount vehicles to hit 150 units but reduce average front gross by $600, you're generating $90,000 less gross profit while increasing variable costs by $15,000 (25 additional sales x $600 average variable cost).
You sold more vehicles and made less money.
Smart dealer principals focus on contribution margin per unit, not just unit sales volume. They'll take 120 sales at high margin over 150 sales at compressed margin every time.
Front Gross vs Back Gross Economics
The relationship between vehicle gross and F&I gross determines your total profitability per sale, and most dealers don't optimize both simultaneously.
Margin compression on new vehicles has been happening for 15 years. Internet pricing, manufacturer direct sales initiatives, and customer research tools all reduced negotiating leverage. New vehicle front gross dropped from $3,200 average in 2010 to $1,800-$2,200 in 2026.
You can't reverse this trend through better sales tactics. The market sets new vehicle pricing, and customers have the data to negotiate effectively.
Why F&I became essential (not optional) is simple math. If front gross drops $1,000 per unit and you're selling 100 units monthly, you lost $100,000 in monthly gross profit. The only way to recover that profit is through F&I penetration and PVR improvement. According to Cox Automotive insights, F&I departments have become critical profit centers as front-end margins continue facing pressure from digital pricing transparency.
A dealership averaging $1,200 F&I PVR in 2015 needed to hit $2,000 PVR by 2025 just to maintain total gross profit levels. The dealers who didn't make this transition are the ones struggling with profitability today.
Service contract penetration impact illustrates this perfectly. At 40% VSC penetration with $1,000 average commission, you're generating $400 per vehicle in VSC gross (40% of deals x $1,000 commission). Increase penetration to 70% and you're at $700 per vehicle - a $300 increase per sale.
Over 100 sales monthly, that's $30,000 in additional F&I gross profit. That's more than most dealers make in total front-end gross profit on new vehicles.
Total PVR targets by segment vary based on customer profile and finance rate. Luxury segments should hit $2,400-$2,800 PVR because customers have higher loan amounts, longer terms, and better credit (which allows more rate reserve). They also value comprehensive coverage.
Import segments target $1,800-$2,200 PVR. Domestic segments fall between at $1,900-$2,300. Subprime customers (due to regulatory constraints on rate markup) average $1,400-$1,800 PVR.
If your PVR falls below these benchmarks, you're leaving significant profit on the table. If you exceed them, you've built strong F&I presentation and menu design.
The True Cost of Holding Inventory
Every day a vehicle sits on your lot costs money, and most dealers underestimate this cost.
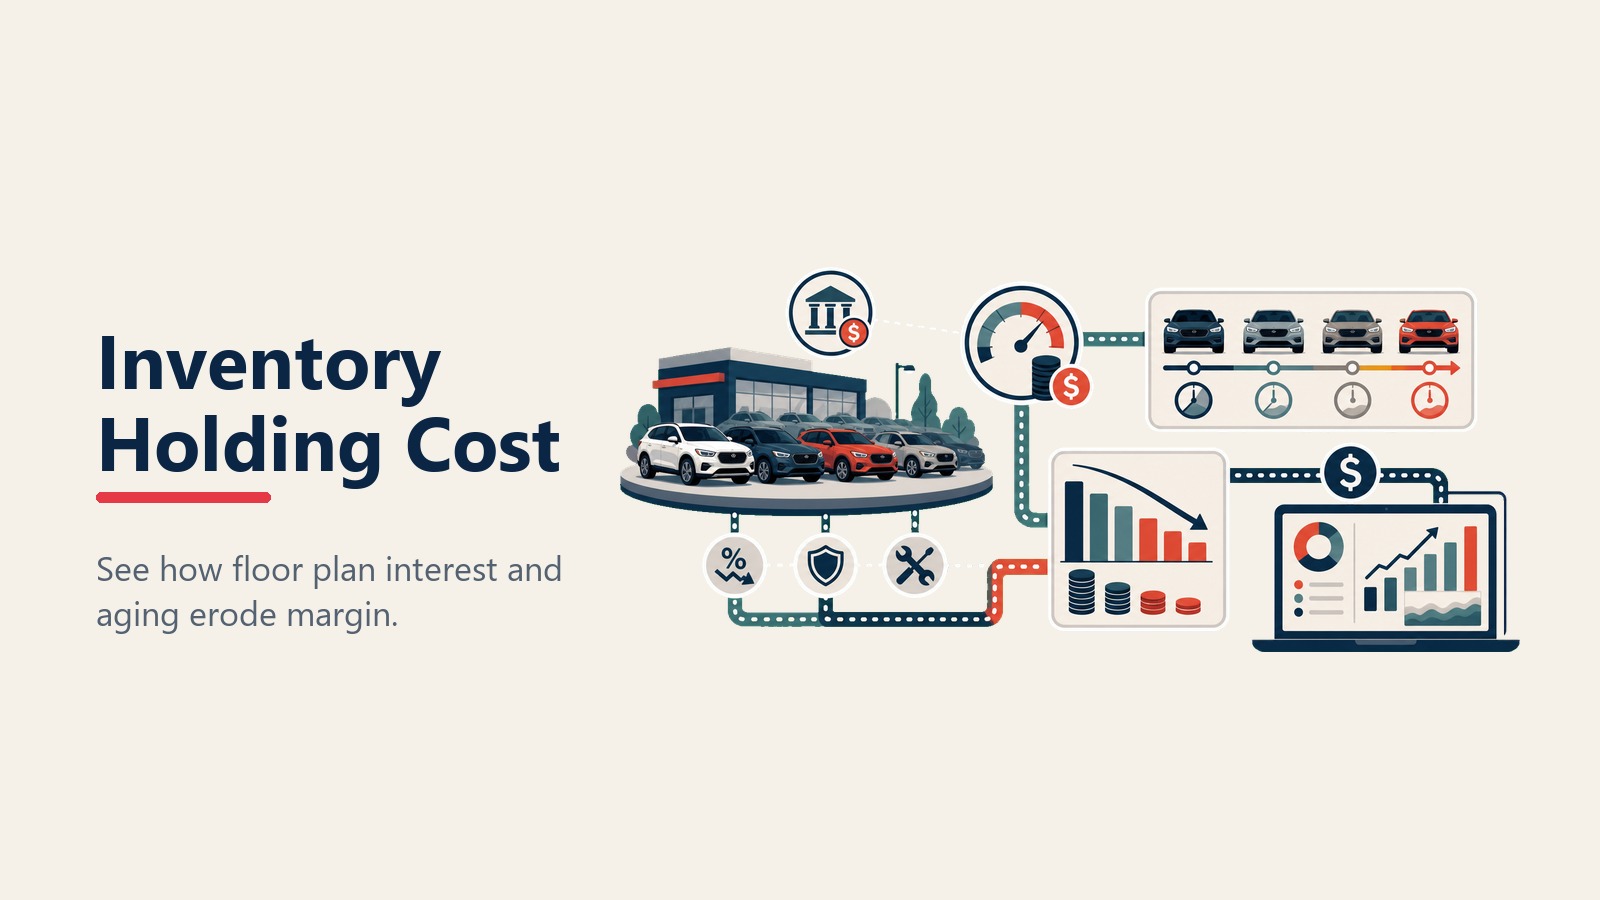
Floor plan interest rates currently run 7.5-10.5% annually depending on your lending relationship and inventory performance. On a $32,000 new vehicle at 9% annual floor plan rate, you're paying $7.88 per day in interest ($32,000 x 0.09 ÷ 365).
Thirty days of holding costs $236. Sixty days costs $473. Ninety days costs $709. This is pure cost with zero return.
Daily holding costs include more than just floor plan interest. Add in lot maintenance, insurance allocation, opportunity cost (capital tied up in slow-turning inventory instead of fast-turning units), and depreciation (on used vehicles).
Total holding cost averages $15-$25 per day depending on vehicle cost and dealership overhead structure.
Aging vehicle margin erosion happens because customers avoid older inventory and you're forced to discount. A used vehicle listed for 30 days at $24,995 might sell at $24,200 with minimal negotiation. The same vehicle sitting for 75 days requires aggressive pricing at $22,995 to generate interest.
You lost $1,200 in gross profit waiting for the "right buyer" instead of pricing for turn rate.
Optimal turn rate by vehicle type balances holding costs against gross profit opportunity. New vehicles should turn in 30-45 days on average. Slower turn rate indicates pricing issues, poor inventory selection, or weak marketing.
Used vehicles target 30-35 days for non-certified, 20-28 days for CPO. Luxury used vehicles can justify 45-60 day turn if gross profit supports holding costs.
Calculate your own optimal turn rate: (gross profit per vehicle - holding costs) ÷ days to sale = daily profit. Compare a $4,200 gross vehicle selling in 35 days ($120 daily profit) against a $5,400 gross vehicle selling in 75 days ($72 daily profit after deducting extra holding costs).
The faster-turning vehicle delivers better economics despite lower total gross profit.
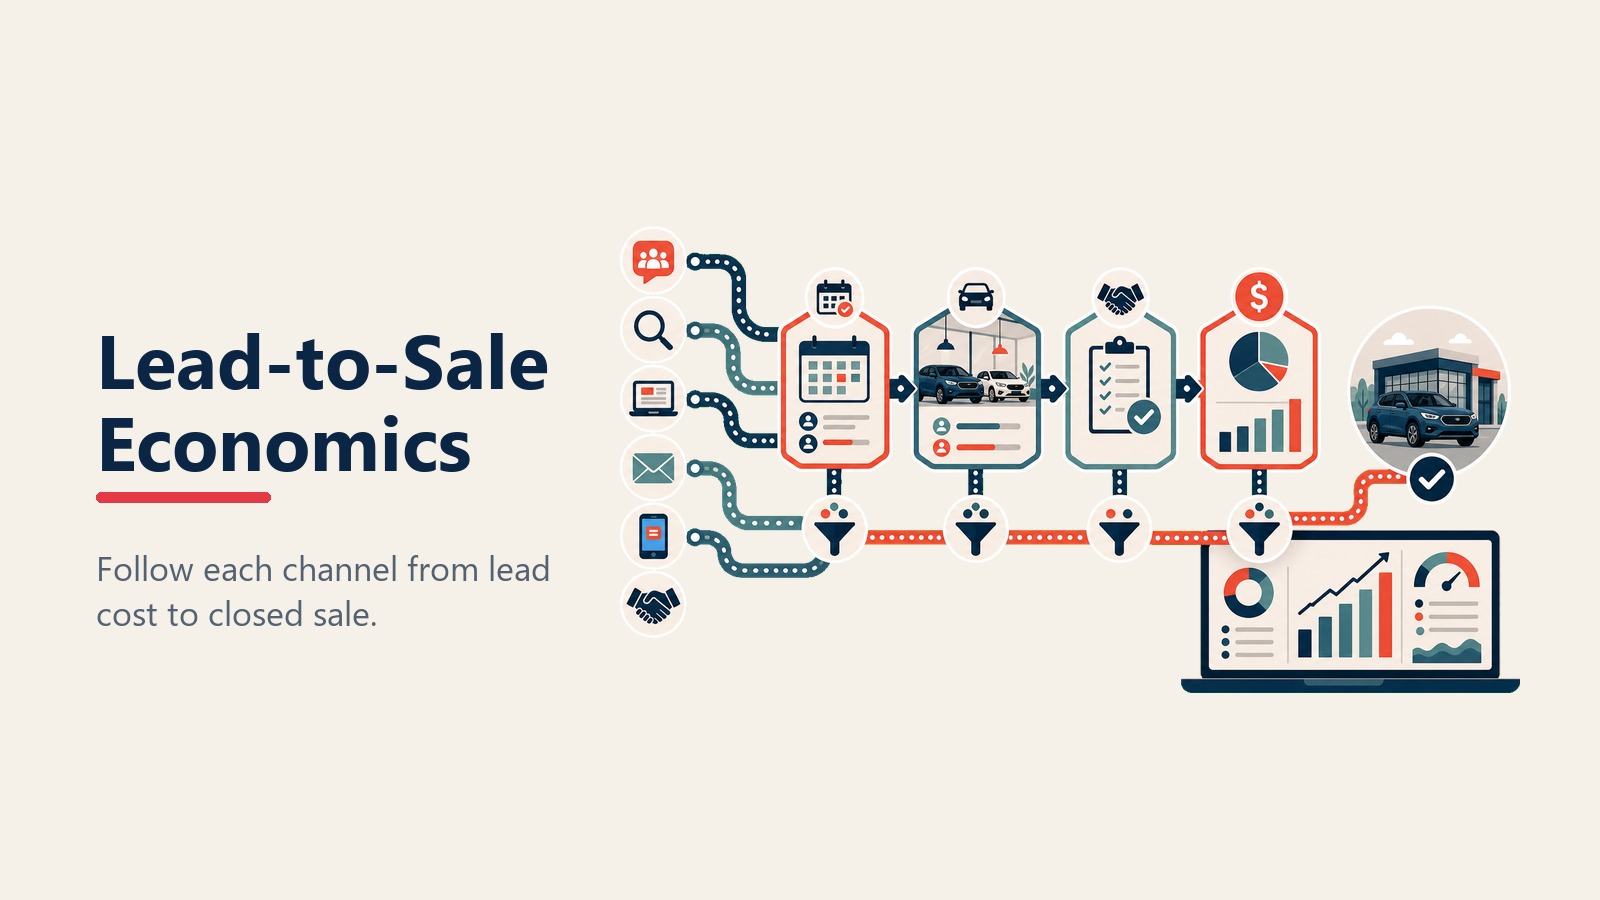
Lead-to-Sale Economics
Most dealers track cost per lead, but smart dealers track cost per sale by channel - which tells you where to invest.
Cost per lead by source varies dramatically. Organic website leads cost $8-$15 (just hosting and SEO maintenance). Paid search leads run $45-$85. Third-party leads (Autotrader, Cars.com, TrueCar) cost $85-$180 depending on market and volume.
Social media leads average $25-$60. Direct mail runs $120-$200 per lead.
But cost per lead means nothing without conversion data.
Lead-to-appointment conversion varies by source quality. Organic website leads convert to appointments at 30-40% because they're high-intent customers already researching your inventory. Third-party leads convert at 15-25% because they're shopping multiple dealers simultaneously.
Paid search converts at 20-30%. Social media is 12-20%. Direct mail is 8-15%.
Appointment show rate adds another filter. Appointments set from organic leads show at 65-75% rate. Third-party leads show at 45-55%. Paid search shows at 55-65%. Social media is 40-50%.
Close rate reality completes the picture. Customers who show for appointments close at 35-45% depending on sales process effectiveness. Walk-in traffic closes at 18-25%.
Total cost per sale by channel requires multiplying through the entire funnel:
Organic website: $15 cost per lead ÷ 35% appointment rate = $43 per appointment. $43 ÷ 70% show rate = $61 per show. $61 ÷ 40% close rate = $153 cost per sale.
Third-party leads: $150 cost per lead ÷ 20% appointment rate = $750 per appointment. $750 ÷ 50% show rate = $1,500 per show. $1,500 ÷ 40% close rate = $3,750 cost per sale.
Now you understand why smart dealers shift budget from third-party leads to website optimization, SEO, and organic traffic development. The economics are 20x better. Industry research confirms that organic leads consistently deliver superior ROI compared to paid third-party sources.
Profitability Levers & Trade-Offs
Understanding unit economics helps you make better decisions on the trade-offs every dealer faces.
Volume vs margin decisions come up monthly when you're deciding whether to discount vehicles to hit manufacturer targets. The math: selling 10 additional vehicles at $1,000 reduced gross generates $10,000 less gross profit. But if those 10 sales help you hit a volume bonus worth $50,000, you made the right call.
You're trading short-term margin for bonus income.
Marketing spend optimization requires tracking cost per sale by source and reallocating budget to highest-performing channels. If organic search delivers sales at $153 per sale and paid search delivers at $580 per sale, shifting $10,000 monthly from paid to SEO generates more sales at lower cost.
But this takes 6-12 months to show results, which is why most dealers keep buying expensive leads. They need sales this month, not optimization next year.
Sales compensation impact directly affects gross profit retention. Higher commission rates motivate sales but reduce dealer margin. Lower commission improves dealer margin but can hurt retention and performance.
Most dealers settle on 25% of front gross with tiered bonuses for hitting volume and margin targets. This balances motivation with profitability.
Inventory turn vs selection balance creates tension between having enough vehicles to attract customers and having too much capital tied up in aging inventory. Running 120 days of supply offers great selection but costs $1,800-$3,000 per vehicle in holding costs.
Running 45 days of supply reduces costs but risks losing sales to competitors with better inventory depth.
The optimal balance depends on your market, franchise, and customer expectations. Premium brands can run leaner inventory because customers special-order vehicles. Volume brands need depth because customers expect immediate availability.
Unit economics don't lie. When you track actual costs, real margins, and true profitability per vehicle, you make better decisions about volume targets, margin requirements, marketing spend, and inventory strategy. And you stop chasing vanity metrics that don't translate to profit.
