Turn this article into takeaways for your work.
Each assistant summarizes the article only for you and suggests best practices for your work.
Not all leads are created equal. A customer researching payment options on multiple VDPs converts at 8x the rate of someone who submitted a single generic inquiry. Lead scoring separates signal from noise.
Your BDC receives 300 internet leads this month. Sales capacity is 180 appointments. Which 180 leads do you prioritize? Without lead scoring, you're guessing. Maybe you work them in order received. Maybe by source. Maybe whoever shouts loudest gets attention.
Meanwhile, that customer who visited your site three times this week, used the payment calculator twice, looked at five vehicles in your inventory, and lives 12 miles away? They're sitting in your CRM with the same priority as someone who fat-fingered a form submission at 2am and never returned.
Lead scoring fixes this. It assigns point values based on behaviors, demographics, and engagement signals that correlate with purchase intent. Hot leads get immediate attention from your best agents. Warm leads follow standard processes. Cold leads go into long-term nurture.
The result: 25-40% higher conversion rates using the same team, same leads, same effort, just better prioritization.
Lead Scoring Fundamentals
Lead scoring is a methodology for ranking prospects based on their likelihood to buy. It's not about whether someone is a good person or a serious shopper in general. It's about whether they're ready to buy from you, right now.
Hot, warm, cold classification systems provide simple categorization. Hot leads score above 70 points, and they need immediate response and top-tier agent attention. Warm leads score 40-70, and they follow standard BDC processes with appropriate follow-up. Cold leads score below 40, and they enter long-term nurture campaigns with minimal human touch until they demonstrate more engagement.
Point-based vs rule-based models represent different scoring philosophies. Point-based systems assign numerical values to every behavior and characteristic, then add them up. "VDP view = 5 points, payment calculator = 15 points, lives within 25 miles = 10 points." Rule-based systems use if/then logic: "If customer completed trade-in tool AND viewed vehicle 3+ times, then HOT." Most effective implementations combine both approaches.
Predictive scoring with AI/ML analyzes thousands of closed deals to identify patterns invisible to humans. Machine learning models might discover that customers who visit your site on Sunday evenings between 7-9pm convert at 3x average rates. Or that people who view exactly two vehicles perform better than those who view five. These insights feed back into scoring algorithms automatically.
When to score and re-score leads matters more than most dealers realize. Initial scoring happens at lead creation based on source, form completion, and initial behavior. Re-scoring should occur whenever significant engagement happens: email opens, website returns, phone call answers, text replies. Leads should be re-scored at least daily, and ideally in real-time as behaviors occur.
Industry benchmarks for score thresholds vary by market, but Cox Automotive research suggests that only 6.2% of leads result in sales on average, with quality leads from premium sources converting at 10.9% while lower-quality leads convert at just 4%. Leads scoring in the top 20% convert at 4-6x the rate of bottom 20% leads. If your overall conversion rate is 12%, your top-scored leads might convert at 35-45% while bottom-scored leads convert at 3-5%. This spread justifies dramatically different treatment.
Behavioral Scoring Factors
What customers do on your website predicts purchase intent better than what they say.
Website engagement depth separates browsers from buyers. Someone who visits one page for 30 seconds scores low. Someone who spends 15 minutes across eight pages scores high. Page view counts, time on site, and return visits all indicate increasing interest. A customer who returns to your site three times in two days is showing you they're shopping seriously.
VDP interactions and vehicle views are your strongest behavioral signals. Viewing a single Vehicle Detail Page is worth 5 points. Viewing three VDPs in one session? 15 points. Returning to the same VDP multiple times? 20 points. This customer isn't browsing, they're shopping. And if they're comparing specific vehicles on your lot, they're close to decision time.
Payment calculator usage is an even stronger signal. Customers don't calculate payments for fun. They're trying to determine affordability, which means they're mentally moving from "should I buy?" to "can I afford this one?" Every payment calculator interaction should add 15-20 points to lead score. If they use it multiple times with different down payments or terms, they're doing real shopping math.
Trade-in tool completion is gold. Customers who enter their VIN, answer condition questions, and view their trade estimate are showing you they have a vehicle to trade and want to understand its value in a transaction. This is purchase-ready behavior. Trade tool completion should add 25-30 points. It's one of the highest-intent actions a customer can take.
Form field completeness tells you how serious someone is. A form with just name and email? Low intent, possibly fake. A form with name, email, phone, address, preferred contact method, trade-in info, and preferred vehicle? High intent. Complete forms score 20+ points higher than minimal forms because customers willing to provide detailed information are serious shoppers.
Return visit patterns and frequency reveal shopping timeline. Someone who visits once then disappears for two weeks is early-stage. Someone who visits daily for five consecutive days is late-stage. Score leads higher for visit frequency and recency. Three visits in one week scores higher than three visits in one month.
Demographic & Firmographic Data
Who the customer is provides context for their behaviors.
Geographic proximity to dealership is the single strongest demographic predictor. McKinsey research confirms that customers now make fewer dealership visits due to extensive online research, making proximity even more critical for conversion. Someone 10 miles away is 3x more likely to convert than someone 50 miles away. Distance scoring should be aggressive: 0-10 miles = 20 points, 10-25 miles = 10 points, 25-50 miles = 5 points, 50+ miles = 0 points. Don't waste top agents on customers who won't drive to your dealership.
Credit score indicators help you qualify or disqualify leads early. If your CRM integrates with credit bureaus or third-party providers, you might have credit tier estimates. Prime and super-prime customers (700+ scores) score higher because they're easier to finance and more likely to complete deals. Subprime customers (below 600) need different handling. They're not bad leads, but they require finance specialists and different inventory.
Income and affordability signals come from append data, geographic codes, or stated information. A customer looking at $80,000 vehicles while living in a ZIP code with median household income of $45,000 is probably dreaming. A customer looking at $35,000 vehicles with income indicators suggesting $120,000+ is likely qualified. Score alignment between vehicle price and affordability indicators.
Previous purchase history is your strongest data point when available. Customers who bought from you before convert at 4-5x the rate of conquest customers. Service customers convert at 2-3x conquest rates. If your CRM integrates with your DMS, tag and score these customers immediately. Repeat customers should start at 40-50 points before any behaviors.
Service customer status provides similar value. Someone who services their current vehicle at your dealership every 5,000 miles is demonstrating loyalty and proximity. When they start shopping for their next vehicle, they're highly qualified leads. Service customers looking at inventory should be flagged as high-priority opportunities.
Age and lifecycle stage affect purchase timing. First-time buyers (18-24) convert slowly but have lifetime value. Prime buyers (30-55) convert fastest and represent highest immediate opportunity. Retirees (65+) convert slowly but are often cash buyers. Score based on your dealership's strengths—if you excel with first-time buyers, weight that demographic higher.
Engagement Signals
How customers respond to your outreach predicts their interest level.
Email open and click rates are basic but useful. A customer who opens every email you send and clicks links in 80% of them is engaged. A customer who never opens emails is either uninterested or your emails are going to spam. Email engagement should add 5-10 points per open, 10-15 points per click. Multiple clicks in one email (comparing multiple vehicles) should score even higher.
SMS reply patterns are stronger signals because texting feels more personal. If you text a customer and they reply within 10 minutes, add 15 points. If they reply with questions or requests for information, add 25 points. Customers who engage in multi-message text conversations are showing high intent and comfort with your team.
Phone call answer rates are the strongest signal. A customer who answers when you call is ready to talk. Add 20-25 points for answered calls. Customers who call you back after voicemails score even higher—30+ points—because they're taking initiative. Customers who never answer after five attempts should lose points; they're either not interested or the phone number is wrong.
Appointment scheduling behavior speaks for itself. A customer who books an appointment scores 50+ points immediately. A customer who books, then cancels and reschedules, maintains high score because they're still engaging. A customer who no-shows drops to cold lead status until they re-engage.
Response time to outreach correlates with urgency. If you email at 10am and customer replies by 10:30am, they're actively shopping. If they reply three days later, they're casual. Score based on response speed: under 1 hour = 20 points, 1-4 hours = 10 points, 4-24 hours = 5 points, 24+ hours = 0 points.
Social media interactions are harder to track but valuable when available. Customers who follow your dealership pages, like posts, or comment are showing engagement. If your social media integrates with CRM (Facebook Lead Ads, for example), social engagement should add 5-10 points.
Lead Source Quality Weighting
Not all lead sources convert equally. Score accordingly.
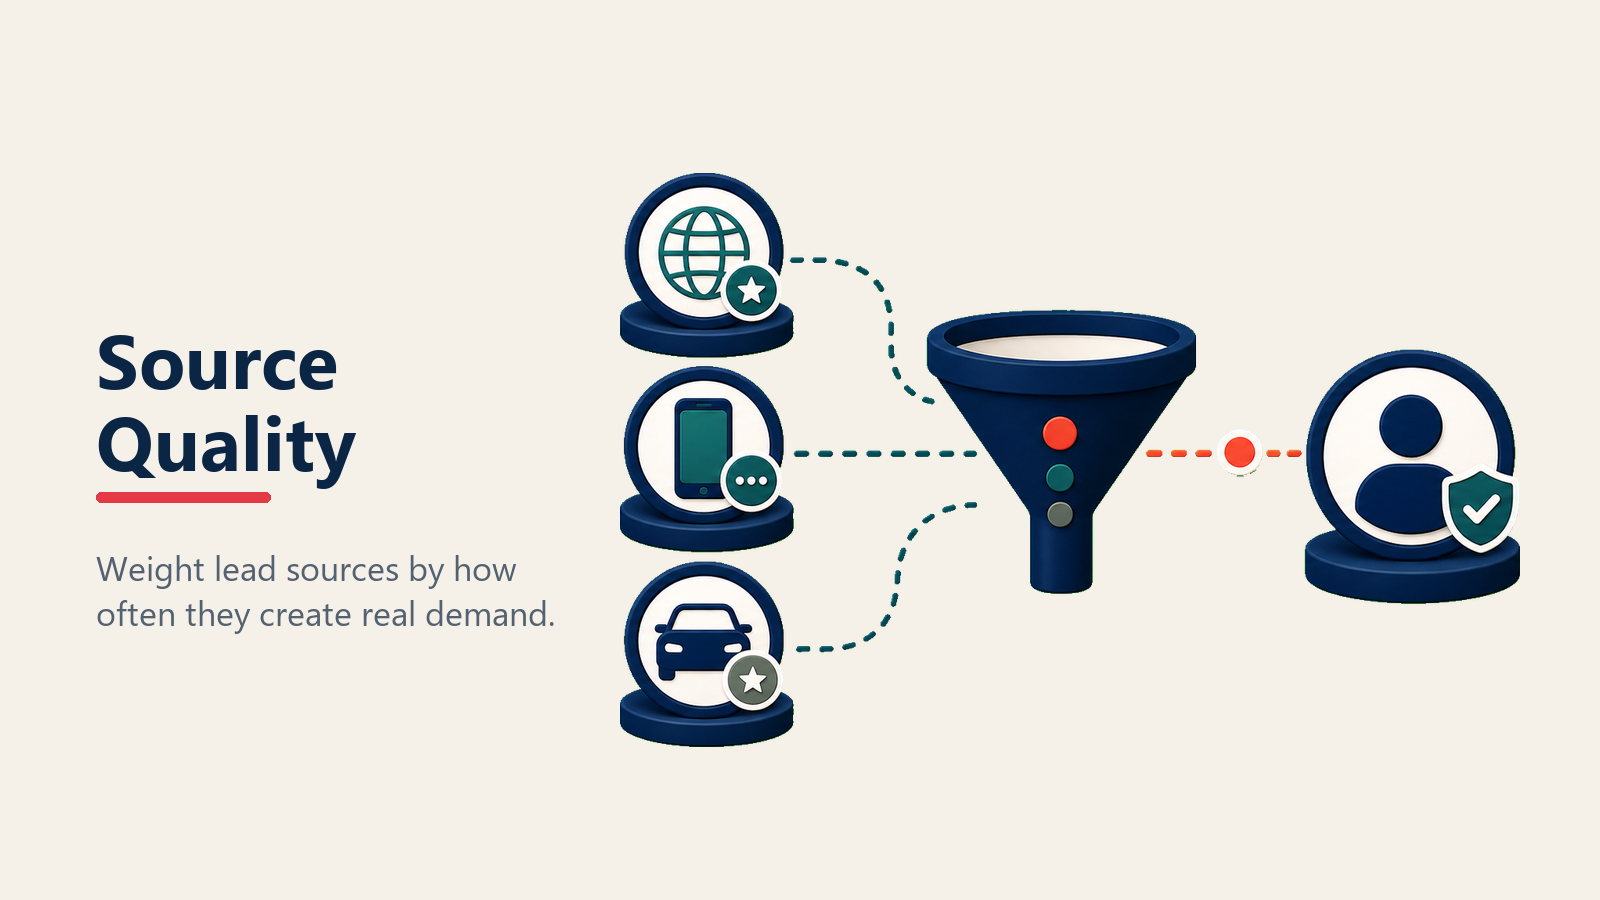
Third-party provider performance varies wildly. Some dealers swear by Autotrader leads while others find them worthless. Industry data shows that Autotrader leads convert at 10.9% while TrueCar leads average 4%, demonstrating significant variation by source. Pull your own conversion data by source for the last 90 days. If Autotrader converts at 18% and Cars.com converts at 6%, Autotrader leads should start with 15-20 more points. Source quality weighting ensures high-performing sources get priority attention.
Organic vs paid traffic tells different stories. Organic traffic (direct website visits, SEO) typically converts 2-3x higher than paid traffic because customers are specifically looking for you. Paid traffic (Google Ads, display ads) casts wider nets but captures more tire-kickers. Organic leads should score 10-15 points higher than paid leads.
OEM vs independent sources also show different performance. Factory website leads (Ford.com, Toyota.com) often convert well because customers are already brand-decided. Independent aggregators (TrueCar, Edmunds) attract price shoppers who compare multiple dealers. OEM leads score higher unless your data proves otherwise.
Chat vs form submissions show interesting patterns. Chat leads convert faster because they represent immediate intent—the customer is on your site right now. But form submissions sometimes convert at higher rates overall because customers put more thought into form completions. Test your data, but generally chat leads should score 10-20 points higher for urgency even if overall conversion is similar.
Phone-up quality indicators depend on what questions customers ask. Customers calling about specific vehicles convert at 25-35%. Customers calling about "what SUVs do you have?" convert at 12-18%. Customers calling about hours or directions convert at 3-5%. If your phone system categorizes call types (or BDC agents tag them), score accordingly.
Referral and repeat customer scoring should be aggressive. Referred customers convert at 35-50% rates. They start with trust and social proof. Repeat customers convert at 40-60% rates because they know you. Both should start at 50+ points before any behaviors—they're automatically hot leads.
Equity Position & Purchase Timeline
Financial position and timing drive purchase urgency.
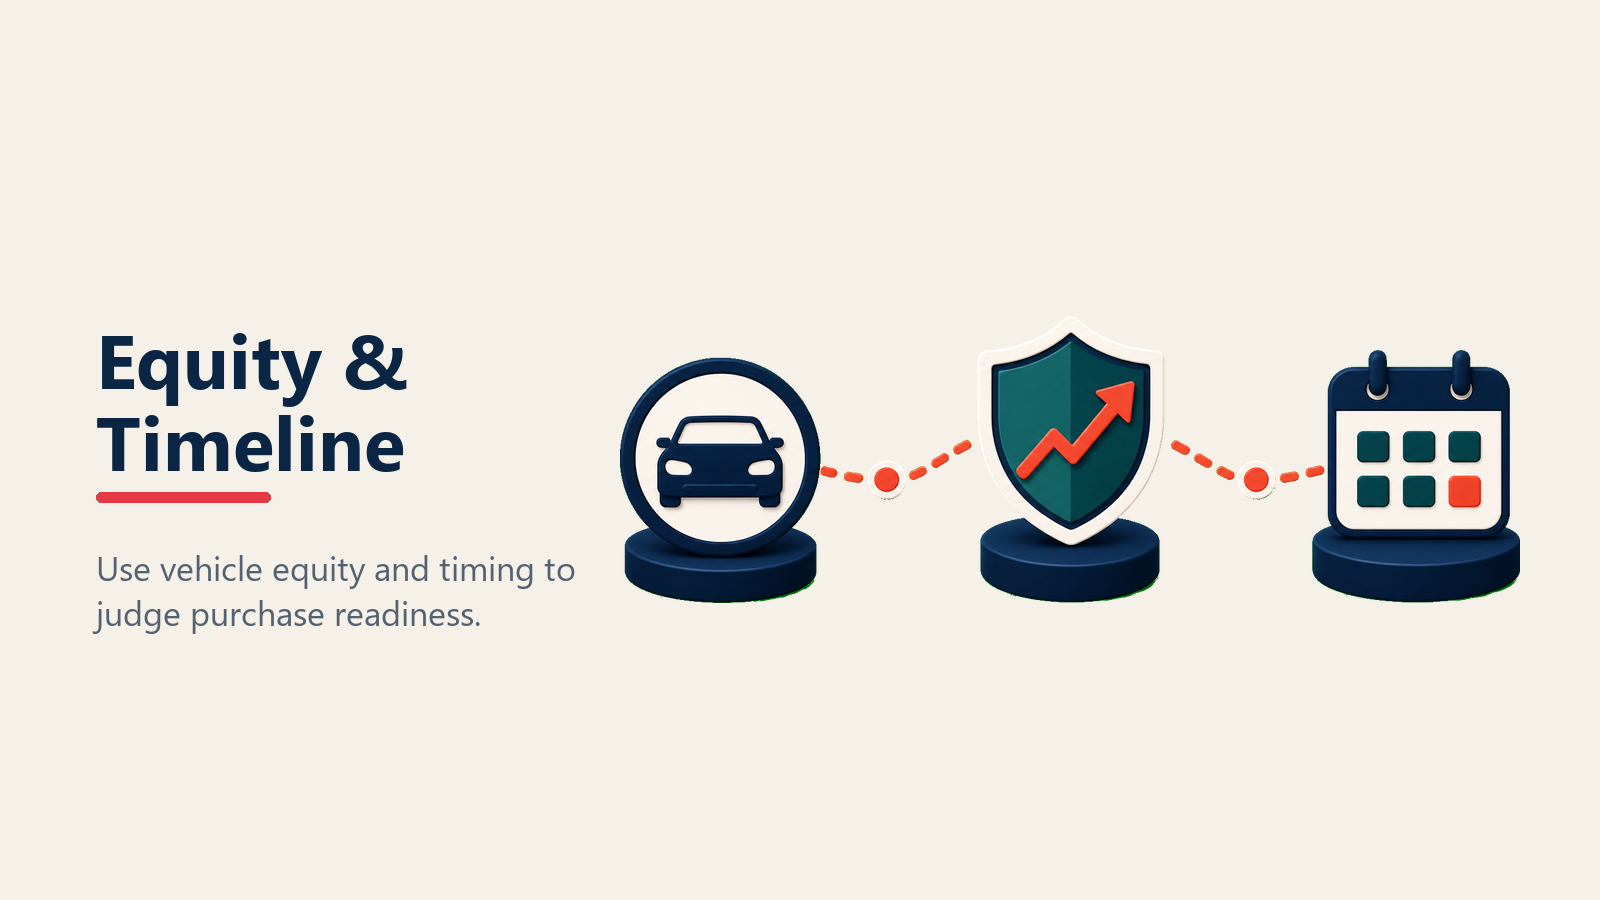
Positive equity as high-intent signal is one of your strongest predictors. A customer with a vehicle worth $28,000 and only $19,000 remaining on their loan has $9,000 equity—they can trade easily and use that equity as down payment. Positive equity customers should score 25-30 points higher than negative equity customers because they have fewer barriers to purchase.
Negative equity management strategies require different scoring. A customer owing $32,000 on a vehicle worth $26,000 has $6,000 negative equity. They can still buy, but need higher credit scores or larger down payments to absorb the negative. These leads aren't bad—they just need specialized handling. Score them lower for immediate conversion but flag them for finance department involvement.
Lease maturity and pull-ahead opportunities create urgency. A customer with a lease ending in 60 days needs to make a decision. Manufacturers often offer pull-ahead programs letting customers exit leases 90-180 days early. If your CRM captures lease maturity dates, score leads with leases ending in under 90 days extremely high—40+ points. These customers have deadline-driven urgency.
Stated purchase timeline weighting seems obvious but dealers often ignore it. When customers say "looking to buy in next 30 days," believe them. Next 30 days = 30 points. 30-60 days = 20 points. 60-90 days = 10 points. 90+ days = 0 points. Customers who say "just looking" or "no timeline" go into long-term nurture.
In-market urgency indicators beyond stated timeline include seasonal factors, life events, and competitive shopping. A customer shopping multiple dealerships in one weekend is urgent. A customer who mentions their current vehicle just broke down is urgent. A customer asking about end-of-month pricing is urgent. Train BDC agents to tag urgency signals so they feed into scoring.
Seasonal and end-of-month timing affects scoring too. Leads arriving the last week of the month score higher because customers know it's negotiation time and dealers are motivated. Leads arriving during year-end clearance score higher because customers expect deals. Memorial Day weekend leads score higher than random Tuesday leads because customers are actively shopping during sale events.
Implementation & Automation
Theory is useless without execution.
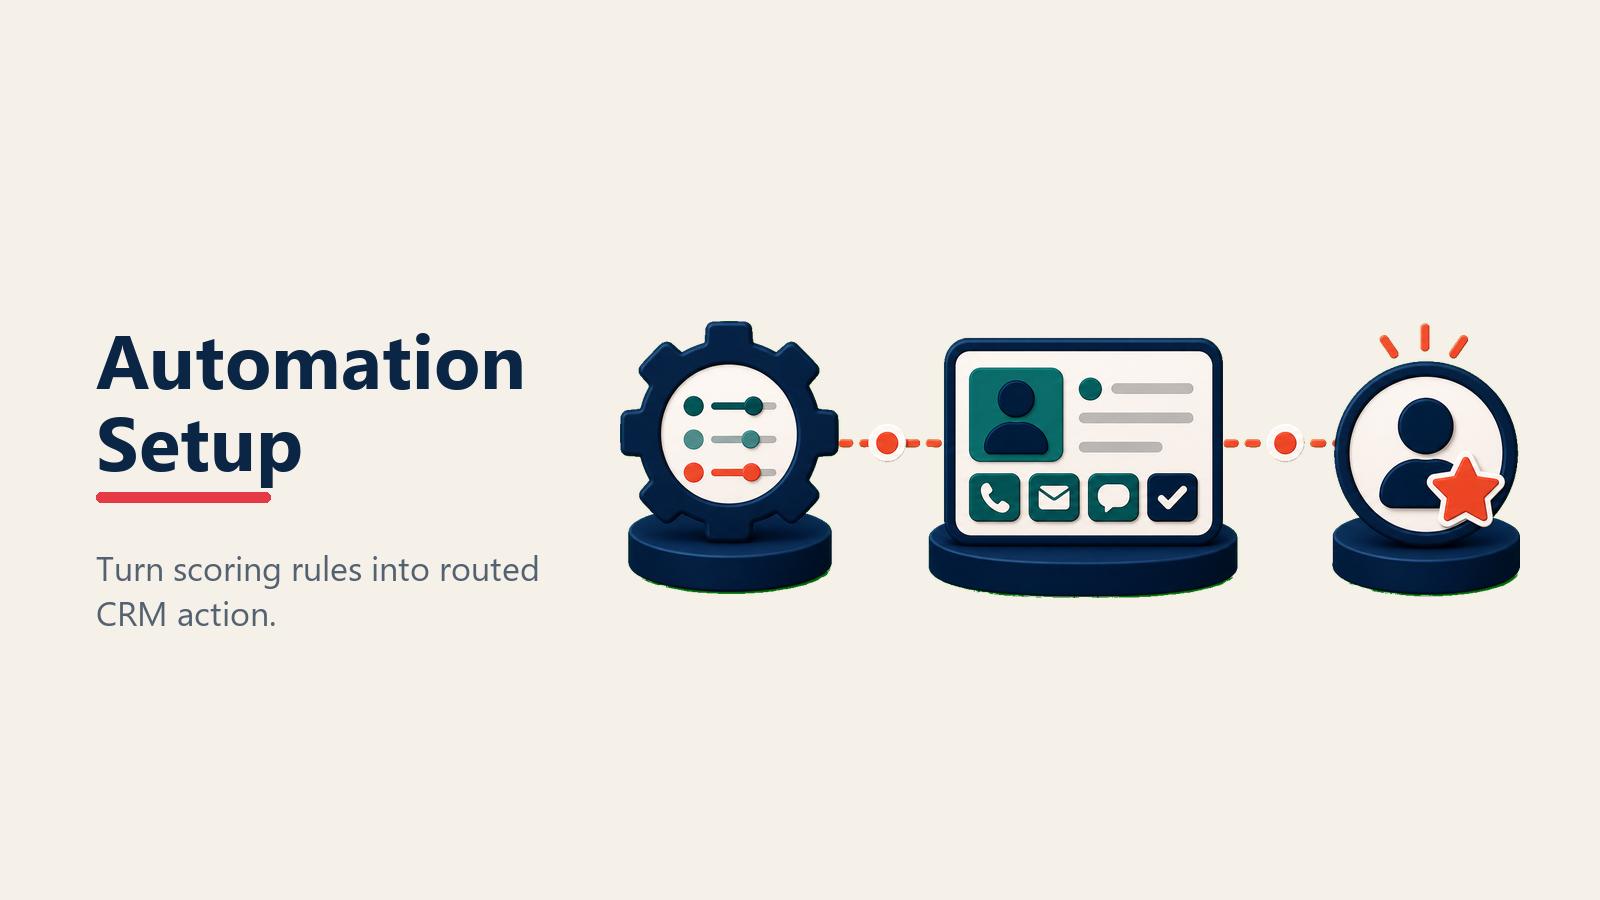
CRM scoring configuration starts with your CRM's native scoring capabilities. VinSolutions, DealerSocket, Eleads, and most major automotive CRMs have built-in scoring modules. Start with default rules, then customize based on your data. If your CRM doesn't have scoring, export lead data to Excel, build your scoring model there, then import scores back into custom fields.
Real-time score calculations matter for hot lead identification. Scores should update immediately when customers take actions—not in overnight batch processes. If a customer uses your payment calculator at 2pm, their score should jump from 35 to 60 instantly, triggering alerts to your BDC team. Most modern CRMs support real-time scoring through workflow automation.
Score-based routing and assignment ensure hot leads reach top agents. Set routing rules: leads scoring 70+ go to your three best BDC agents. Leads 40-70 follow round-robin to all agents. Leads under 40 go into automated nurture with light human touch. This maximizes your top talent's time on highest-probability opportunities.
Alert thresholds for hot leads should trigger multiple notifications. When a lead hits 70+ score, your system should text your top three agents, send push notifications, and display prominent alerts in the CRM. Hot leads need immediate response—scoring doesn't help if nobody notices the score.
Score decay over time reflects reality: leads get colder. A lead that scored 65 points when they submitted an inquiry but hasn't engaged in 10 days should drop to 40 points. A lead that scored 75 points but hasn't answered three calls or replied to five emails should drop to 30 points. Implement decay rules that reduce scores by 3-5 points per day of non-engagement.
Manual override capabilities preserve human judgment. If a BDC agent talks to a customer who sounds extremely motivated but their behavior score is only 45, agents should be able to manually boost that lead to hot status with a note explaining why. Data drives scoring, but humans know things data doesn't.
Performance tracking and optimization close the loop. Monthly, pull reports comparing lead scores to actual outcomes. Do leads scoring 70+ actually convert at predicted rates? If not, your scoring model needs calibration. Maybe you're over-weighting payment calculator usage or under-weighting service customer status. Treat lead scoring as a living system that improves through data feedback.
Scoring Model Example
Here's a practical scoring model you can implement today:
Behavioral Factors:
- First VDP view: +5 points
- Each additional VDP view: +5 points
- Payment calculator use: +20 points
- Trade-in tool completion: +30 points
- 3+ website visits in 7 days: +15 points
- Email open: +5 points
- Email click: +10 points
- Phone call answered: +25 points
- Text message reply: +20 points
- Chat engagement: +15 points
Demographic Factors:
- 0-10 miles away: +20 points
- 10-25 miles away: +10 points
- Service customer: +25 points
- Previous buyer: +40 points
- Referred by existing customer: +30 points
Source Factors:
- Organic website: +15 points
- Factory website: +15 points
- Paid search: +10 points
- Third-party (varies by source): +5 to +15 points
- Chat: +10 points
Financial Factors:
- Positive equity: +25 points
- Lease ending <90 days: +30 points
- Purchase timeline <30 days: +30 points
Thresholds:
- 70+ points = Hot lead (immediate response, top agent)
- 40-69 points = Warm lead (standard process)
- <40 points = Cold lead (automated nurture)
A customer who visits your site twice, views three vehicles, completes the trade-in tool, lives 8 miles away, and is a service customer would score: 5 + 10 + 30 + 20 + 25 = 90 points. That's a hot lead requiring immediate top-agent attention.
Results and Reality
Dealerships that implement lead scoring report 25-40% improvement in conversion rates with the same lead volume, because they're focusing human effort on the highest-probability opportunities.
But lead scoring isn't magic. It's a tool that helps you allocate scarce resources (agent time, top talent, immediate response) to the leads most likely to convert. It doesn't fix bad follow-up, poor phone skills, or terrible inventory. It just ensures your best people spend time on your best leads.
Start simple. Implement basic scoring based on lead source, proximity, and behavior. Get your team comfortable with hot/warm/cold classifications. Then layer in more sophisticated signals as you gather data.
The goal isn't perfect scoring—it's better prioritization. And better prioritization means more sales from the same leads.
