Turn this article into takeaways for your work.
Each assistant summarizes the article only for you and suggests best practices for your work.
Vehicle Detail Pages receive 75% of your dealership's website traffic. VDPs are where buying decisions happen—where shoppers compare your inventory against competitors, calculate payments, and decide whether to contact you or move on. And yet most VDPs convert at a dismal 1.5-3% from visit to lead. J.D. Power research shows that if a website meets expectations for foundational elements such as speed and design, overall satisfaction is 752 on a 1,000-point scale, but drops to 664 when these expectations aren't met.
That's a massive leak in your sales funnel. If you're driving 10,000 VDP visits per month and converting at 2%, you're generating 200 leads. Improve that conversion to 4%, and you've doubled your lead volume without spending another dollar on advertising.
VDP optimization isn't about flashy design or creative layouts. It's about removing friction, building trust, answering questions, and making it easy for interested buyers to take the next step. The dealers winning online understand that every element on a VDP either helps conversion or hurts it. Strong dealership website optimization provides the foundation. There's no neutral ground.
VDP Performance Benchmarks
Before you start optimizing, you need to know what "good" looks like. Here are current industry benchmarks for VDP performance:
Visit-to-lead conversion: 1.5-3% is average for most dealers. Top performers hit 4-6%. If you're below 1.5%, you've got serious problems with pricing, photos, or trust signals.
Time on page: 2-4 minutes is typical. Less than 90 seconds suggests poor engagement—visitors aren't finding what they need. More than 5 minutes often indicates confusion or friction in the conversion process.
Mobile vs desktop conversion: Mobile should be within 20% of desktop rates. If mobile converts at half the rate of desktop, your mobile VDP experience needs work.
Photo quantity impact: VDPs with 30-40 photos convert 40% better than those with fewer than 15 photos. More visual information builds confidence and reduces uncertainty.
Video impact: VDPs with video walkarounds generate 4x more inquiries than photo-only pages. Video creates engagement and allows customers to see details photos can't capture.
Track these metrics in Google Analytics with custom events for VDP views, form submissions, and CTA clicks. Set up separate tracking for mobile vs desktop so you can identify device-specific issues.
Visual Content Optimization
Photos sell cars. Or more accurately, the right quantity and quality of photos overcome the objections that prevent customers from inquiring.
Photo quantity matters more than most dealers realize. Minimum 20 photos per vehicle. Ideal range is 30-40. This isn't excessive—it's answering the questions customers would ask in person: What's the interior condition? Does it have roof rails? What about the cargo area? Are there any scratches or damage? Professional vehicle merchandising makes this systematic.
Photo quality standards should be consistent across your inventory. Resolution of at least 1200x800 pixels. Good lighting that accurately shows color. Clean vehicles without reflections or distracting backgrounds. Professional photography is ideal but not always practical—consistent amateur photography beats inconsistent professional shots.
Photo sequencing follows a logical flow. Start with exterior angles (front 3/4, side, rear, other side). Move to interior (front seats, rear seats, dashboard, center console, cargo). Finish with features (engine, wheels, special equipment). Don't randomize—customers should be able to mentally "walk around" the vehicle.
360-degree spin capability lets customers rotate the vehicle and view from any angle. This technology is becoming standard and significantly increases engagement time. Customers interact with 360 spins 3x longer than static photo galleries. Strong vehicle merchandising processes ensure consistency.
Video walkaround integration doesn't need to be Hollywood production quality. A 60-90 second video shot on a smartphone, walking around the vehicle while highlighting features, performs better than no video at all. Dealers doing this consistently see 30-40% higher inquiry rates. Learn more about automotive video marketing.
Photo optimization for speed is critical. High-resolution photos are great for detail but terrible for page load speed. Use responsive images that serve appropriate sizes based on device. Implement lazy loading so images below the fold don't delay initial page load.
Vehicle Information Hierarchy
Customers scan VDPs in predictable patterns. Eye-tracking studies show they look for specific information in specific order. Your VDP layout should match that natural flow.
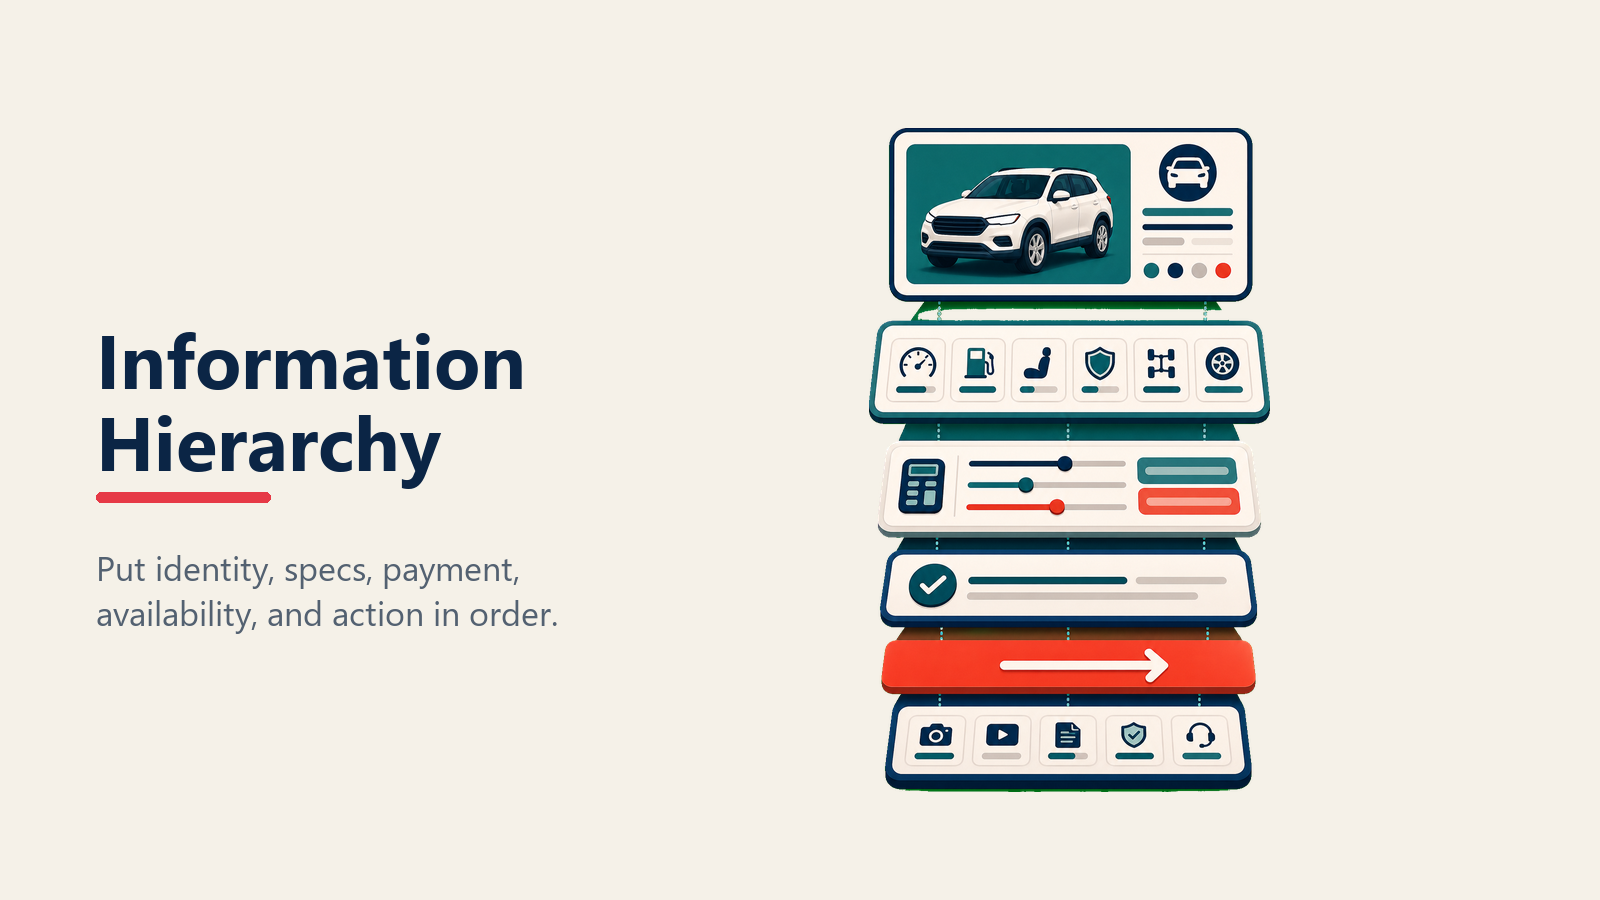
Above-the-fold critical elements include vehicle name (year, make, model, trim), price, key specs (mileage, drivetrain, exterior color), and primary CTA button. If customers have to scroll to see the price or can't find the contact button, you're losing conversions.
Price prominence and transparency builds trust. Don't hide the price behind "Call for price" unless it's genuinely a special circumstance. Show your advertised price clearly. If you're using market pricing or internet specials, explain the pricing structure simply.
Key specs should be scannable. Year, mileage, transmission, drivetrain, exterior and interior colors, VIN. Don't bury this in paragraph text. Use a clean table or list format.
Vehicle highlights call out the features that sell this specific vehicle. "One owner," "Clean Carfax," "Recent trade-in," "Just serviced," "Leather seats," "Sunroof." Three to five highlights positioned prominently.
Detailed specifications belong below the fold but should be comprehensive. Every feature, standard and optional. Safety technology. Entertainment systems. Mechanical specs. Warranty information. The more complete your specs, the fewer questions customers need to ask.
Vehicle history like Carfax or AutoCheck reports should be available directly from the VDP. One-click access to history reports. For CPO vehicles, feature the certification prominently with links to coverage details.
Pricing & Payment Information
Transparency wins. Customers are already comparing your price to five other dealers. Don't make them work to understand what they'll actually pay.
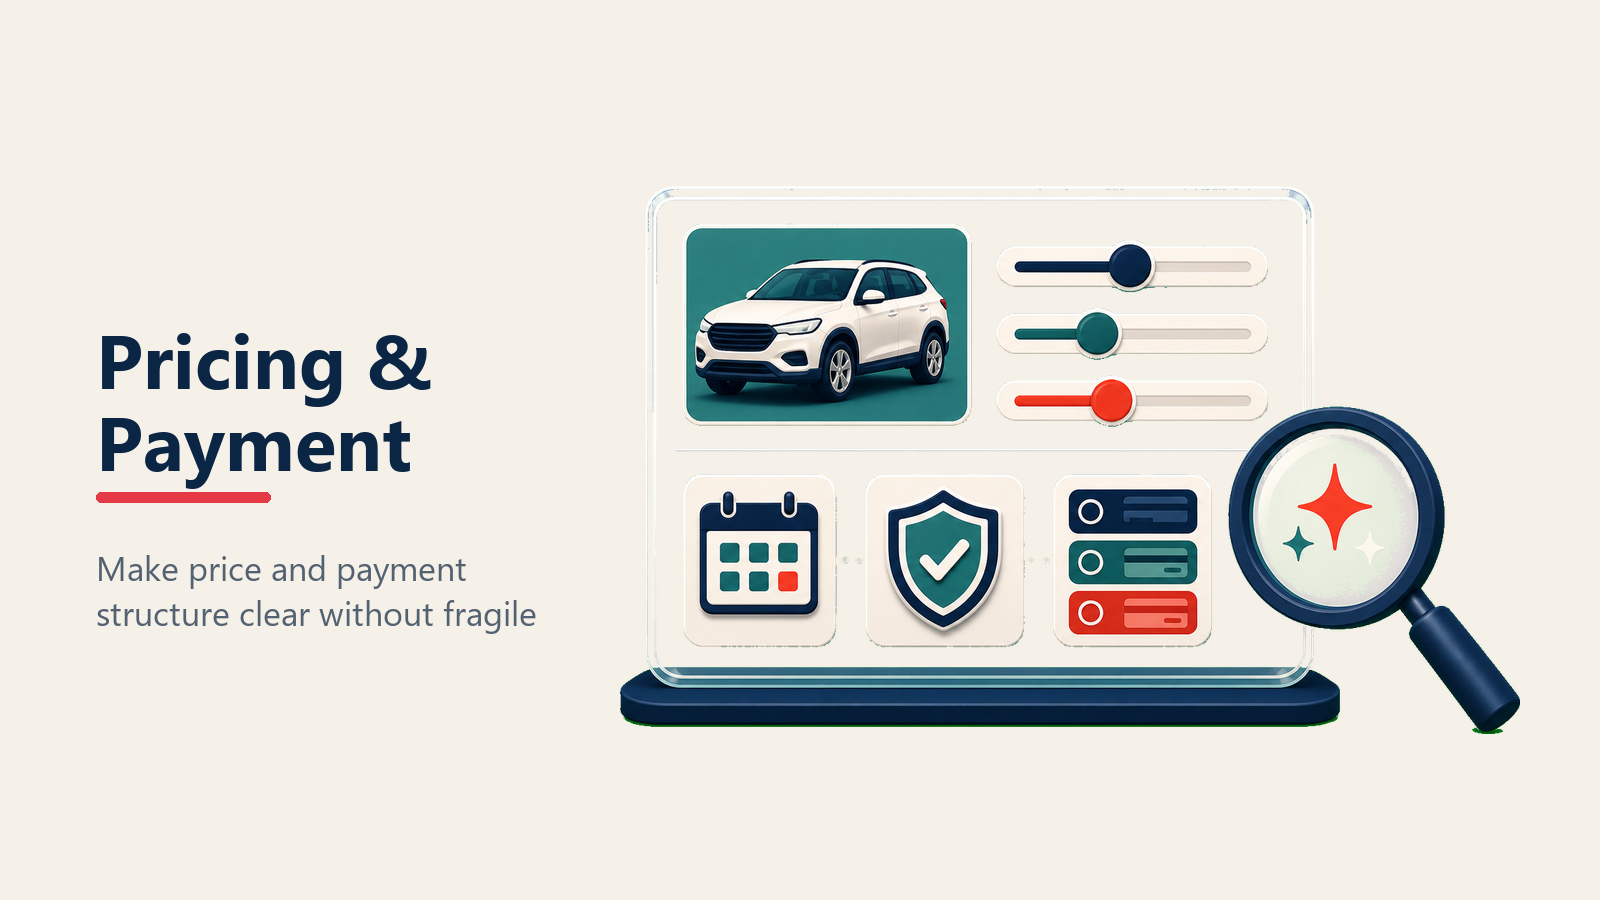
Transparent pricing strategy means showing your real price. If you advertise $25,995 but plan to negotiate, that's fine—but don't play games with fake discounts or rebates customers don't qualify for.
Market price indicators help customers understand value. "Below KBB market value by $1,200" or "Priced $800 below average market price" contextualizes your pricing against alternatives. Understanding online pricing transparency is critical.
Payment calculator integration should be embedded directly on the VDP, not a link to a separate page. Let customers adjust down payment, term, and trade value to see payment impacts. Use realistic interest rates based on average credit profiles, not the best possible rate.
Trade-in appraisal tool lets customers value their current vehicle while looking at yours. This helps them mentally calculate their net cost and makes the buying decision more concrete. Learn more about online trade-in tools.
Financing pre-qualification link connects to your credit application or a soft-pull tool that shows them real financing options. Don't promise 0% APR to everyone when only 12% of customers qualify.
Special offers and incentives applicable to this specific vehicle should be highlighted. Manufacturer rebates, dealer discounts, financing specials, loyalty programs. Make it clear what customers actually qualify for.
Call-to-Action (CTA) Strategy
You can have perfect photos, transparent pricing, and compelling copy, but if your CTA buttons are buried or unclear, conversions will suffer.
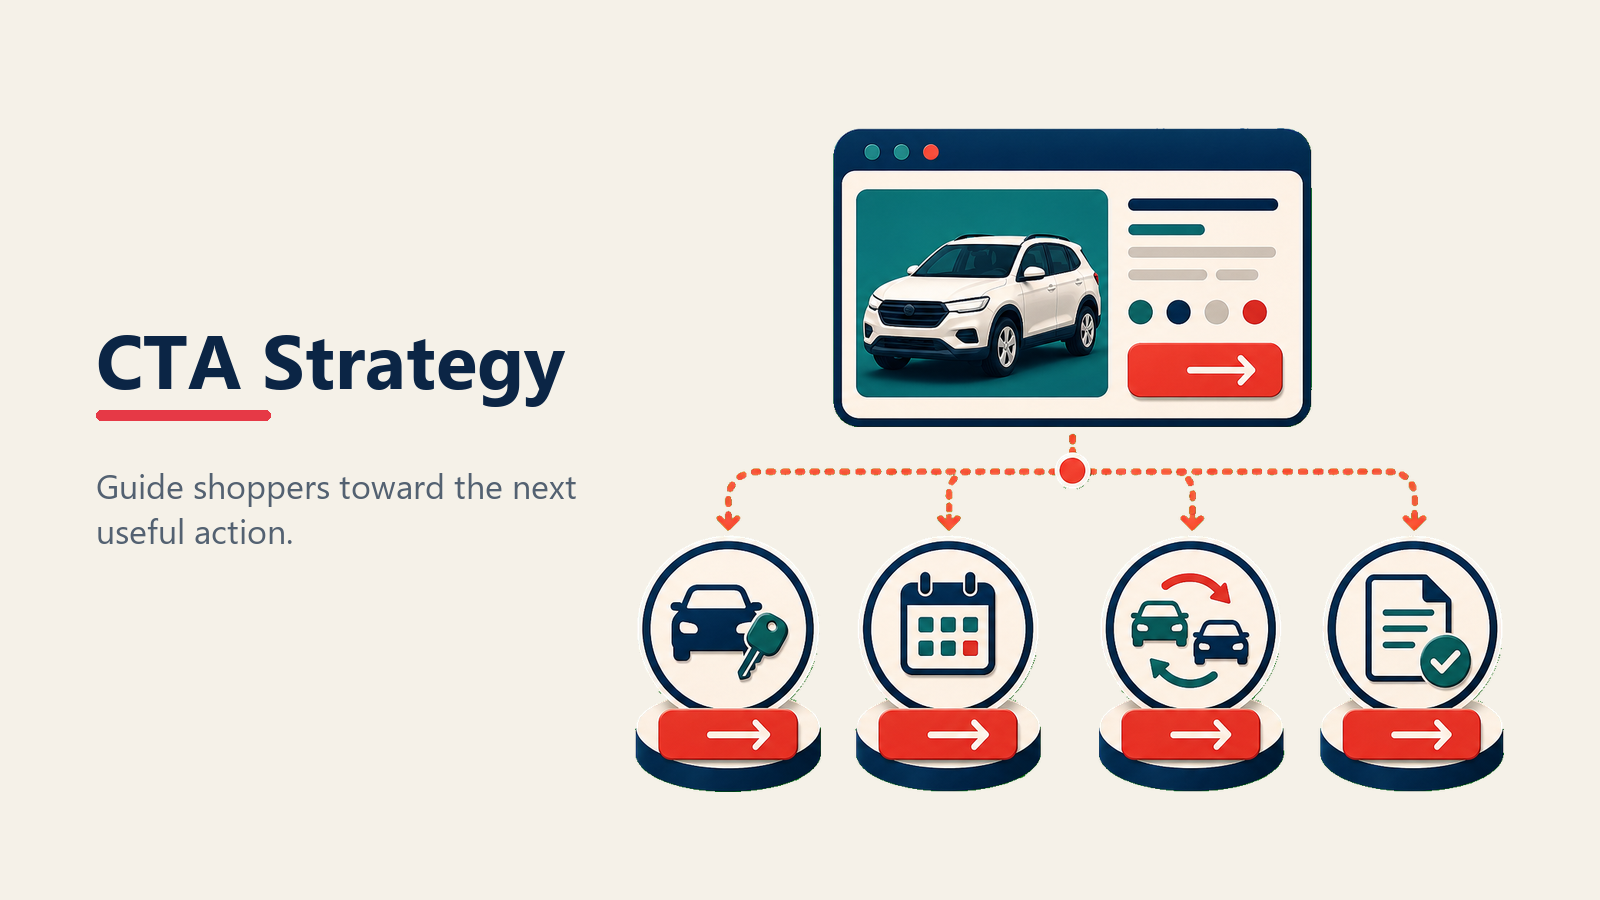
Primary CTA placement should be above the fold and sticky (follows the user as they scroll). "Check Availability," "Contact Us," "Schedule Test Drive," "Get My Price." Choose one primary action, not five competing options.
Multiple contact options respect different customer preferences. Some people prefer to call. Others hate phone conversations. Offer call, email, text, and chat. But don't present them equally—prioritize the channel that converts best for your dealership.
CTA button copy optimization impacts conversion more than you'd expect. "Check Availability" converts better than "Contact Dealer" because it implies scarcity and urgency. "Get My Price" converts better than "Request Quote" because it suggests personalized pricing. Test different copy quarterly.
Mobile-optimized click-to-call is non-negotiable. Phone numbers should dial with one tap on mobile devices. No copy-paste. No friction.
Appointment scheduling links that go directly to your online scheduler or calendar booking tool. "Schedule Your Test Drive" with a time slot selector converts better than "Contact us to schedule." Implement appointment setting best practices.
Test drive requests as a separate CTA often perform well. Lower commitment than "Contact us to buy" but higher intent than "Get more information." Learn test drive best practices.
Lead Capture Forms
The traditional dealer lead form asks for name, phone, email, address, best time to call, preferred contact method, trade-in info, and comments. That's 8-10 fields. Every additional field reduces conversion by 5-10%.
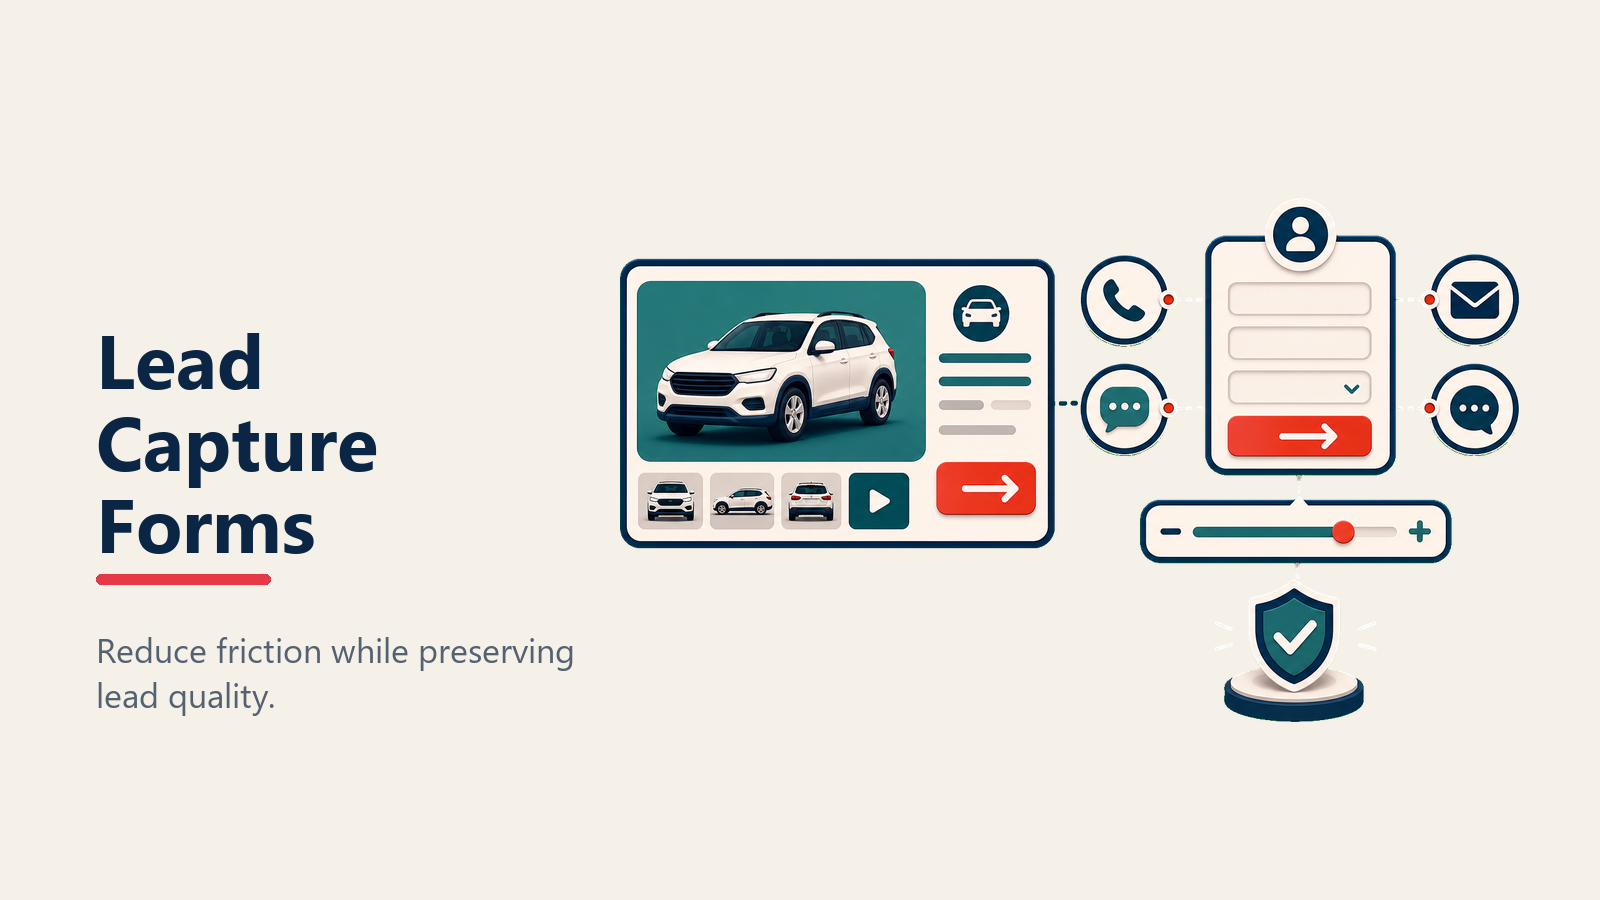
Field quantity impact is dramatic. A 3-field form (name, phone, comments) converts at 8-12%. A 7-field form converts at 3-5%. Do the math on what's more valuable: twice the conversion with less information, or half the conversion with complete profiles.
Progressive profiling strategy solves this tension. Start with minimal fields (name and phone or email). Collect additional information during the follow-up conversation or via subsequent touchpoints. Your BDC can ask for address when scheduling appointments. Your sales team can gather trade info when they call back.
Pre-populated context improves conversion and response quality. The lead form should automatically include vehicle information (year, make, model, VIN, price). Your BDC knows exactly which vehicle the customer asked about. No confusion or "Which vehicle were you interested in again?"
Mobile form optimization requires larger input fields, appropriate keyboard types (numeric keyboard for phone numbers, email keyboard for email addresses), and minimal typing. Use dropdowns instead of open text when possible.
Conditional field display shows additional fields based on previous answers. If a customer selects "I have a trade-in," show trade-in fields. Otherwise, keep the form short.
Confirmation messaging should set expectations. "Thank you! We'll contact you within 10 minutes" or "Check your email for vehicle details and next steps." Tell customers what happens next.
Trust & Urgency Elements
Customers need reasons to act now rather than continuing to shop. Trust signals and urgency elements provide those reasons.
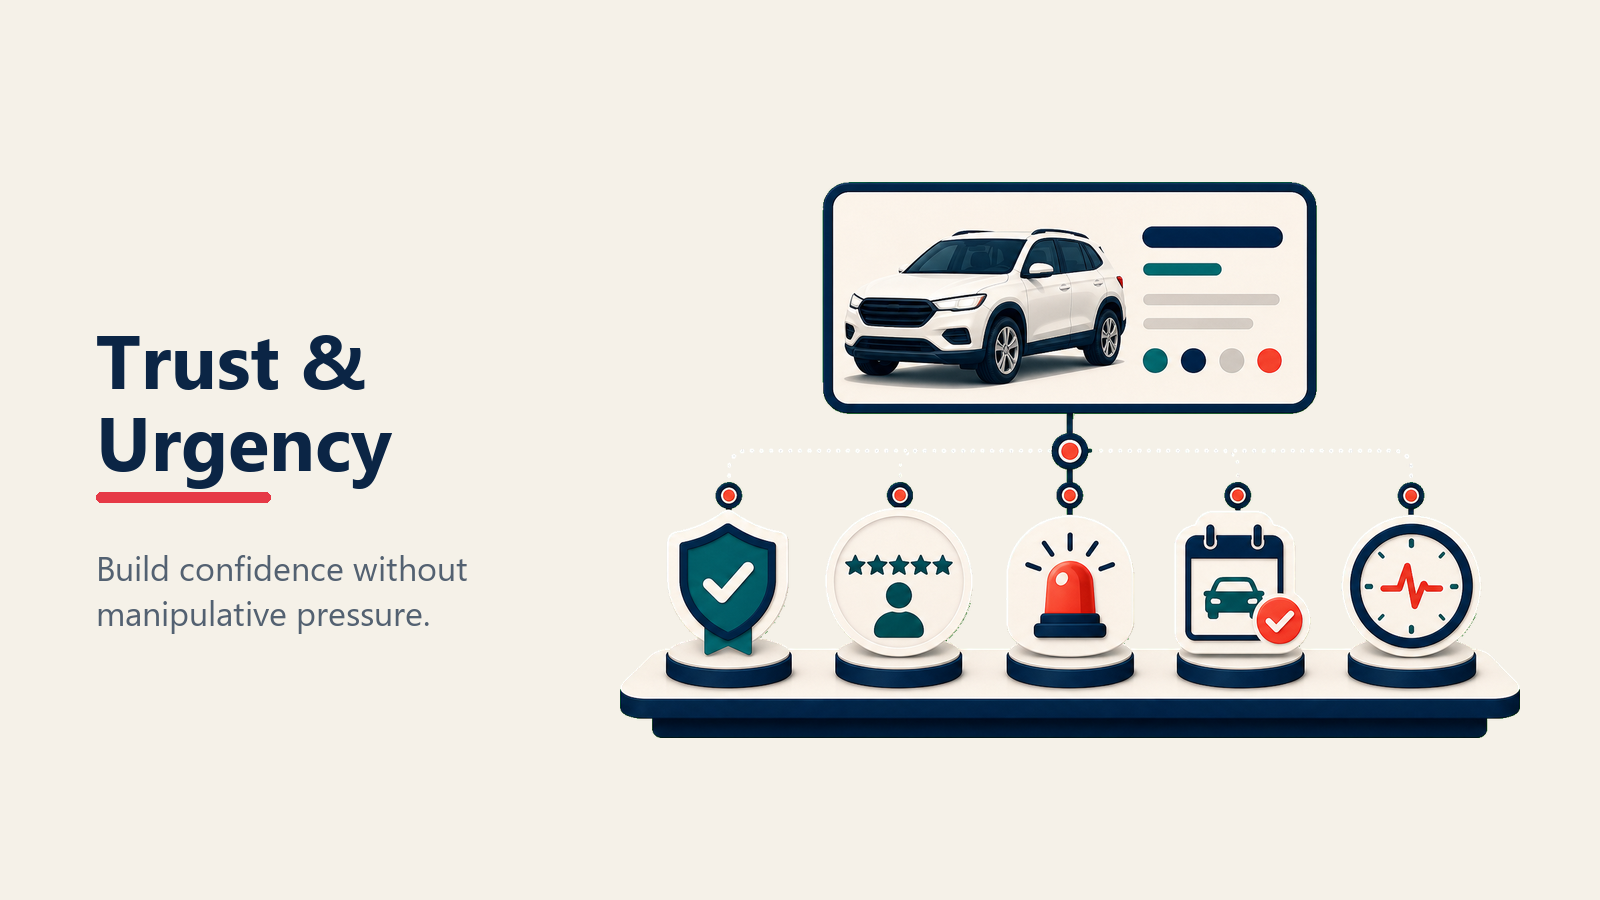
Dealership reviews and rating from Google, DealerRater, or Cars.com should be visible on every VDP. "4.8 stars from 1,247 reviews" builds credibility. Link to full reviews so customers can read specific feedback. Strong online review management drives conversion.
Price drop indicators create urgency. "Price reduced $1,500 this week" or "Lowest price in 60 days" signal that now is a good time to buy.
Days on lot information works both ways. "Just arrived" suggests fresh inventory worth seeing. "57 days in stock" suggests the dealer might be motivated to negotiate. Some dealers hide this, but transparency often works better.
Similar vehicles sold recently provide social proof. "We've sold 3 similar vehicles in the past 30 days" shows demand and suggests this won't last forever.
Inventory status like "In stock," "In transit," or "Reserved" helps customers understand availability. If it's reserved, offer to notify them when similar vehicles arrive.
Response time commitment builds trust. "We respond to inquiries within 10 minutes during business hours" or "Text us and get a response in under 5 minutes" sets expectations and differentiates from dealers who take 24 hours. Implement lead response time optimization.
Recommendation Engine
Most customers don't buy the first vehicle they view. Keeping them on your site to view alternatives is critical.
Similar vehicles by price show options $2,000-5,000 above and below the current vehicle. Customers with flexible budgets appreciate seeing what's available for a bit more or less.
Similar vehicles by model/type help customers compare your inventory. Viewing a Honda CR-V? Show other CR-Vs with different trim levels, colors, or mileage.
Alternative inventory suggestions based on customer behavior patterns. "Customers who viewed this also viewed..." Surface vehicles that might appeal to similar buyers. Data-driven automotive lead scoring helps prioritize follow-up.
Recently viewed vehicles remind customers of inventory they've already looked at. Make it easy to compare without starting over.
Personalization based on behavior becomes more sophisticated over time. Track which vehicles customers view, how long they engage, what features they filter for. Use that data to surface increasingly relevant recommendations.
Technical SEO for VDPs
Individual VDPs should rank in Google for specific vehicle searches: "2024 Honda CR-V near me" or "used Chevy Silverado [your city]."
Schema markup for Vehicle and Offer types tells Google exactly what's on the page. Price, mileage, condition, availability, seller details. This enables rich snippets in search results.
URL structure should be clean and keyword-rich. /inventory/used-2024-honda-cr-v-sport-vin123456/ is better than /vdp.aspx?id=89474.
Title tag optimization includes year, make, model, trim, and location. "2024 Honda CR-V Sport for Sale in [City] | [Dealer Name]" captures relevant searches.
Meta description templates auto-generate from vehicle data. Include price, mileage, key features, and a CTA. "2024 Honda CR-V Sport with 18,500 miles, leather, sunroof. Priced at $28,995. View photos and schedule a test drive."
Image alt text should describe what's in the photo. "2024 Honda CR-V exterior front view" rather than "IMG_4473.jpg." Helps with image search visibility and accessibility.
Canonical tags prevent duplicate content issues when you have similar vehicles or syndicate inventory to third-party sites.
Speed Optimization
VDP page speed directly impacts conversion. A 1-second delay reduces conversions by 7%. Three seconds of load time costs you 20% of potential leads. Analysis of 1,910 retail websites from North America's Top 50 auto groups shows that only 0.4% passed Google's Core Web Vitals on both mobile and desktop, representing a massive missed opportunity for conversion improvement.
Image lazy loading loads only images that are visible on screen. As users scroll, additional images load. This dramatically improves initial page load time for VDPs with 30+ photos.
Above-the-fold content prioritization ensures critical elements (vehicle name, price, main photo, CTA) load first. Don't let a video player or 40 photos below the fold delay what customers see immediately.
JavaScript defer/async prevents scripts from blocking page rendering. Analytics, chat widgets, and other third-party scripts should load asynchronously.
Browser caching stores static assets (CSS, JavaScript, images) locally so repeat visitors load pages faster.
CDN usage serves your VDP images from servers geographically close to visitors. Reduces load time by 40-60% for customers far from your server location.
Mobile speed targets should be under 3 seconds on 4G connections. Test regularly with Google PageSpeed Insights and fix issues flagged as high-priority. Optimize the complete mobile experience for buyers.
A/B Testing Framework
Optimization is an ongoing process. What works today might not work next quarter. Continuous testing is the only way to know what actually improves conversion.
CTA button color, copy, placement - Test green vs orange buttons. "Check Availability" vs "Contact Dealer." Top of page vs sticky footer. Change one variable at a time.
Photo quantity experiments - Test 15 photos vs 30 vs 45. Measure time on page and conversion rate. Find the sweet spot for your market.
Form field optimization - Test 3 fields vs 5 vs 8. Test different field orders. Test "Phone" vs "Phone or Email" vs both required.
Price display variations - Test showing price immediately vs "Click for Price." Test with and without payment calculator. Test different pricing contexts.
Video vs photo-only performance - Compare conversion rates for VDPs with video vs without. Measure whether the lift justifies the production cost.
Run tests for at least two weeks and 100+ conversions per variation before declaring a winner. Small sample sizes produce false positives.
Moving Forward
VDP optimization is never finished. Customer expectations evolve. Mobile devices improve. Competitors get better. And the dealers who commit to continuous improvement will pull ahead.
Start with the fundamentals: 30+ quality photos, transparent pricing, clear CTAs, simple forms, fast load times. Get those right before worrying about advanced features.
Then test systematically. Change one element at a time. Measure results. Implement winners. Repeat monthly.
And remember that VDP conversion isn't just about the page itself. It's about the entire ecosystem—your advertising drives traffic to VDPs, your BDC follows up on leads generated from VDPs, your sales team closes deals that started with VDP inquiries. Optimize the full funnel, not just one page.
For context on building the traffic that reaches your VDPs, see Dealership Website Optimization and Automotive SEO Strategy. For converting VDP visitors into appointments, explore Chat & Messaging for Dealerships and Online Pricing Transparency. To enhance visual content, check out Automotive Video Marketing and Vehicle Merchandising.

Senior Implementation Consultant