Production Cost Variance Analysis: Finding and Fixing the Gap Between Standard and Actual Cost
Turn this article into takeaways for your work.


Each assistant summarizes the article only for you and suggests best practices for your work.
A plant controller pulls last month's numbers and finds labor cost 8% over standard. Nobody's surprised, because it happens most months. The report gets filed, the finance team notes it, and production keeps running the same way it always has. Six months later the same variance shows up again, still unexplained, still uncorrected.
That's the normal fate of variance analysis at a lot of manufacturers: a monthly accounting exercise that measures the gap between standard and actual cost without ever closing it. The formulas are simple. The discipline to act on them is not.
Variance analysis only earns its keep when it changes behavior. Done well, it tells you exactly which cost element moved, why it moved, and who owns the fix. Done poorly, it's a report nobody reads past the total at the bottom.
What a Cost Variance Actually Tells You
A cost variance is the difference between what a product was supposed to cost, according to your standard cost, and what it actually cost to produce. Standard costs come from engineering estimates, historical performance, or negotiated material prices, captured as part of your broader manufacturing cost structure.
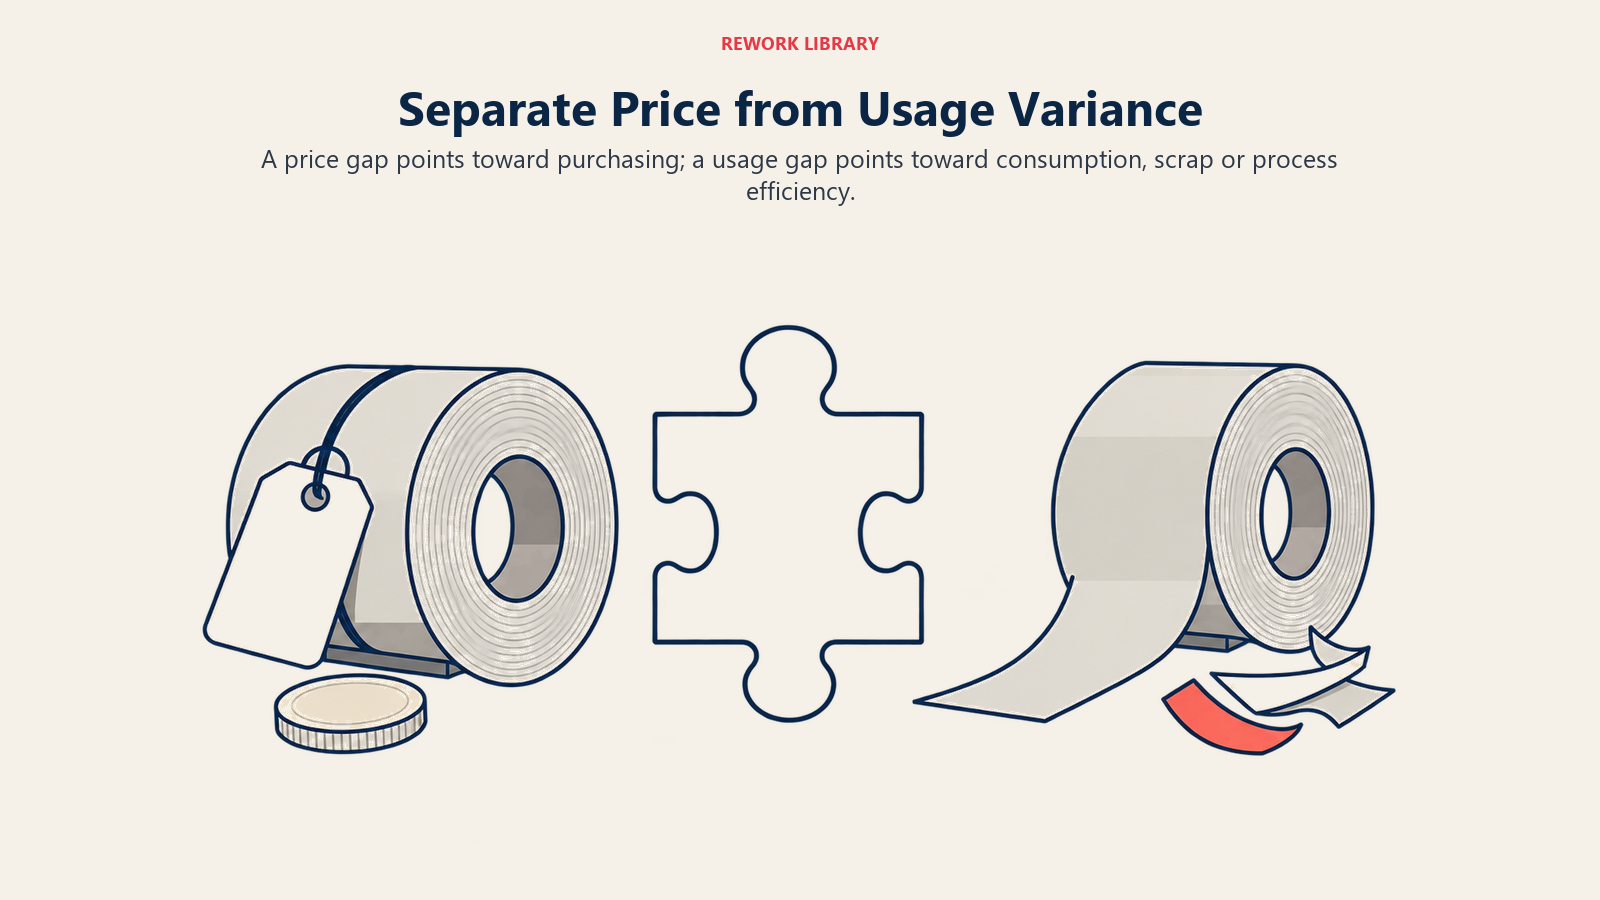
Variance analysis in manufacturing decomposes the total gap into material, labor, and overhead variances, and then breaks each of those into a price component and a quantity component. That split matters because price and quantity variances have almost nothing in common as root causes. A material price variance points to procurement, market prices, or supplier contracts. A material usage variance points to scrap, yield, or process control on the shop floor. Lumping them together as "material variance" tells you a problem exists without telling you where to look.
One CPA advisory firm working with midmarket manufacturers put it plainly in its variance guidance: a cost overrun that shows up in the monthly financials has almost always been building for weeks, and by the time it appears as an unfavorable variance on the management report, the production run is complete, the materials have been consumed, and the labor hours have been spent (JMCO). That's the core problem with monthly variance reporting: it's a rearview mirror. The value comes from what you do differently next month, not from re-litigating a run that already shipped.
The Standard Variance Formulas
Every manufacturing variance follows the same basic pattern: compare what you planned against what happened, and isolate whether the gap came from price or from quantity/efficiency.
Material price variance measures whether you paid more or less than expected for the material you bought:
(Standard Price − Actual Price) × Actual Quantity Purchased
Material usage (quantity) variance measures whether you used more or less material than the standard calls for for the units produced:
(Standard Quantity Allowed − Actual Quantity Used) × Standard Price
Labor rate variance measures whether your actual wage rate differed from standard:
(Standard Rate − Actual Rate) × Actual Hours Worked
Labor efficiency variance measures whether workers took more or fewer hours than the standard allows:
(Standard Hours Allowed − Actual Hours) × Standard Rate
Overhead variances split similarly into a spending component (did you spend more than budgeted on overhead items) and a volume or efficiency component (did production volume differ from the level overhead rates were built around). Because overhead gets allocated rather than directly traced, overhead variance analysis depends heavily on how you approached overhead cost allocation in the first place. A poor allocation method produces overhead variances that reflect allocation error more than real performance.
A simple example illustrates the mechanics: if a company sets a standard cost of $6.00 per unit ($1.00 material, $2.00 labor, $3.00 overhead) and actual cost comes in at $6.50, that $0.50 gap needs to be traced back to its source, whether that's a material price increase, a labor efficiency problem, or an overhead spending issue, before anyone can act on it (JMCO).
Building a Variance Reporting System That People Actually Use
Calculating variances is the easy part. The system around them determines whether anyone acts on the numbers.

Set materiality thresholds before you start reporting everything. Not every variance deserves investigation. A $50 favorable labor variance on a $2 million production run is noise. Define thresholds, both in dollar terms and percentage terms, that trigger a formal investigation. Most manufacturers use something like the greater of 5% of standard cost or a fixed dollar amount scaled to the product line. Below that, note the variance and move on. Above it, someone owns an explanation.
Assign ownership by variance type, not by department convenience. Material price variance belongs to procurement. Material usage variance belongs to production and quality, since it usually traces to scrap, rework, or process drift. Labor rate variance belongs to HR and operations, tied to overtime, shift premiums, and staffing mix. Labor efficiency variance belongs to the production supervisor. Overhead variances belong to whoever controls the underlying spending. When a variance report lists a number with no named owner, nobody feels accountable for the next period.
Report variances close to when they happen, not just at month-end. A monthly close cycle means a bad week of scrap sits undetected for three to five weeks before anyone sees the usage variance. Weekly or even daily flash reporting on the highest-volume products catches problems while the root cause is still fresh and fixable. This is one of the strongest arguments for integrating variance tracking with your ERP for manufacturing system and, where volumes justify it, a manufacturing execution system that captures actual material consumption and labor hours at the operation level instead of at period-end.
Separate controllable variances from uncontrollable ones in how you present results. A material price variance driven by a global commodity spike isn't a production performance problem, and burying it in the same bucket as a preventable usage variance dilutes the signal. Some manufacturers report a "purchase price variance" separately from "manufacturing variance" specifically so operations leaders aren't held accountable for market moves they can't control.
Investigating Root Cause Instead of Just Reporting the Number
A variance number by itself is a symptom, not a diagnosis. Effective investigation follows a consistent path.

Start with the largest variances by dollar impact, not by percentage. A 2% variance on your highest-volume product usually matters more than a 40% variance on a product you make twice a year. Rank variances by absolute dollar impact each period and work down the list until you hit your investigation threshold.
For usage and efficiency variances, apply structured root cause techniques rather than accepting the first explanation offered. Root cause analysis methods like the five whys or a fishbone diagram prevent the investigation from stopping at a surface-level answer like "the operator was new" when the real issue is inadequate training standards or a fixture that makes the operation error-prone regardless of who runs it.
Cross-reference variance data with related metrics before drawing conclusions. A bad labor efficiency variance that coincides with a spike in scrap and rework, tracked through your scrap and rework reduction program, usually has a shared root cause: a process, tooling, or material problem that's driving both slower cycle times and higher defects at once. Treating them as separate variance line items misses the connection. The same logic applies to comparing variance trends against your broader labor productivity metrics, since a persistent efficiency variance on one line often shows up first as a productivity trend before it becomes a formal accounting variance.
Watch for variances that repeat every period without ever getting resolved. A recurring unfavorable variance of similar size, month after month, usually means the standard itself is wrong rather than that performance is failing. If actual cost consistently runs 6% over standard on the same product, the standard needs updating, not another investigation memo. Standards built years ago on outdated labor rates, superseded bills of material, or process changes that were never reflected in the standard will generate "problems" indefinitely until someone corrects the baseline.
Connecting Variance to Financial and Operational Decisions
Variance data is only useful when it feeds decisions beyond the accounting close.
Pricing and quoting. If actual costs consistently run above standard on a product family, quotes based on standard cost are systematically underpricing that work. Feed verified variance trends back into your quoting process so sales isn't pricing against numbers operations can't hit. This connects directly to the broader work of manufacturing cost analysis and to how product costing methods get set in the first place.
Margin management. Chronic unfavorable variance on a product erodes margin in ways that don't always show up clearly in a top-line manufacturing margin analysis until someone traces it back to variance data. A product that looks profitable at standard cost but consistently runs 10% over on actual cost may be far less profitable than the numbers in the ERP system suggest.
Capacity and scheduling decisions. Labor efficiency variances tied to excessive changeovers or short production runs often trace back to how the master production schedule sequences work, not to operator performance. Fixing the schedule, rather than pushing harder on the same operators, resolves the variance at the source.
Standard cost updates. Use variance trends, not annual calendar dates, to trigger standard cost revisions. When financial performance metrics at the plant or business unit level show margin compression that traces back to stale standards, that's the signal to refresh bills of material, labor routings, and overhead rates rather than waiting for the next scheduled review cycle.
Common Mistakes That Undermine Variance Analysis
Manufacturers repeatedly fall into the same traps with variance reporting.
Treating every variance as equally important. Without materiality thresholds, teams spend as much time explaining a $200 variance as a $200,000 one, and investigation fatigue sets in fast. People stop reading reports that never distinguish signal from noise.
Never updating standards. Standards set years ago and never revisited generate phantom variances that reflect stale assumptions rather than real performance problems, wasting investigation time on non-issues.
Analyzing variance in isolation from operations data. Finance calculates the numbers, but if operations never sees them tied to specific shifts, operators, equipment, or work orders, the data can't drive corrective action. Effective variance programs push the numbers back to the shop floor in a form supervisors can act on, not just to a monthly finance package.
No feedback loop to the people who caused or fixed the variance. If the person running the line that generated a scrap-driven usage variance never hears about it, there's no chance the same person avoids it next time. Close the loop by sharing relevant variance data at the team level, not just in the executive summary.
Frequently Asked Questions about Production Cost Variance Analysis
What's the difference between a favorable and unfavorable variance?
A favorable variance means actual cost came in lower than standard cost (you spent less than expected). An unfavorable variance means actual cost exceeded standard. Favorable variances still deserve a look. A large favorable material usage variance might mean the standard is loose, or it might mean quality is being cut in ways that will show up later as customer returns.
How often should we calculate cost variances?
For high-volume products, weekly is better than monthly because it catches problems while they're still fixable. For low-volume or infrequent production, calculating variance at the completion of each production run makes more sense than waiting for a calendar period to close.
Should small manufacturers without a full standard costing system still track variance?
Yes, in a simplified form. Even without a formal standard costing system, tracking actual material and labor cost per unit against a target and flagging deviations above a threshold captures most of the value. The full price/quantity decomposition matters more as volume and product complexity grow.
Why does our overhead variance seem to fluctuate more than material or labor variance?
Overhead variance is sensitive to production volume because overhead rates are typically calculated assuming a specific volume level. When actual volume differs meaningfully from the planning assumption, you get a volume variance that has nothing to do with spending control. Separate the volume component from the spending component before concluding overhead costs are out of control.

Co-Founder, Rework.com