Value Stream Mapping: Visualizing and Improving Manufacturing Flow
Turn this article into takeaways for your work.
Each assistant summarizes the article only for you and suggests best practices for your work.
A simple map can reveal millions in hidden waste and improvement opportunities. Value stream mapping visualizes how materials and information flow through your operations, exposing waste that daily familiarity masks. A product requiring 4 hours of processing might take 20 days from order to delivery. That 480:4 ratio of lead time to value-added time represents enormous improvement potential. VSM is a cornerstone of lean manufacturing principles.
VSM isn't just drawing pretty diagrams. It's a structured methodology for analyzing operations, identifying specific waste, designing improved processes, and implementing changes. Organizations that treat VSM as academic exercise create wall decorations. Those that use it as action-planning tool create competitive advantage through dramatically improved flow.
What Is Value Stream Mapping
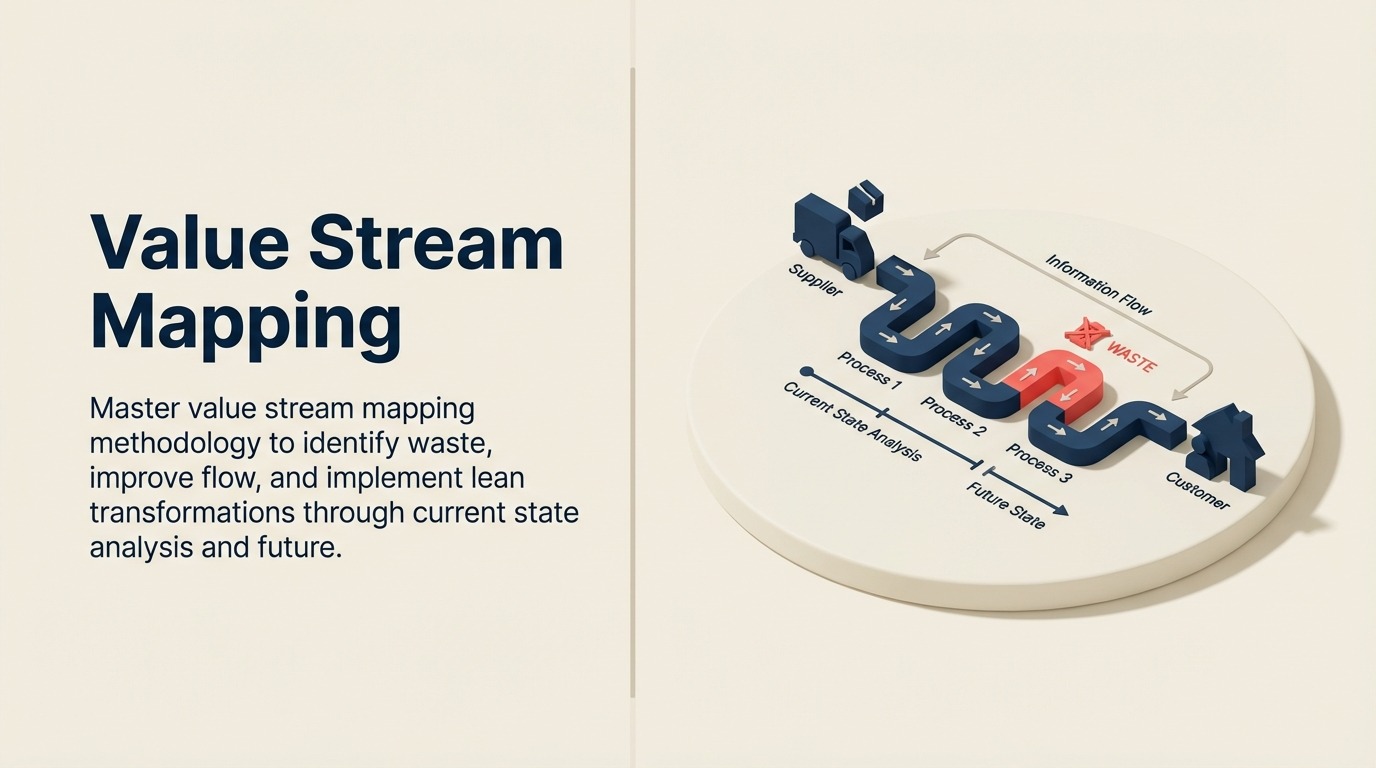
Value stream mapping creates visual representations of all activities:both value-adding and non-value-adding:required to bring products from raw materials through delivery to customers. Originally created by Toyota Motor Company, VSM is a lean-management method for analyzing the current state and designing a future state. Maps show material flow, information flow, and timeline to reveal where value is created and where waste accumulates.
Purpose and Benefits
VSM helps manufacturers see waste they've become blind to through familiarity. When you've worked a process for years, inefficiencies seem normal. Mapping forces you to see with fresh eyes and quantify what intuition suggests.
Benefits include: identifying waste systematically rather than randomly, connecting improvements to business impacts (lead time, inventory, capacity), creating shared understanding across functions, and generating actionable improvement plans with clear ownership.
The process of creating maps often generates more value than finished maps. Cross-functional teams debating data collection standards, questioning why things are done certain ways, and discussing improvement possibilities create insights and alignments that formal maps document but don't create alone.
Scope and Boundaries
Value streams extend from customer orders through delivery, often including design, procurement, and production. Don't limit scope to manufacturing. Waste often concentrates at functional boundaries: sales to operations, purchasing to production, production to shipping. Understanding your complete manufacturing value chain guides scope definition.
Define clear boundaries. Map from specific trigger points (purchase order received, forecast generated) to completion points (product ships, customer receives, installation completes). Without boundaries, maps become overwhelming.
Start with narrow scope: one product family through one facility. Expand scope as capability develops. Mapping entire supply chains from raw material suppliers through distribution networks requires sophistication most organizations don't initially possess.
When to Use VSM
Use VSM when launching lean implementations to identify opportunities and prioritize improvements. Use it when processes need major improvement or redesign:minor tweaking doesn't require mapping. Use it when lead times are excessive, inventory is high, or customer service is poor.
Don't use VSM for everything. Simple, well-functioning processes don't need mapping. Focus mapping energy on processes with significant improvement potential and business impact.
Mapping Process: Creating Current State Maps
Current state maps document existing reality. Resist the temptation to map ideal states or future possibilities. Document what actually happens, not what should happen or what procedures say happens.
Selecting the Product Family
Product families are groups of products flowing through similar process steps using similar equipment and resources. Mapping individual products creates too much detail. Mapping all products creates too little.
Select families based on: similar routing and processing, high volume or revenue impact, known problems requiring improvement, or strategic importance to business goals. Start with families where success is likely and impact is visible.
Verify family definition by comparing routings. If products use 80%+ same process steps, they're probably one family. If they diverge significantly, split into separate families requiring different maps.
Walking the Value Stream
Walk the actual process from beginning to end. Don't map from memory, procedures, or systems. Follow materials and information physically to see what really happens.
Observe at gemba (the real place where work happens). Watch workers perform operations. Note what they do, how long activities take, what they wait for, and where problems occur. The best understanding comes from being there, not reviewing reports.
Involve people who do the work. Operators know details that engineers miss. Their insights about problems, variations, and workarounds reveal realities that official processes obscure.
Capturing Data
Record key data for each process step:
Cycle time (C/T): Time to complete one unit. Measure with stopwatch over multiple cycles. Use average, noting range of variation.
Changeover time (C/O): Time to switch from one product to another. Often significantly longer than cycle time and determines batch sizes.
Uptime (%): Percentage of available time that equipment actually produces. Accounts for breakdowns, material shortages, and unplanned delays. Rarely matches theoretical availability.
Batch/lot size: Quantity processed before moving to next step. Large batches increase inventory and lead time but reduce changeover frequency.
Number of operators: People required to operate the process. Used to calculate labor content and identify opportunities for automation or rebalancing.
Available time: Hours per shift minus planned breaks and meetings. Typically 420-440 minutes per 8-hour shift.
For inventory between steps, count units and calculate days of inventory: (Inventory Units × Cycle Time) / Daily Demand. This converts physical units to time metrics consistent with cycle times.
Drawing the Map with Standard Symbols
Use standard VSM symbols for consistency and communication. Key symbols include:
Process boxes (rectangles) represent operations that transform materials. Label with process name, cycle time, changeover time, uptime, operators, and available time.
Inventory triangles show work-in-process between operations. Label with quantity and days of inventory.
Material flow arrows (thick lines) show physical movement. Direction indicates flow path.
Information flow arrows (thin lines with zigzag) show communication. Include email, phone calls, meetings, and system transactions.
Push arrow (filled) indicates production pushed based on schedule. Pull arrow (open) indicates production triggered by consumption.
Data boxes contain key process metrics organized below process boxes.
Timeline at bottom shows process time (value-adding time inside triangles) and wait time (non-value-adding time on baseline). This dramatically shows lead time vs. value-added time ratio.
Analysis Techniques: Finding Improvement Opportunities
Current state maps reveal where to focus improvement effort through systematic analysis.
Lead Time vs. Value-Added Time
Calculate total lead time (horizontal timeline) and total value-added time (sum of process times). The ratio reveals improvement opportunity. A 20-day lead time with 4 hours value-added time means 98% of time adds no value:pure waste.
World-class lean operations achieve 1:10 to 1:20 ratios. Traditional batch-and-queue operations run 1:100 to 1:1000 ratios. Understanding your current ratio and the possibility reveals transformation potential.
Every hour of lead time reduction without reducing value-added time represents waste elimination. This is "free" improvement:better results without more resources.
Identifying the Seven Wastes
Use VSM to systematically identify lean's seven wastes:
Overproduction: Large batches and push production visible in inventory triangles and push arrows.
Waiting: Time on baseline between process boxes represents waiting waste.
Transportation: Material flow arrows showing long distances or complex routing reveal transportation waste.
Over-processing: Cycle times higher than competitor benchmarks or value analysis suggest over-processing.
Inventory: Triangle sizes show excess inventory waste. Large inventory often hides other wastes.
Motion: While not directly visible on traditional VSMs, high operator counts relative to automation levels suggest motion waste opportunities.
Defects: Scrap rates and rework loops visible on detailed maps reveal quality waste.
Calculating Process Metrics
Calculate key metrics to quantify problems:
Rolled throughput yield: Probability a unit passes all operations without defects. Multiply first-pass yields: 95% × 96% × 94% × 97% = 83%. This means 17% of production has defects requiring rework.
Production lead time: Sum of all processing times and wait times. Compare to customer lead time requirements.
Value-added ratio: (Total value-added time / total lead time) × 100%. Lower ratios indicate more waste.
Dock-to-dock time: Calendar time from material receipt to product shipment. Customers care about this more than internal metrics.
Bottleneck Analysis
Identify bottlenecks where demand exceeds capacity. These constrain throughput and require focus. Look for: highest utilization, largest WIP accumulation before operations, and longest cycle times relative to others. Production bottleneck analysis provides systematic identification methods.
Mark bottleneck processes on maps. Improvements here increase system throughput. Improvements elsewhere might reduce waste but won't increase output if bottlenecks remain constrained.
Future State Design: Creating the Ideal Flow
Future state maps show improved processes after eliminating identified waste. They guide implementation by making targets concrete and visible.
Continuous Flow Where Possible
Design future states around continuous flow: products move one piece at a time from operation to operation without waiting. This eliminates inventory waste and dramatically reduces lead times.
Enable continuous flow through: balancing operation times (takt time), physically linking operations (cells), reducing batch sizes, and implementing quality at source (so defects don't flow downstream). Just-in-time production principles support continuous flow.
Continuous flow works where: demand is stable enough, products have similar routings, process times are balanced, and quality is high. It doesn't work everywhere, but wherever possible it provides dramatic improvement.
Pull Systems for the Rest
Where continuous flow isn't feasible (long changeovers, separated operations, unstable demand), design pull systems. Pull produces based on downstream consumption rather than upstream schedules. Kanban system implementation provides detailed pull mechanisms.
Kanban is common pull mechanism: downstream operations signal upstream when they consume materials, triggering replenishment. This maintains small buffers while preventing overproduction.
Design pull systems by: setting buffer sizes based on consumption rate and replenishment lead time, establishing clear signals (kanban cards, empty containers), and training operators on pull logic.
Leveling Production
Heijunka (production leveling) smooths production volume and mix to reduce variation. Instead of producing Monday's products Monday, Tuesday's products Tuesday (which creates uneven demand on suppliers and capacity), level production by making small batches of everything daily.
Leveling requires: reducing changeover times so small batches are economic, creating standard work-in-process buffers, and disciplined scheduling that resists special requests disrupting the level schedule.
Benefits include: stable workloads, predictable demand on suppliers, reduced inventory, better capacity utilization, and improved flow.
Setting Target Metrics
Future state maps should quantify improvement targets:
Lead time reduction: 50-75% reductions are common initially. World-class is 80-90% vs. current state.
Inventory reduction: 40-60% reductions are typical. Some lean implementations achieve 70-80%.
Productivity improvement: 20-40% more output with same or fewer people through waste elimination.
Quality improvement: 50%+ defect reduction through poka-yoke and process capability improvement.
Set targets that are stretching but achievable. Impossible targets demotivate. Easy targets don't drive meaningful change.
Implementation Planning: Turning Maps into Action
Maps create value only when you implement improvements. Translate maps into action plans with clear ownership and timelines.
Prioritizing Improvements
Not all improvements are equal. Prioritize based on: impact on key metrics (lead time, quality, cost), implementation difficulty (low-hanging fruit vs. major projects), resource requirements, and interdependencies (some improvements enable others).
Use impact-effort matrix: High impact + low effort = do first (quick wins). High impact + high effort = plan carefully and resource adequately (strategic projects). Low impact + low effort = do when convenient (housekeeping). Low impact + high effort = don't do (waste of resources).
Create implementation roadmap showing sequence and timing. Some improvements are prerequisites for others. Flow requires stable processes. Pull requires short lead times. Build improvements in logical sequence.
Creating Kaizen Plans
Translate future state into specific kaizen (improvement) projects. Each kaizen should: address specific waste or constraint, have clear objectives and metrics, involve appropriate cross-functional team, and complete within 3-5 days.
Typical kaizen breakdown for value stream improvement:
Setup reduction kaizen: Reduce changeover times to enable smaller batches.
Flow kaizen: Create cellular layouts and balance operations for continuous flow.
Pull system kaizen: Implement kanban and supermarket systems.
Quality kaizen: Implement poka-yoke and improve process capability.
Schedule 1-2 kaizens per month to maintain momentum without overwhelming organization. Allow time between events to sustain improvements and prepare for next events.
Assigning Ownership and Accountability
Every improvement needs an owner who's accountable for results. Owners don't necessarily do all work (they lead teams) but they're responsible for completion.
Define clear: what will be accomplished, measurable success criteria, timeline for completion, resources available, and reporting schedule.
Review progress weekly in gemba (at the workplace). Walk the value stream to see actual improvements, address obstacles, and maintain urgency. Visual management boards showing progress keep improvements visible.
Measuring Results
Track actual results against targets. Did lead time reduce as expected? Did inventory decline? Did quality improve? This validates improvement effectiveness and builds credibility for future projects.
Calculate financial impact. Inventory reduction frees cash. Lead time reduction enables higher throughput. Productivity improvements reduce costs. Translate operational improvements to financial terms that leadership understands.
Celebrate successes and share learnings. Recognition motivates teams and builds improvement culture. Publicizing results creates momentum for next improvements.
Learn More
Expand VSM capability through:
- Lean Manufacturing Principles provides lean foundation for VSM
- Manufacturing Value Chain shows value chain context for value streams
- Production Bottleneck Analysis complements VSM with constraint analysis
- Production Planning Fundamentals covers planning improvements enabled by VSM
- Manufacturing KPIs Overview explains metrics for tracking VSM improvements
- Capacity Planning Strategy addresses capacity gaps revealed by VSM
VSM as Continuous Improvement Tool
Value stream mapping isn't a one-time analysis. It's a continuous improvement tool used repeatedly as processes evolve and new opportunities emerge.
Create current state maps annually or when significant changes occur. Compare to previous maps to see improvement trajectory. Compare to future state targets to track progress. Update future states as you achieve targets and identify new possibilities.
Build VSM capability organizationally. Train internal facilitators who can lead mapping projects. Develop standard templates and protocols. Create rhythm of regular mapping and improvement that becomes normal work routine.
And remember that maps are means, not ends. The goal isn't beautiful maps. It's dramatically improved operations: faster lead times, lower costs, higher quality, better delivery. Maps guide improvement but implementation creates value.
That discipline:mapping to see waste, designing to eliminate it, implementing systematically, and measuring results:transforms value stream mapping from lean technique into competitive advantage through superior operational performance.
