Financial Performance Metrics for Manufacturers: The Numbers the Board Actually Asks About

Turn this article into takeaways for your work.


Each assistant summarizes the article only for you and suggests best practices for your work.
A plant manager can hit every operational target on the board, OEE up, scrap down, on-time delivery at 97%, and still walk into a quarterly review to find the CFO asking why margin didn't move. That disconnect happens because operational KPIs and financial performance metrics measure different things. One tells you how well the plant ran. The other tells you whether that performance actually made the business more valuable.
Manufacturing leaders need both, but they're not interchangeable. Your manufacturing KPIs overview covers the operational side: cycle time, defect rates, inventory turns viewed as a flow metric. This guide covers the financial layer that sits on top: the metrics a controller, CFO, or board member reaches for first, and how they trace back to what happens on the shop floor.
Profitability Metrics: Beyond the Top Line
Revenue growth gets attention, but profitability metrics tell you whether that growth is actually worth having.
Gross margin (revenue minus cost of goods sold, divided by revenue) is the starting point. For manufacturers, gross margin reflects material cost, direct labor, and manufacturing overhead relative to price. A shrinking gross margin with flat or rising revenue is one of the earliest warning signs that costs are outrunning pricing power, often before it shows up anywhere else.
EBITDA margin (earnings before interest, taxes, depreciation, and amortization, divided by revenue) strips out financing and capital structure decisions to show core operating profitability. It's the metric most board discussions and valuation conversations center on, because it makes performance comparable across companies with different debt loads and capital intensity. One manufacturing benchmarks report tracking more than 500 U.S. manufacturers found EBITDA margins for the sector projected to rise from 11.3% to 12.4%, with premium manufacturers generating more than twice the EBITDA per employee of low-cost competitors, a gap that traces to mix, automation, and pricing discipline rather than just scale (Chief Executive).
Operating margin sits between gross margin and EBITDA margin, capturing SG&A and other operating costs but excluding interest and taxes. Tracking all three together, gross, operating, and EBITDA, isolates where margin is being won or lost: production floor, overhead structure, or corporate cost.
Net margin is what's left after everything, including interest and taxes. It matters for shareholders and lenders but is the least useful for diagnosing operational performance because it's affected by financing decisions entirely outside the plant's control.
Return Metrics: Is Capital Being Used Well
Manufacturing is capital-intensive. Return metrics answer whether the capital tied up in the business, equipment, inventory, receivables, is generating an acceptable return.
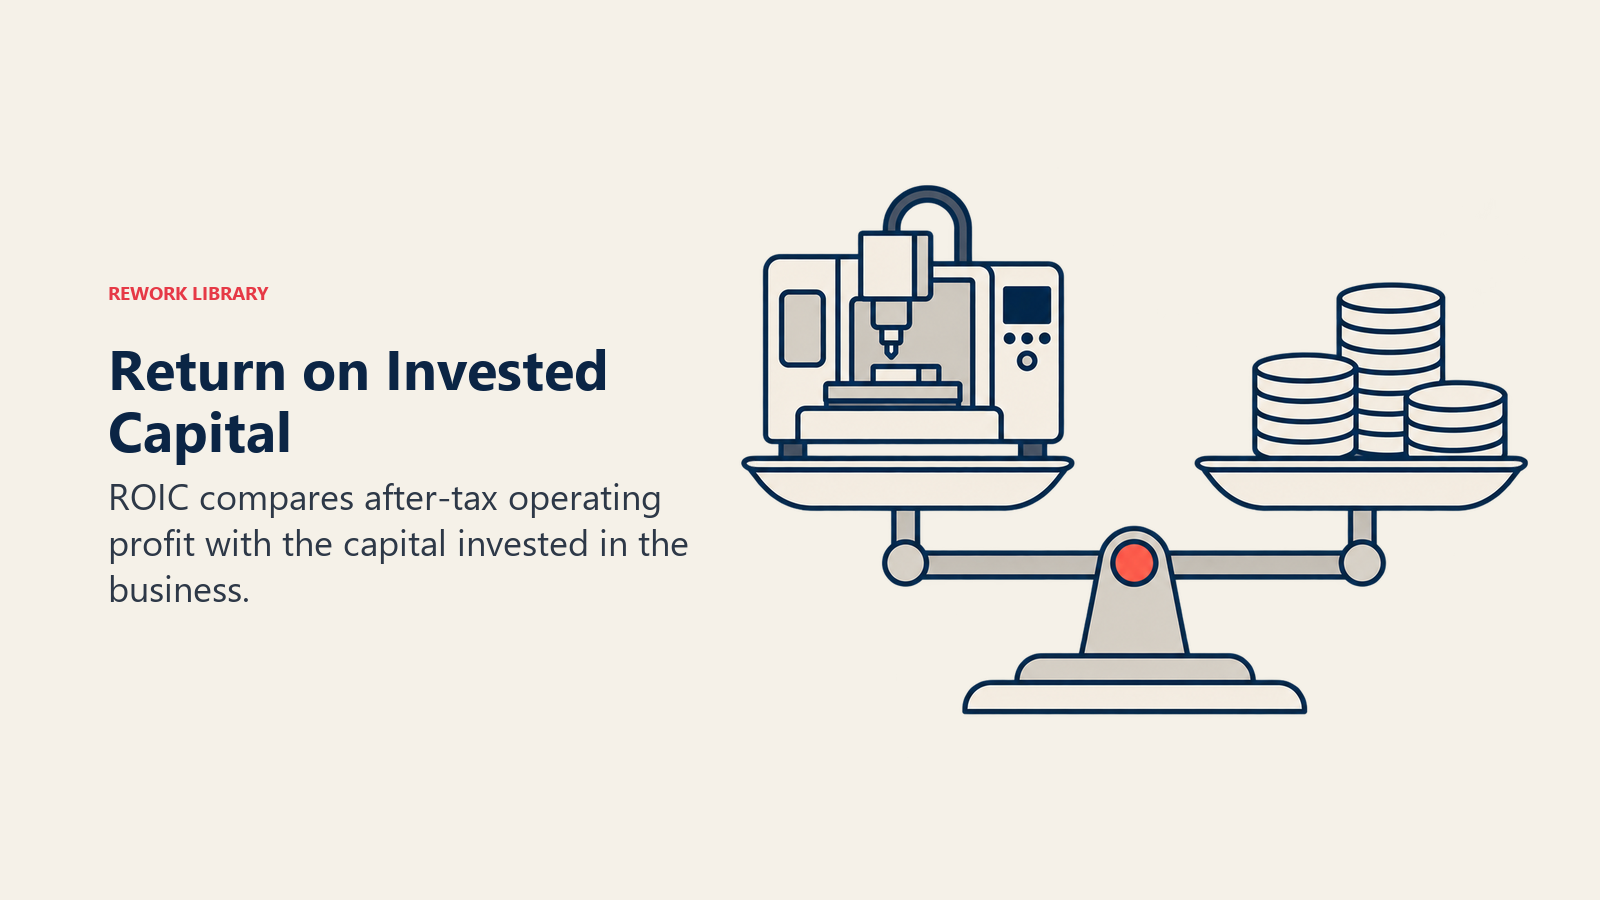
Return on invested capital (ROIC) measures after-tax operating profit against the total capital (debt plus equity) invested in the business. It's the cleanest single measure of whether a manufacturer is creating value, because it compares the return generated against the true cost of the capital used to generate it. A manufacturer growing revenue 15% a year while ROIC declines is growing in a way that destroys value, not creates it, usually because growth is being funded with capacity or inventory that isn't earning its keep.
Return on assets (ROA) is a simpler variant, net income divided by total assets, useful for comparing capital efficiency across plants or business units within the same company. Asset-heavy operations (large presses, continuous process lines, automated cells) will structurally run lower ROA than assembly-oriented operations, so ROA comparisons only make sense within similar operation types.
Capex intensity (capital expenditure as a percentage of revenue) shows how much revenue growth is costing in fixed investment. Rising capex intensity without a corresponding jump in capacity or capability is a sign that capital is being spent to maintain the status quo rather than to grow, often the result of deferred maintenance catching up or aging equipment requiring more frequent replacement.
Working Capital and Cash Metrics
Manufacturers tie up more cash in working capital than almost any other business type, which makes cash metrics disproportionately important to financial health.
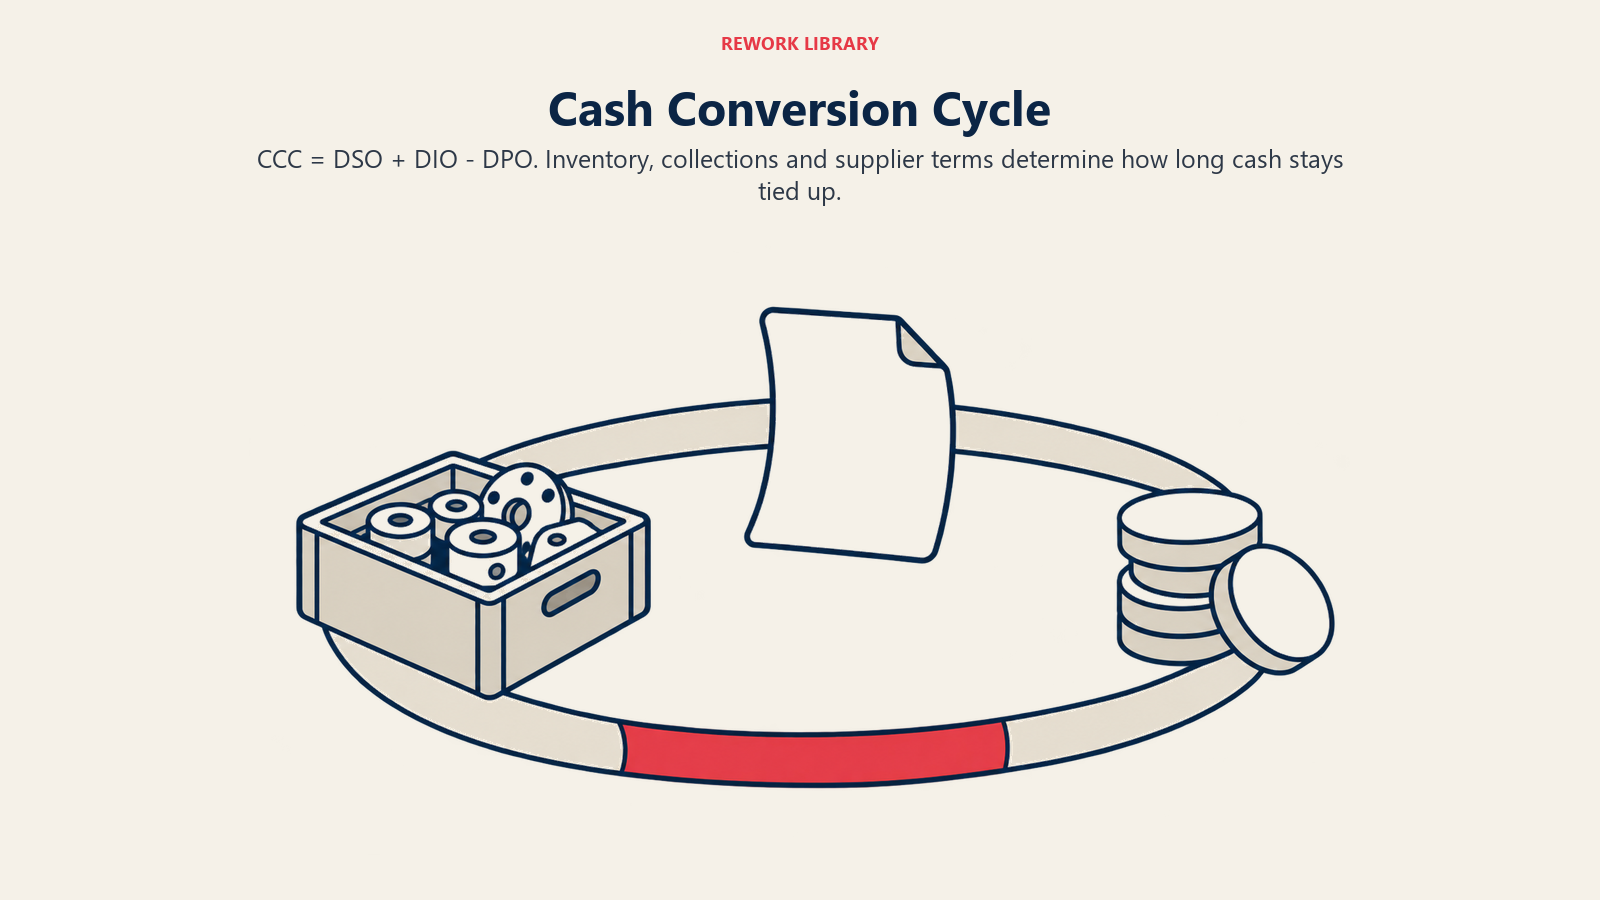
Days Sales Outstanding (DSO) measures how long it takes to collect payment after a sale. Days Inventory Outstanding (DIO) measures how long inventory sits before it's sold, covering raw material, work-in-process, and finished goods together. Days Payable Outstanding (DPO) measures how long you take to pay suppliers.
Cash conversion cycle (CCC) combines all three: DSO plus DIO minus DPO. It tells you how many days of cash are tied up in the operating cycle between paying for materials and collecting from customers. A shorter CCC means less working capital is needed to run the same revenue base, freeing cash for growth investment or debt reduction without raising new capital.
Deloitte's 2025 working capital research, covering major public companies across sectors, found that companies overall delivered 6.8% top-line growth alongside 9.9% EBITDA expansion, while the cash conversion cycle shortened by roughly 0.9 days year-over-year. Notably, the gains came almost entirely from reducing Days Inventory Outstanding and extending Days Payable Outstanding, while Days Sales Outstanding actually rose as collection pressures persisted (Deloitte). That pattern matters for manufacturers specifically: inventory and payables terms are usually more within operational control than customer payment behavior, which makes inventory optimization strategies and supplier payment terms the more reliable levers for CCC improvement compared to chasing faster collections.
Free cash flow (operating cash flow minus capital expenditure) is the ultimate test of financial health: cash actually generated after funding the investment needed to sustain and grow the business. A manufacturer can show strong EBITDA and still generate weak free cash flow if working capital is expanding or capex is running high, which is why free cash flow and EBITDA margin need to be read together, not separately.
How Financial Metrics Connect to Shop Floor Performance
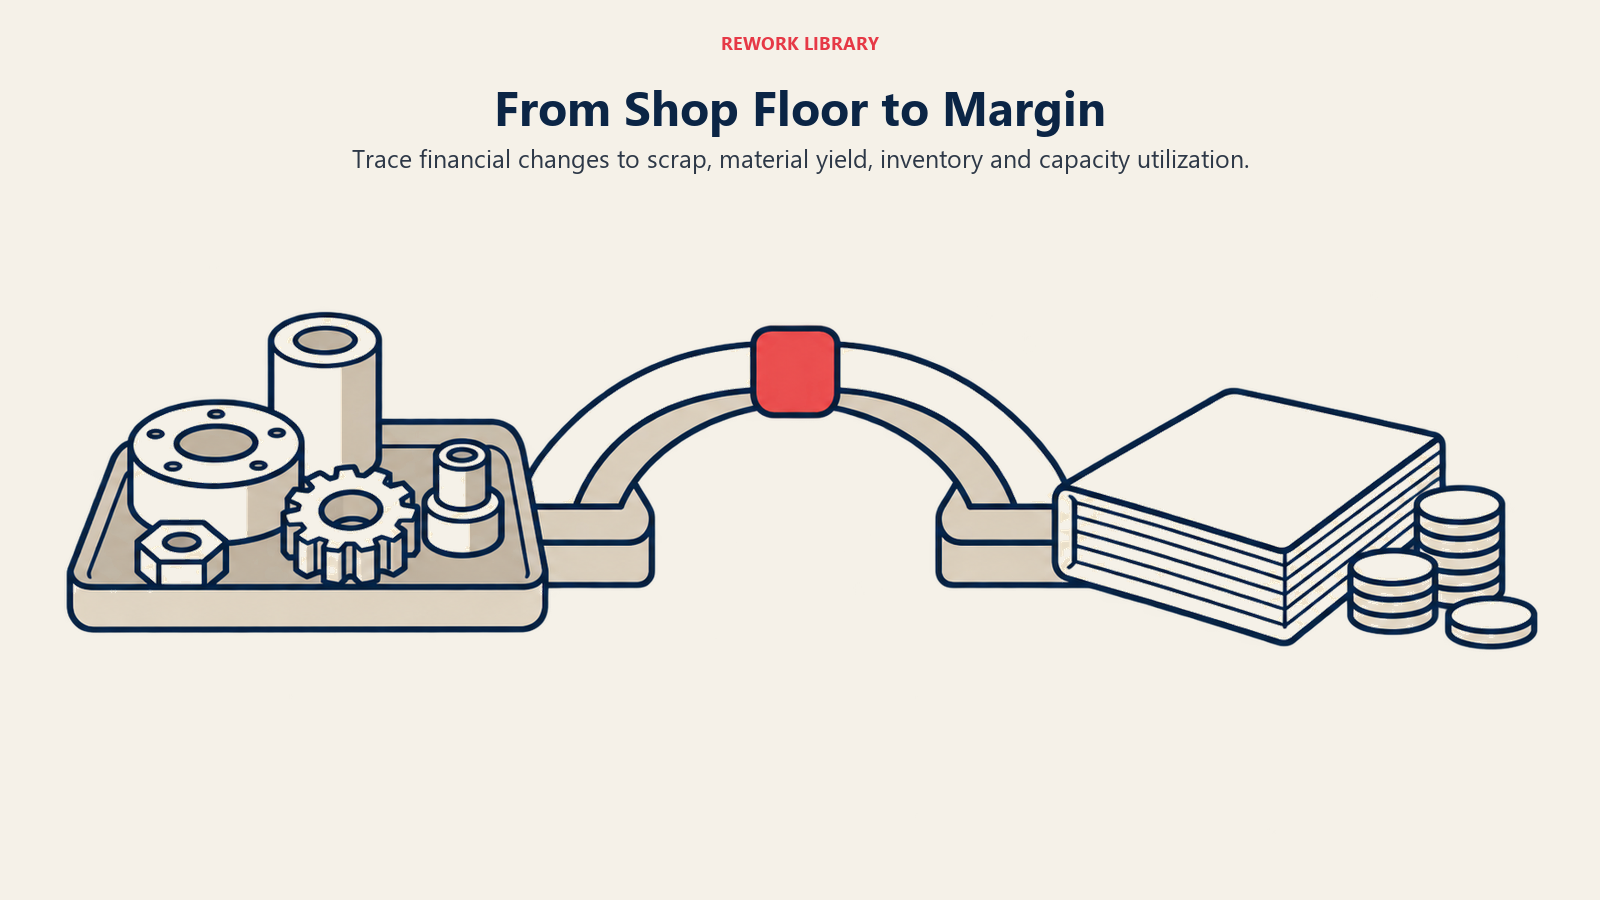
The gap between operational and financial metrics closes when you can trace the connection explicitly.
| Financial Metric | Operational Driver | Where to Look |
|---|---|---|
| Gross margin | Scrap rate, material yield, labor efficiency | Manufacturing cost analysis, production cost variance |
| EBITDA margin | Overhead absorption, capacity utilization | Overhead cost allocation, manufacturing margin analysis |
| DIO (inventory days) | Lot sizes, forecast accuracy, safety stock | Inventory optimization strategies, safety stock calculation |
| ROIC | Capacity utilization, asset productivity | Manufacturing capacity expansion, manufacturing kpis overview |
| Free cash flow | Order-to-cash cycle speed | Quote-to-cash process |
This mapping is the difference between a finance team that reports a margin decline and one that can walk into the plant and point at the cause. When gross margin drops two points, the first question should be whether it traces to a material price variance, a usage variance, or a shift in product mix toward lower-margin work, not a general conversation about "cost pressure."
Building a Financial Reporting Cadence Manufacturing Leaders Can Actually Use
Monthly close is table stakes, but it's too slow for operational correction. Financial metrics reported only at month-end tell you what already happened, three to five weeks after the decisions that drove the result. Pair the formal monthly close with a lighter weekly flash report covering gross margin trend, inventory position, and cash, so plant and finance leaders see directional movement before the close locks it in.
Segment metrics by product line and customer, not just company-wide. Company-level gross margin can look healthy while masking a product line or customer segment that's actively losing money. Margin analysis broken out by product and customer, rather than reported only in aggregate, surfaces problems that an average conceals.
Put financial and operational metrics on the same dashboard, reviewed in the same meeting. When OEE, scrap rate, and gross margin live in separate reports reviewed by separate audiences, nobody connects cause and effect. A well-designed manufacturing KPI dashboard that puts financial and operational metrics side by side, viewed by both plant and finance leadership, closes that gap directly.
Tie metrics back to the growth stage the business is in. Early-stage growth often trades margin for market share deliberately, while a mature, stable manufacturer should show margin expansion as a primary signal of health. Reference your manufacturing growth model when deciding which financial metrics deserve the most weight at a given stage, since chasing margin expansion during an intentional growth investment phase can lead to the wrong conclusions.
Common Misreadings of Financial Metrics
Treating revenue growth as automatically good news. Revenue growth funded by extending customer payment terms, discounting into low-margin business, or building inventory ahead of soft demand shows up as growth in the top line while quietly destroying cash and margin. Always read revenue growth alongside gross margin and cash conversion cycle before calling it a win.
Comparing EBITDA margin across dissimilar operations without adjusting for capital intensity. A continuous-process operation with heavy fixed assets will structurally carry different margin and return profiles than a light-assembly operation, even in the same industry. Benchmark against operations with a similar capital structure, not just the same broad industry label.
Ignoring the timing mismatch between operational fixes and financial results. A scrap reduction initiative that improves yield this month won't show up in gross margin until the affected inventory works its way through the system and gets sold. Expect a lag of one to three months between an operational improvement and its financial confirmation, and don't declare an initiative a failure based on the first reporting period alone.
Frequently Asked Questions about Financial Performance Metrics
What's the single most important financial metric for a manufacturer to track?
There isn't one, but if forced to pick two, EBITDA margin and cash conversion cycle together capture both profitability and capital efficiency, the two dimensions that most reliably predict long-term financial health in a capital-intensive business.
How is EBITDA margin different from gross margin for a manufacturer?
Gross margin only accounts for cost of goods sold (materials, direct labor, manufacturing overhead) against revenue. EBITDA margin also nets out SG&A and other operating costs, giving a fuller picture of total operating profitability before financing and tax effects.
Why does cash conversion cycle matter more for manufacturers than for service businesses?
Manufacturers carry inventory across raw material, work-in-process, and finished goods stages that service businesses don't have at all. That inventory ties up cash for weeks or months before it converts to a sale, making the inventory component of CCC a much larger and more controllable lever than it is for most service companies.
How often should financial performance metrics be reviewed at the plant level?
Monthly for the formal financial close, but weekly directional tracking of margin, inventory, and cash trends catches problems while there's still time to act within the same quarter, rather than discovering them after the books close.

Co-Founder, Rework.com