Overall Equipment Effectiveness (OEE): Maximizing Production Capacity and Asset Utilization
Turn this article into takeaways for your work.
Each assistant summarizes the article only for you and suggests best practices for your work.
A food processing company invested $2.8 million in a high-speed packaging line rated to produce 400 units per minute. They expected this capacity to transform their operations. Six months after installation, the plant manager reviewed actual output: only 960 units per hour, 40% of theoretical capacity.
What happened to the other 60%? Equipment breakdowns stopped production 12% of scheduled time. Changeovers between products consumed another 8%. When running, the line operated at 72% of rated speed due to minor jams and adjustments. And 4.5% of output failed quality checks. The expensive new equipment was delivering less than half its potential.
This capacity gap afflicts most manufacturers. Research shows average Overall Equipment Effectiveness (OEE) runs around 60%, meaning typical equipment produces only 60% of what it could if availability, performance, and quality were perfect. World-class manufacturers achieve 85% or higher. This 25-point gap represents enormous untapped capacity that OEE methodology helps capture.
Understanding Overall Equipment Effectiveness
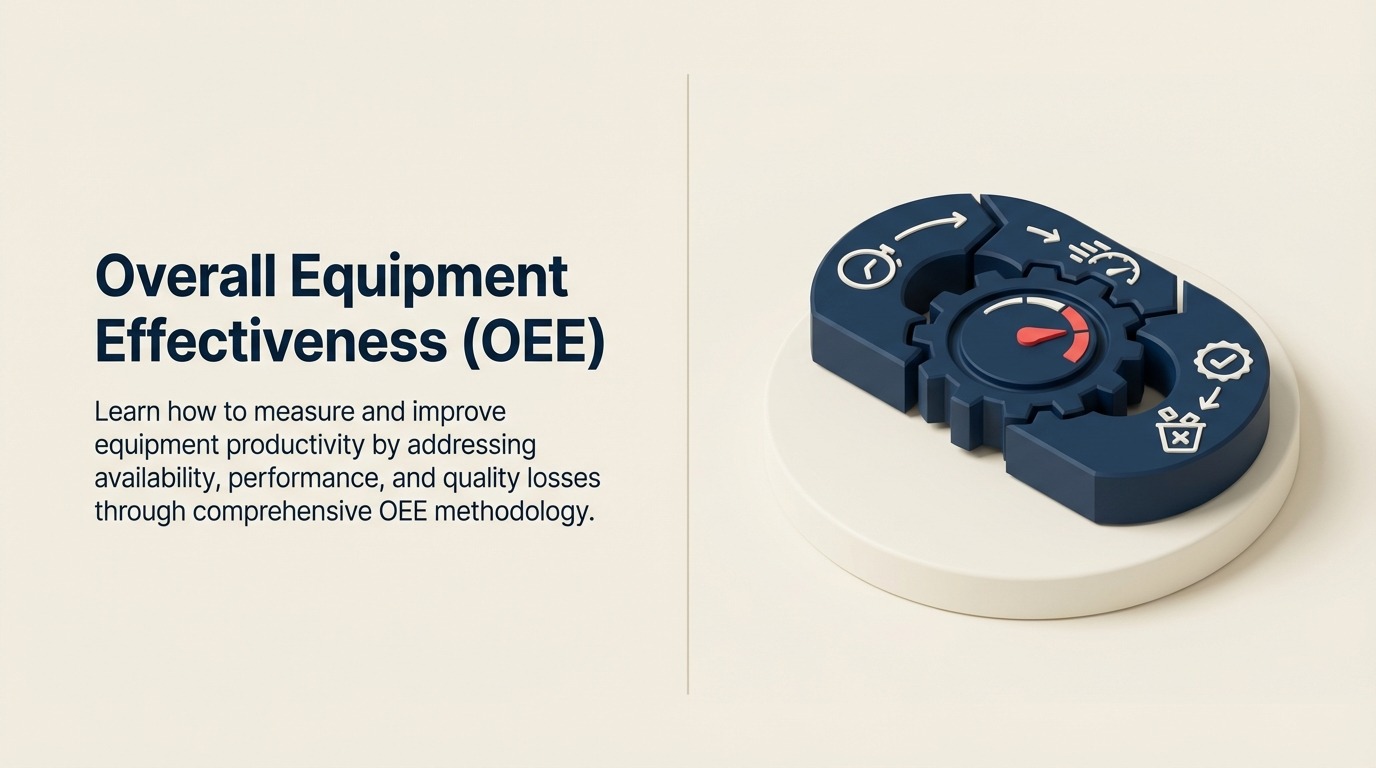
OEE (Overall Equipment Effectiveness) measures how effectively equipment converts available time into quality production by multiplying three components that each represent a different type of loss. According to OEE.com, OEE is the gold standard for measuring manufacturing productivity, and an OEE score of 100% means you are manufacturing only good parts, as fast as possible, with no stop time.
Availability measures what percentage of scheduled production time the equipment actually runs. It accounts for downtime from equipment failures, changeovers, material shortages, and any other events that stop production. Calculated as: (Operating Time / Planned Production Time) × 100.
If you schedule equipment to run 480 minutes but it experiences 45 minutes of downtime for breakdowns and changeovers, availability is 90.6% (435 / 480).
Performance measures how actual production speed compares to ideal speed when the equipment is running. It captures losses from minor stops, reduced speed, and any operation below design capacity. Calculated as: (Ideal Cycle Time × Total Pieces) / Operating Time × 100.
If a machine's ideal cycle time is 30 seconds per part and it produces 800 parts in 435 minutes (26,100 seconds), theoretical parts at ideal speed would be 870. Performance is 92% (800 / 870).
Quality measures what percentage of produced parts meet specifications. It accounts for defects, rework, and startup scrap. Calculated as: (Good Parts / Total Parts Produced) × 100.
If the machine produced 800 parts and 34 failed quality checks, quality rate is 95.8% (766 / 800).
OEE multiplies these three components: OEE = Availability × Performance × Quality = 0.906 × 0.92 × 0.958 = 79.9%
This manufacturer's equipment produced less than 80% of potential capacity. According to Wikipedia, an OEE of 100% means that only good parts are produced (100% quality), at the maximum speed (100% performance), and without interruption (100% availability). Each lost percentage point on equipment that cost $2.8 million represents wasted capital. Improving OEE directly captures additional capacity from existing assets without additional investment.
World-class benchmarks vary by industry but generally target:
- OEE: 85% or higher
- Availability: 90%+
- Performance: 95%+
- Quality: 99%+
These aren't theoretical ideals but standards leading manufacturers routinely achieve through disciplined improvement programs.
OEE versus other metrics provides more comprehensive insight than traditional measures. Simple utilization (running hours / available hours) doesn't account for speed losses or defects. Capacity utilization (actual output / design capacity) doesn't distinguish between availability and performance problems. OEE integrates all three loss types into a single meaningful measure, complementing broader manufacturing KPIs.
Measuring OEE: Data Collection and Calculation
Effective OEE measurement requires clear definitions, accurate data collection, and consistent calculations.
Defining planned production time establishes the baseline against which availability measures. This is time the equipment is scheduled to run, excluding planned maintenance shutdowns, holidays, and periods with no customer demand. Don't inflate planned time with periods you never intended the equipment to operate.
A plastics molding operation runs two shifts, five days weekly. Planned production time is 16 hours daily × 5 days = 80 hours weekly, minus one hour scheduled maintenance Wednesday evening = 79 hours planned production time.
Tracking downtime and categorizing losses requires capturing every production stoppage and understanding why it occurred. Distinguish between equipment failures (unplanned downtime), planned changeovers (planned downtime that still reduces availability), and external factors like material shortages or quality holds.
Detailed loss categorization enables targeted improvement. If 60% of downtime comes from one recurring failure mode, you know where to focus total productive maintenance efforts. If changeovers consume excessive time, you need SMED (Single-Minute Exchange of Dies) techniques.
Measuring cycle time and speed losses compares actual production rates against equipment design capability. This requires knowing the ideal cycle time: how fast should the equipment produce when running optimally?
Record actual pieces produced and actual running time (planned time minus downtime). Calculate actual cycle time: running time / pieces produced. Compare against ideal cycle time to identify the performance gap.
Speed losses often prove harder to spot than outright downtime. Equipment runs below rated speed due to worn components, suboptimal settings, operator caution to prevent jams, or minor stops that don't get logged as downtime. These small losses accumulate significantly.
Recording quality defects and scrap captures the third OEE component. Count both first-pass rejects and startup scrap during changeovers. Include rework if parts require additional processing beyond standard procedures.
Quality losses often concentrate at specific times: startup periods after changeovers, shift changes, material lot changeovers, or when running certain products. This pattern recognition guides improvement focus.
Manual versus automated data collection involves tradeoffs. Manual collection through operator log sheets costs less upfront but risks inaccuracy from incomplete entries, estimation, and gaps during busy periods. Operators may unconsciously underreport problems to avoid appearing responsible for losses.
Automated collection through sensors, machine controllers, and Manufacturing Execution Systems (MES) provides accurate, real-time data but requires infrastructure investment. Start with manual collection to learn OEE methodology and identify improvement priorities. Invest in automation for critical equipment where accurate data justifies the cost.
The Six Big Losses: Understanding What Reduces OEE
OEE losses fall into six categories that attack availability, performance, and quality. As OEE.com explains, the three OEE factors (Availability, Performance, and Quality) provide a consistent way to measure how effectively a manufacturing operation is utilized.
Availability Loss 1: Equipment Breakdowns - Unplanned stops from mechanical, electrical, or hydraulic failures. These typically create the most visible and costly downtime. A CNC machine spindle bearing failure might stop production for 6 hours while technicians replace it and recalibrate the machine.
Availability Loss 2: Setup and Changeover - Time required to switch between products, including cleaning, adjusting, and warming up equipment. A beverage filling line might need 90 minutes to changeover between product flavors, requiring thorough cleaning and adjustment verification.
Performance Loss 1: Minor Stops - Brief stoppages under 5 minutes that operators often clear without maintenance involvement. A packaging line might jam momentarily when labels misalign, requiring an operator to clear the jam and restart. These occur frequently, accumulating significant lost time despite brief duration.
Performance Loss 2: Reduced Speed - Operating below design capacity due to wear, improper settings, operator intervention, or quality concerns. An injection molding machine rated for 45-second cycles might run 52-second cycles because operators slow it down to prevent defects from worn tooling.
Quality Loss 1: Startup Defects - Scrap and rework produced during equipment warm-up or post-changeover adjustment. The first dozen parts after a changeover might be scrapped while operators fine-tune settings.
Quality Loss 2: Production Defects - Scrap and rework during normal operation from process variation, material issues, worn tooling, or operator error. These represent capacity consumed making unusable products. Effective scrap and rework reduction strategies address these losses.
Understanding which losses dominate your OEE enables targeted improvement. An automotive stamping press might suffer primarily from slow changeovers (availability loss 2). A high-speed assembly line might face minor stops (performance loss 1). A precision machining center might struggle with equipment reliability (availability loss 1).
Improvement Strategies for Each OEE Component
Different loss types require different improvement approaches.
Improving availability through maintenance addresses both breakdown and changeover losses. Total Productive Maintenance (TPM) reduces unplanned downtime through preventive maintenance schedules, operator-led daily inspection, predictive monitoring of critical components, and systematic problem-solving for recurring failures.
An injection molding operation implemented TPM systematically. They established preventive maintenance schedules based on equipment OEM recommendations and their own failure history. They trained operators to perform daily inspections and cleaning. They installed vibration sensors on critical motors and hydraulic pumps for predictive maintenance. Over 18 months, unplanned downtime dropped 64%.
Single-Minute Exchange of Dies (SMED) techniques reduce changeover time. Distinguish internal activities (must occur while equipment is stopped) from external activities (can occur while running). Move everything possible to external. Streamline what must remain internal through practice, improved tooling, standardized procedures, and mistake-proofing.
A pharmaceutical packaging line reduced changeover from 3.5 hours to 42 minutes through SMED. They pre-staged all materials and tools before stopping equipment. They redesigned mounting systems for tool-less, single-motion adjustments. They created detailed visual procedures showing exact adjustment positions. They practiced changeovers monthly to maintain proficiency.
Enhancing performance through optimization tackles minor stops and speed losses. Root cause analysis methods identify why minor stops occur: misaligned sensors, worn guides, improper lubrication, material variation. Address underlying causes rather than accepting stops as normal.
Process optimization restores design speed. Clean and calibrate equipment. Replace worn components. Verify optimal operating parameters. Ensure material quality meets specifications. Train operators on proper operation and adjustment techniques.
A packaging line suffered frequent minor stops from label jams. Investigation revealed humidity variation caused label adhesive to become tacky, making labels stick together. Adding climate control to the label storage area eliminated 78% of minor stops.
Increasing quality through prevention requires identifying defect root causes and implementing countermeasures. Use statistical process control to detect process drift before defects occur. Implement mistake-proofing (poka-yoke) devices that prevent errors. Ensure measurement systems are accurate and capable. Comprehensive defect prevention strategies support quality improvements.
Address startup defects by creating standardized changeover procedures that include verification steps ensuring quality before full production begins. Develop adjustment guides showing exact settings for each product. Some operations produce first articles at reduced speed for inspection before ramping to full rate.
OEE Program Implementation Roadmap
Systematic OEE implementation maximizes results while building organizational capability.
Select pilot equipment based on several criteria: equipment that creates bottlenecks where additional capacity delivers immediate value, machines with significant suspected losses offering improvement potential, areas with supportive supervision and engaged operators, equipment where you can easily measure all three OEE components.
Avoid starting with your most problematic equipment. That approach overwhelms teams with difficult problems before they've developed improvement skills. Start with moderate challenges that offer clear improvement opportunities.
Establish baseline measurements by collecting three months of data. This reveals typical performance levels, identifies main loss categories, establishes patterns (does OEE vary by shift, day of week, product type?), and creates benchmarks for measuring improvement.
Be honest about baselines. Don't manipulate definitions to inflate initial OEE, which only undermines later improvement claims. Accurate baselines enable credible improvement tracking.
Set improvement targets that are challenging but achievable. Jumping from 65% to 85% OEE in one quarter is unrealistic. Target 5-10 point improvements annually as capabilities develop. Break overall OEE targets into component targets: improve availability from 85% to 89%, performance from 78% to 83%, quality from 96% to 98%.
Create action plans by loss category assigns accountability for addressing each major loss type. Breakdown losses might become maintenance department priorities. Changeover improvements might involve engineering and production jointly. Quality losses typically engage quality and manufacturing engineering.
Document specific improvement projects: what, who, when, expected impact. Review progress weekly. Celebrate achieved improvements. Adjust plans based on learning.
Scale across the plant after pilot success demonstrates methodology and builds credibility. Prioritize expansion to other bottleneck equipment or similar machine types where lessons from pilots directly transfer. Train additional teams on OEE measurement and improvement techniques. Share best practices and tools across equipment.
Most manufacturers take 2-3 years to fully deploy OEE programs across facilities, progressively expanding as capabilities mature.
OEE as Continuous Improvement Driver
OEE's greatest value extends beyond measuring equipment effectiveness. It becomes a framework for kaizen continuous improvement that exposes problems and drives systematic problem-solving.
When availability drops, investigation reveals specific breakdown or changeover issues to address. When performance declines, it signals process drift requiring correction. When quality deteriorates, it triggers root cause analysis. This makes OEE a leading indicator that prompts action before problems compound.
Displaying OEE data visibly on production floors enables real-time management. Digital displays showing current OEE and component scores let operators and supervisors spot problems immediately. Trend charts reveal patterns needing attention. Target lines make expectations clear. This visual management connects to 5S workplace organization principles.
The discipline of OEE measurement (defining planned time, categorizing losses, analyzing trends) builds analytical capabilities that extend beyond equipment effectiveness to broader operational excellence. Understanding lean manufacturing principles helps contextualize OEE within comprehensive improvement strategies.
Manufacturers serious about maximizing asset productivity make OEE a cornerstone metric reviewed daily by production teams and weekly by leadership. They invest in data collection infrastructure, train teams on interpretation and improvement, and hold people accountable for results. This sustained focus converts modest initial improvements into world-class performance over time.
Learn More

Founder & CEO