Site Speed & Performance: The Hidden Conversion Driver in E-commerce
 The relationship between site speed and conversion rates is direct, measurable, and often underestimated. Amazon found that every 100 milliseconds of latency cost them 1% in sales. Walmart discovered that for every 1 second improvement in page load time, conversions increased by 2%. Google research shows that as page load time goes from 1 second to 3 seconds, bounce probability increases 32%. From 1 second to 5 seconds, it jumps 90%.
Turn this article into takeaways for your work.
Each assistant summarizes the article only for you and suggests best practices for your work.
For e-commerce businesses, these stats translate to real revenue. A store generating $1 million annually with a 3-second average page load time could potentially increase revenue by $60,000-$100,000 by reducing load time to 2 seconds. The same improvement for a $10 million store represents $600,000-$1,000,000 in incremental revenue from performance optimization alone, without changing products, pricing, or marketing.
Yet site performance remains neglected at many e-commerce operations. Teams obsess over design aesthetics, add feature after feature, integrate multiple third-party tools, and install comprehensive analytics. All while page load times creep upward and conversion rates decline. The irony is stark: the very tools meant to improve conversion (personalization engines, recommendation systems, behavior tracking) often harm it through performance degradation.
This creates substantial opportunity. While competitors accept slow load times as the inevitable cost of feature-rich sites, performance-focused operations achieve both functionality and speed through systematic optimization. The technical frameworks for performance improvement are well-established and accessible, the primary barrier is prioritization and discipline.
Why Site Speed Matters for E-commerce
Site performance impacts every aspect of e-commerce success, from immediate conversion rates to long-term SEO rankings. Conversion rate correlation is the most direct business impact. Research across thousands of e-commerce sites shows clear patterns: 0-2 second load times achieve optimal conversion rates, 2-3 seconds show measurable decline (typically 10-15% lower conversion), 3-5 seconds experience significant impact (30-50% lower conversion), 5+ seconds face severe conversion loss (50-70% lower than optimal). Site speed functions as a foundational element of conversion rate optimization, impacting every other optimization effort.
The mechanism is psychological and practical. Slow sites create frustration, signal poor quality, and compete for attention against countless distractions. Each additional second of waiting gives customers more opportunity to abandon, reconsider, or get distracted. The impulse that drove the initial site visit dissipates while waiting for pages to load.
Google Core Web Vitals and ranking connect performance directly to organic search visibility. Google's search algorithm explicitly incorporates Core Web Vitals as ranking factors since 2021. Sites with poor Core Web Vitals scores may rank lower than competitors with better performance, even with otherwise similar SEO optimization.
The search visibility impact compounds over time. Lower rankings mean less traffic, which means fewer conversions and less revenue. Performance optimization thus serves dual purposes: direct conversion improvement for existing traffic plus increased traffic through improved rankings. This makes site speed a critical component of any comprehensive e-commerce SEO strategy and traffic acquisition strategy.
Mobile commerce considerations magnify performance importance. Mobile devices typically have less powerful processors, slower network connections, and more constrained bandwidth than desktop. A site that loads acceptably on desktop may be painfully slow on mobile. Since mobile makes up 60-70% of e-commerce traffic, mobile performance largely determines overall business performance. Effective mobile commerce optimization requires treating mobile performance as a primary design constraint, not an afterthought.
Mobile users also exhibit less patience than desktop users, they're often browsing in distracted environments, on-the-go, looking for quick information. Slow mobile experiences face even higher abandonment rates than slow desktop experiences.
Bounce rate reduction correlates strongly with performance. Bounce rate (percentage of single-page sessions where users leave without interaction) increases dramatically with load time. A 1-second page loads sees roughly 25% bounce rate. A 3-second page sees 40-50%. A 5-second page exceeds 60%. Improving these metrics requires comprehensive checkout flow optimization that maintains fast performance throughout the purchase journey.
High bounce rates harm multiple business metrics: reduced conversion opportunities, negative SEO signals (Google interprets high bounce rates as poor user experience), lower pages per session, reduced time on site, and decreased chance of repeat visits.
Core Web Vitals Explained
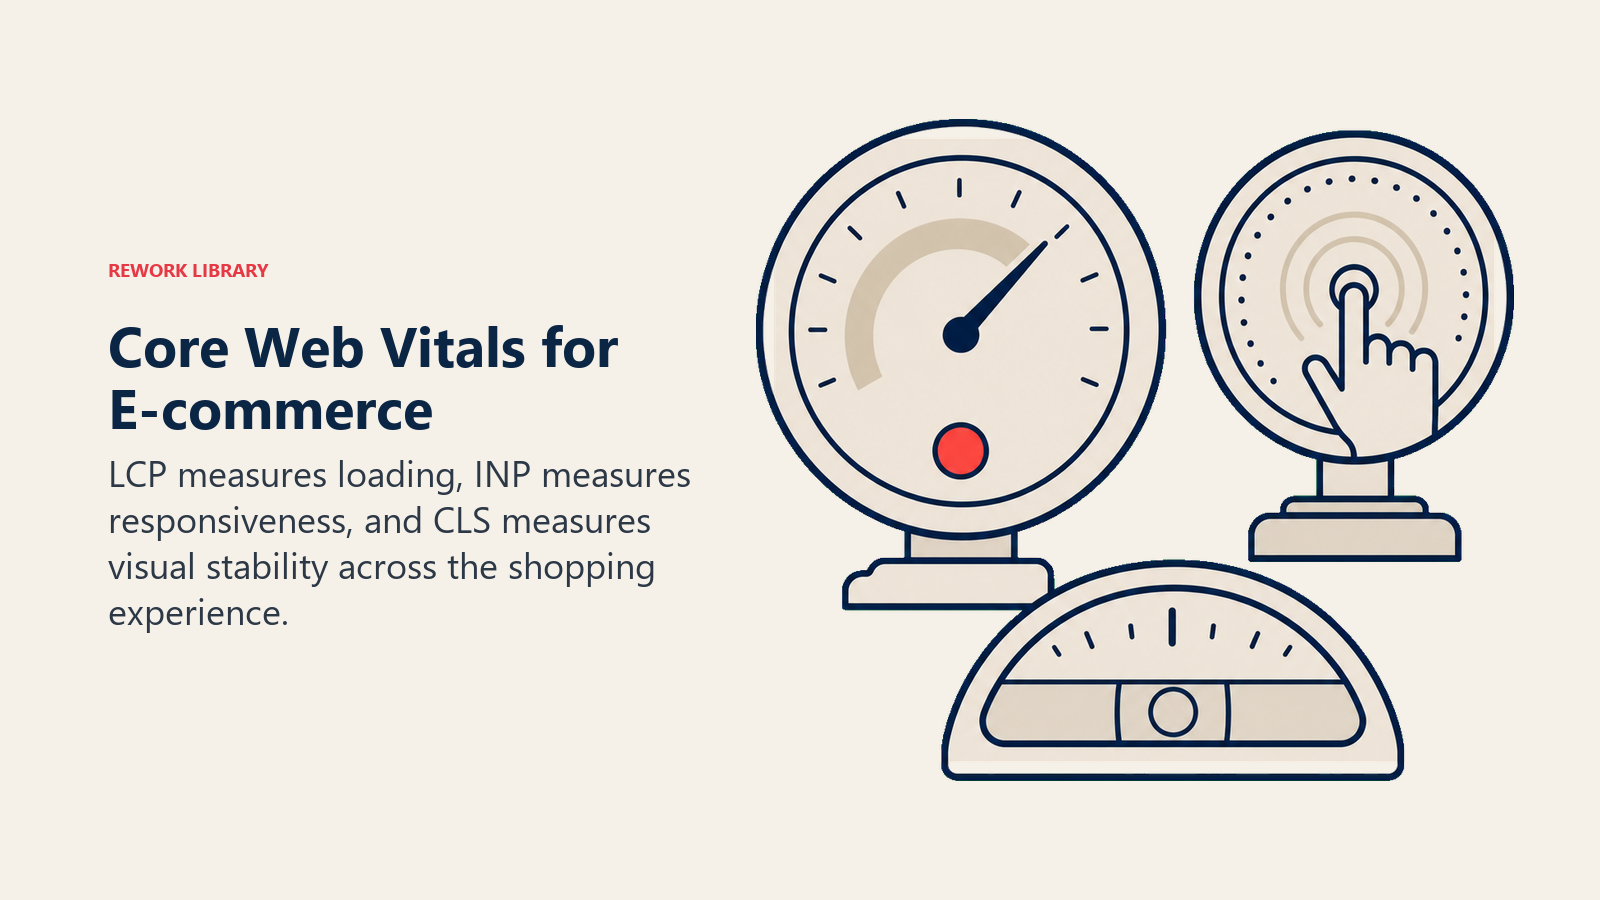
Google's Core Web Vitals provide standardized metrics for measuring and optimizing user experience performance. Largest Contentful Paint (LCP) measures loading performance, specifically the time until the largest content element in the viewport becomes visible. This might be a hero image, product image, text block, or video. LCP shows when the page becomes meaningfully useful, when customers can see primary content.
Target thresholds: Good (under 2.5 seconds), Needs Improvement (2.5-4 seconds), Poor (over 4 seconds). E-commerce sites should target under 2 seconds for optimal conversion.
Common LCP issues: Large, unoptimized images, render-blocking JavaScript and CSS, slow server response times, client-side rendering delays. Product pages often struggle with LCP because large product images are the largest content element. Optimizing product page optimization specifically for LCP performance can significantly improve conversion rates.
First Input Delay (FID) / Interaction to Next Paint (INP) measures interactivity and responsiveness. FID tracks the delay between a user's first interaction (clicking add-to-cart, tapping a menu) and when the browser responds. INP (the newer metric replacing FID) measures responsiveness across all interactions throughout page lifecycle.
Target thresholds for FID: Good (under 100ms), Needs Improvement (100-300ms), Poor (over 300ms). For INP: Good (under 200ms), Needs Improvement (200-500ms), Poor (over 500ms).
Common FID/INP issues: Heavy JavaScript execution blocking main thread, long tasks preventing interaction response, excessive third-party scripts, unoptimized event handlers. E-commerce sites with extensive personalization, recommendation engines, and analytics often struggle with interactivity metrics.
Cumulative Layout Shift (CLS) measures visual stability, how much visible content unexpectedly shifts during loading. Unexpected shifts frustrate users: clicking a button as content shifts causes clicking the wrong element, reading product descriptions that jump around creates annoyance, layout instability signals poor quality.
Target thresholds: Good (under 0.1), Needs Improvement (0.1-0.25), Poor (over 0.25).
Common CLS issues: Images or videos without dimensions, ads or embeds inserting above existing content, fonts causing layout shift when loading, dynamically injected content shifting page layout. E-commerce sites with image-heavy product pages, advertising, and dynamic content recommendations frequently encounter CLS challenges.
Measurement tools for Core Web Vitals include field data (real user measurements from Chrome User Experience Report), lab data (synthetic testing from tools like Lighthouse, PageSpeed Insights), and real user monitoring (RUM tools tracking actual visitor experiences).
Field data represents reality, how your actual customers experience your site. Lab data provides controlled testing for optimization and comparison. Both matter, but field data determines actual business impact.
Image Optimization Strategy
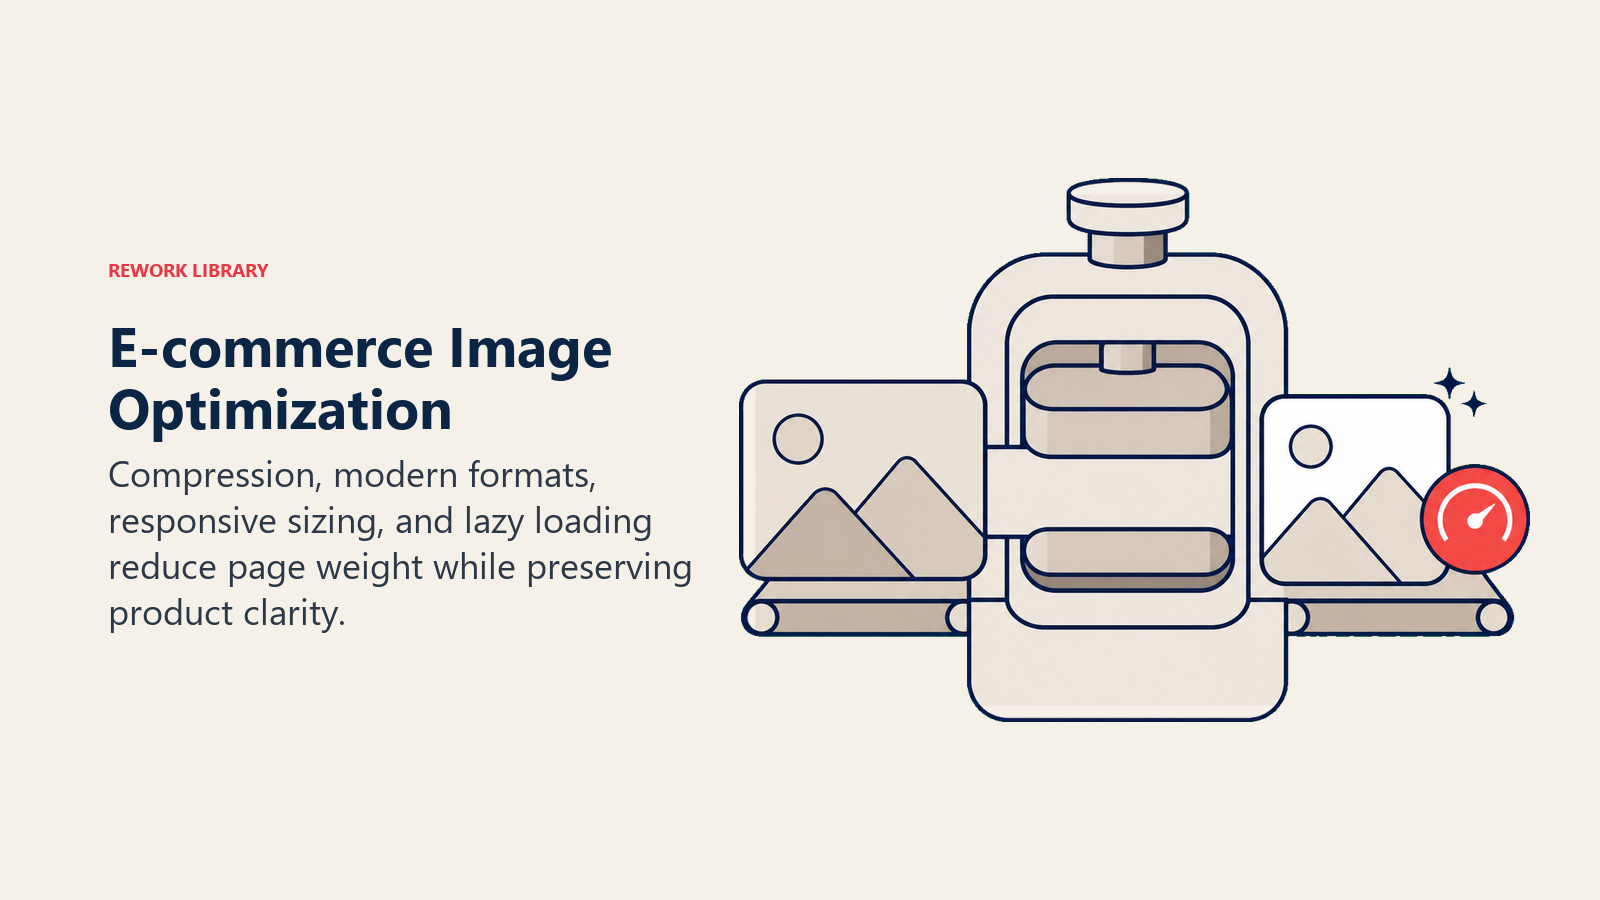
Images typically represent 50-70% of total page weight, making image optimization the highest-impact performance improvement for most e-commerce sites. Image compression reduces file sizes while maintaining visual quality. Lossy compression (JPEG, WebP) removes some image data, lossless compression (PNG optimization) reorganizes data without quality loss.
For product photography, 80-85% JPEG quality provides excellent visual results at significantly smaller file sizes than 100% quality. The quality difference is imperceptible to most viewers, but file size differences are substantial (often 40-60% reduction). Starting with high-quality product photography and video ensures optimal results after compression.
Tools: ImageOptim, TinyPNG, Squoosh, Cloudinary, Imgix. Most modern image CDNs include automatic compression. E-commerce platforms like Shopify provide automatic image optimization, but custom implementations often require manual tool usage or integration.
Modern formats (WebP, AVIF) deliver superior compression compared to traditional JPEG and PNG. WebP provides 25-35% smaller file sizes than JPEG at equivalent quality. AVIF achieves even better compression (40-50% smaller than JPEG) with excellent quality preservation.
Browser support: WebP enjoys near-universal support (95%+ browsers). AVIF support is growing (70-80% of browsers) but requires fallbacks for older browsers.
Implementation: Use <picture> elements with format fallbacks:
<picture>
  <source srcset="product.avif" type="image/avif">
  <source srcset="product.webp" type="image/webp">
  <img src="product.jpg" alt="Product Name">
</picture>
This serves AVIF to supporting browsers, WebP to browsers that support it but not AVIF, and JPEG to older browsers.
Lazy loading defers loading images until they're needed (near viewport), dramatically improving initial page load.
Native lazy loading through loading="lazy" attribute provides browser-built implementation:
<img src="product.jpg" loading="lazy" alt="Product">
Lazy load all images below the fold (not visible in initial viewport). Don't lazy load above-fold images, this delays LCP and harms user experience.
For product listing pages with dozens or hundreds of images, lazy loading provides massive initial load time improvements. Only images in or near the viewport load initially, with additional images loading as users scroll.
Responsive image sizing serves appropriately-sized images based on device screens. Sending 2400px product images to 375px mobile screens wastes bandwidth and slows loading.
Use srcset attribute to define multiple image sizes:
<img
  srcset="product-400.jpg 400w,
          product-800.jpg 800w,
          product-1200.jpg 1200w,
          product-2400.jpg 2400w"
  sizes="(max-width: 600px) 400px,
         (max-width: 1200px) 800px,
         1200px"
  src="product-800.jpg"
  alt="Product">
Browsers select appropriate image size based on device characteristics and viewport width, downloading only necessary pixels.
CDN distribution delivers images from geographically distributed servers closest to users, reducing latency and improving load times. CDNs also provide image optimization, automatic format selection, and responsive image generation.
Major image CDNs: Cloudflare Images, Cloudinary, Imgix, AWS CloudFront with Lambda@Edge, Fastly Image Optimizer. E-commerce platform built-in CDNs (Shopify CDN, BigCommerce CDN) provide automatic distribution. Your choice of e-commerce platform selection should consider built-in performance optimization capabilities including CDN integration.
Caching Architecture
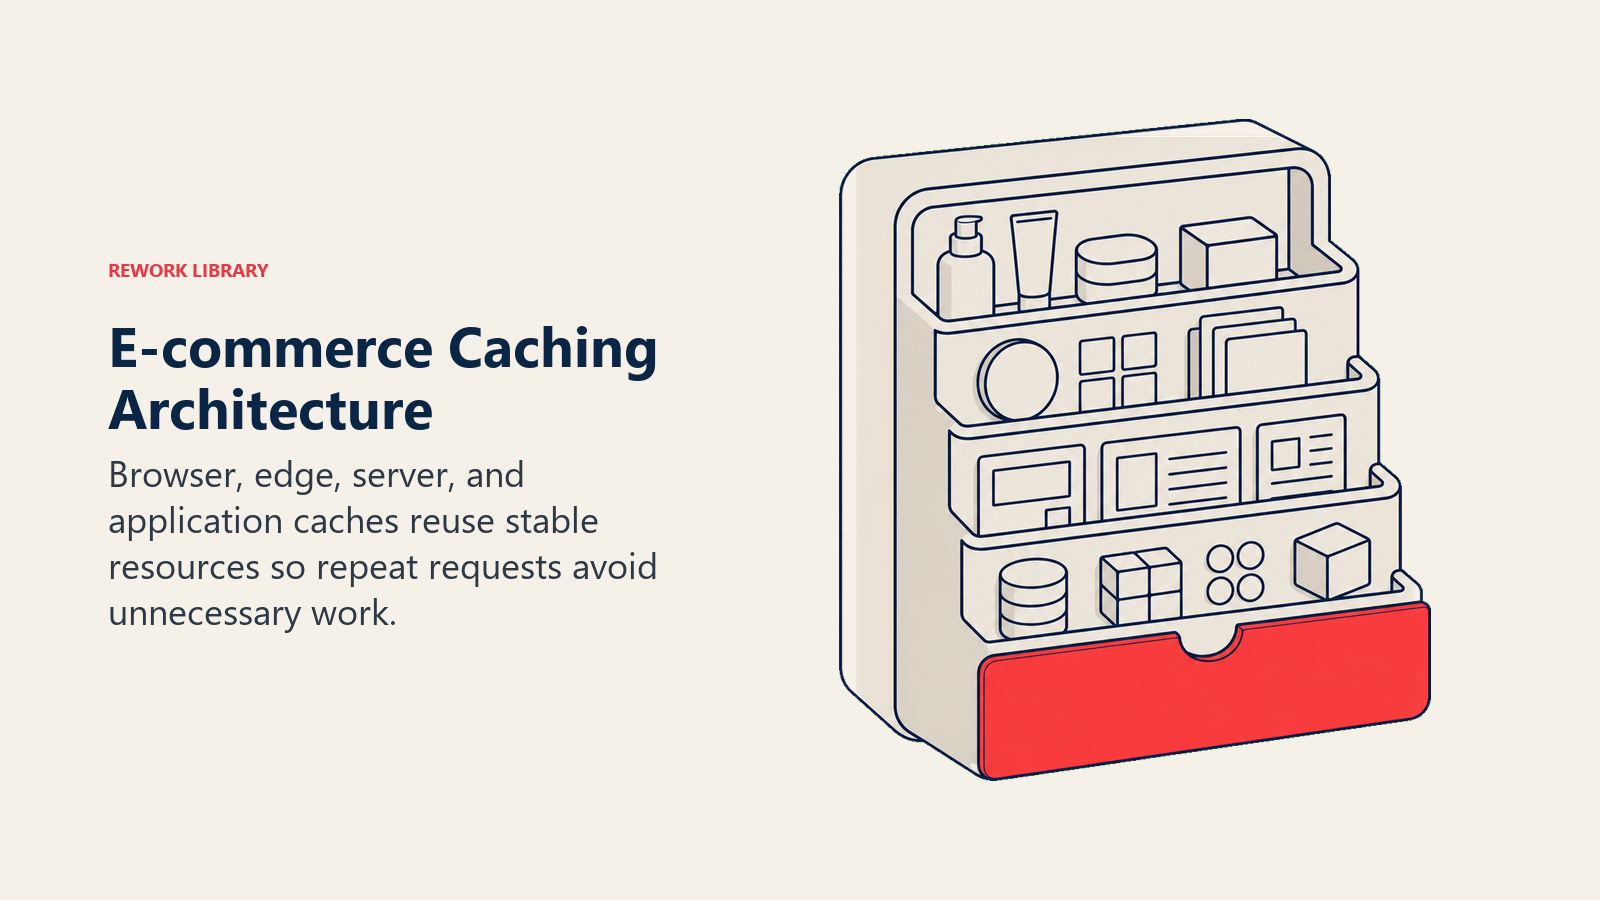
Caching stores frequently accessed data for fast retrieval, reducing server processing and database queries. Browser caching stores resources (images, CSS, JavaScript) in user browsers for specified durations, enabling instant loading on repeat visits.
Set appropriate cache headers:
Cache-Control: public, max-age=31536000  # 1 year for versioned static assets
Cache-Control: public, max-age=3600      # 1 hour for product images
Cache-Control: no-cache                   # For HTML pages requiring freshness
Static assets with version identifiers (styles.v2.css, script-abc123.js) can use very long cache times since file names change when content updates. Product images can cache for hours or days. HTML pages typically require freshness checks to ensure customers see current inventory, prices, and content.
Server-side caching stores rendered page fragments, database query results, or complete pages for fast delivery without regeneration.
Page caching: Store complete rendered HTML for fast delivery. Works well for static pages (about, help, policies) and product listing pages that don't change frequently. Requires cache invalidation when content updates.
Fragment caching: Store rendered components (product cards, navigation, footer) for reuse across pages. Particularly effective for elements that appear on multiple pages but don't change often.
Redis and in-memory caching provides extremely fast data retrieval by storing frequently accessed data in RAM rather than disk-based databases.
Common caching patterns for e-commerce: Product data (descriptions, prices, specifications), category information, navigation structures, customer session data, shopping cart contents, inventory counts (with short TTL to prevent overselling).
Implementation: Use Redis or Memcached as caching layer in front of primary database. Application code checks cache first, queries database only on cache misses, then stores results in cache for future requests.
Cache invalidation patterns ensure customers see current information despite caching.
Time-based expiration: Set cache TTL (time to live) appropriate for content volatility. Product descriptions might cache for hours, pricing for minutes, inventory for seconds.
Event-based invalidation: Clear cache when underlying data changes. Product price update triggers cache clear for that product. This ensures immediate visibility of changes while maximizing cache hit rates.
The challenge: cache invalidation is notoriously difficult to get right. Too aggressive invalidation negates caching benefits. Too conservative invalidation shows stale data to customers. Balance requires understanding your specific data volatility and business requirements.
Content Delivery Network (CDN)
CDNs distribute content across geographically dispersed servers, serving customers from nearby locations for reduced latency. How CDNs work involves caching content at edge locations worldwide. When a customer in London requests a page, the CDN serves cached content from a nearby European edge server rather than routing requests to origin servers in the US. This reduces round-trip time dramatically (20-50ms versus 150-200ms).
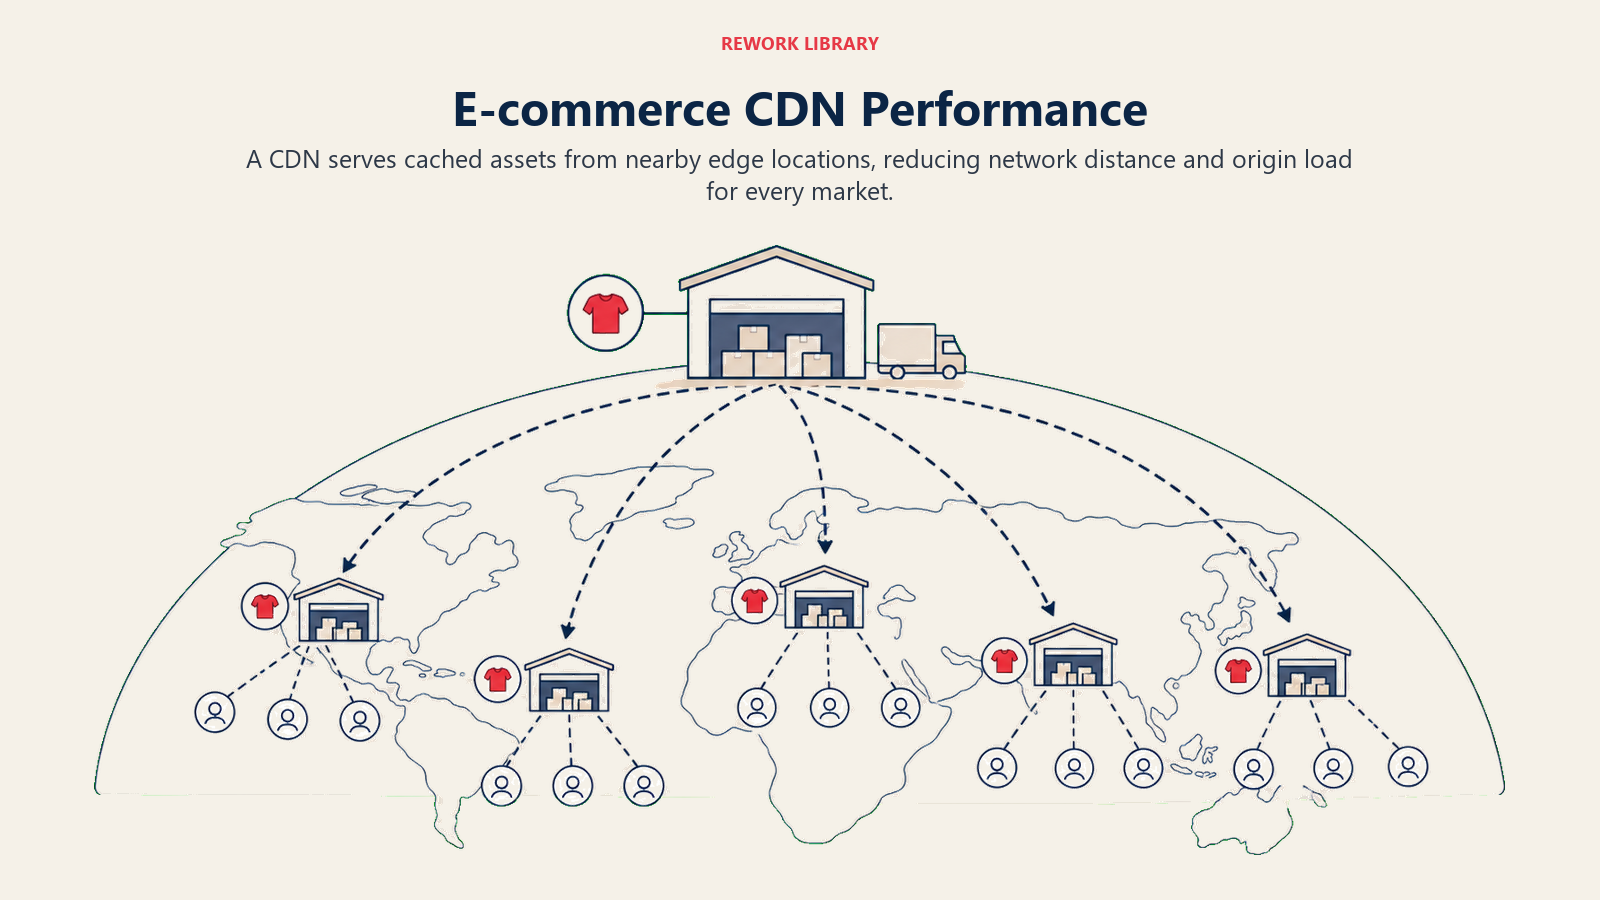
When to implement: Immediately for any e-commerce operation serving customers beyond single geographic region. CDN benefits apply even for national stores (US-only stores benefit from edge servers in different regions). International operations see massive improvements from CDN implementation.
The cost-benefit strongly favors CDN adoption. Major CDNs (Cloudflare, Fastly, AWS CloudFront) offer affordable plans starting at $20-50/month. The conversion improvement from faster global delivery typically justifies costs within days.
Edge caching for dynamic content extends CDN benefits beyond static assets to personalized, dynamic pages. Modern CDNs support edge workers (Cloudflare Workers, Fastly Compute@Edge, AWS Lambda@Edge) that run code at edge locations, enabling personalization without origin server round-trips. This represents a key advantage of headless commerce architectures that separate frontend delivery from backend services.
This architecture delivers personalized experiences at edge server speeds rather than origin server speeds, providing both performance and personalization.
Geographic distribution strategy prioritizes CDN coverage based on customer distribution. Analyze traffic by geography to understand where customers are located. Ensure CDN has strong edge server presence in high-traffic regions.
For global e-commerce, choose CDNs with extensive worldwide coverage. For regional operations, prioritize CDNs with deep edge server density in your target regions.
Failover and redundancy protect against CDN outages (rare but possible). Configure origin server as automatic failback when CDN fails. Use multi-CDN strategies for critical operations requiring maximum uptime.
Database Performance Optimization
Database queries represent significant performance bottlenecks for dynamic e-commerce sites, particularly during traffic spikes.
Query optimization improves individual query performance through better SQL structure and execution plans.
Common optimization techniques: Select only needed columns (avoid SELECT *), use specific WHERE clauses to limit result sets, avoid N+1 query problems (loading related data in loops), use JOINs efficiently, leverage covering indexes.
E-commerce query hotspots: Product searches, category page generation, shopping cart retrieval, customer order history, inventory checks. Profile these queries to identify slow performers requiring optimization.
Strategic database indexing dramatically improves query performance by creating data structures enabling fast lookups.
Index columns used in WHERE clauses, JOIN conditions, and ORDER BY operations. Product table indexes typically include: product_id (primary key), category_id (for category filtering), sku (for inventory lookups), price (for price sorting), stock_status (for availability filtering).
The tradeoff: indexes speed reads but slow writes (inserts, updates, deletes). For read-heavy e-commerce (typical pattern, many views per purchase), this tradeoff strongly favors indexing.
Query result caching stores frequent query results for fast retrieval without re-execution.
Category page queries (product listings for specific categories) are excellent caching candidates, they're accessed frequently but change relatively slowly. Cache results with 5-15 minute TTL, invalidate on product updates.
Product search queries can be cached with shorter TTL (1-5 minutes) since inventory and pricing change more rapidly.
Database scaling approaches address growing data volumes and traffic.
Vertical scaling: Increase database server resources (CPU, RAM, storage). Simplest approach but eventually hits limits.
Read replicas: Create read-only database copies for query distribution. Application sends reads to replicas, writes to primary. This scales read capacity (the primary e-commerce pattern) while maintaining single source of truth.
Sharding: Distribute data across multiple databases based on partitioning logic (customer ID, product category, geographic region). Complex but necessary for massive scale.
Code and Asset Minification
JavaScript and CSS file sizes directly impact load times. Minification and optimization reduce these sizes significantly.
CSS and JavaScript minification removes whitespace, comments, and unnecessary characters, reducing file sizes by 30-60% without changing functionality.
Before minification (readable for development):
function calculateTotal(items) {
  let total = 0;
  for (let item of items) {
    total += item.price * item.quantity;
  }
  return total;
}
After minification (optimized for production):
function calculateTotal(t){let e=0;for(let a of t)e+=a.price*a.quantity;return e}
Build tools (Webpack, Rollup, Parcel) include automatic minification for production builds. E-commerce platforms may provide automatic minification, but custom implementations require build process configuration.
Code splitting divides JavaScript into smaller chunks loaded on-demand rather than bundling everything into single large files.
Route-based splitting loads JavaScript for specific pages only when those pages are accessed. Product page code loads only on product pages, checkout code loads only during checkout. This reduces initial bundle size significantly.
Component-based splitting loads complex components only when needed. A product recommendation widget loads its JavaScript only when the widget appears, not immediately on page load.
Bundle size analysis identifies optimization opportunities through visualization of what's included in JavaScript bundles.
Tools: webpack-bundle-analyzer, source-map-explorer. These tools show which packages contribute most to bundle size, enabling targeted optimization.
Common bloat sources: Unused dependencies included in bundles, multiple versions of same library, large utility libraries when only small portions are used (importing all of Lodash when only using 2 functions).
Unnecessary code removal eliminates unused JavaScript and CSS from production bundles.
Tree shaking removes unused exports from bundled modules. If you import one function from a utility library, tree shaking includes only that function rather than the entire library.
CSS purging (PurgeCSS, UnCSS) removes unused CSS selectors. E-commerce themes often include CSS for hundreds of selectors never used. Purging reduces CSS file sizes by 80-90%.
Server-Side Performance
Backend infrastructure performance affects page generation speed and API response times.
Server response time optimization targets Time to First Byte (TTFB), the duration between browser request and receiving first byte of response. Target TTFB under 200ms. Over 500ms indicates serious server performance issues.
Common TTFB problems: Slow database queries (see database optimization), insufficient server resources (CPU, RAM), inefficient application code, lack of caching, slow DNS resolution.
Load balancing distributes traffic across multiple servers, preventing individual server overload and providing redundancy.
Simple load balancing: Round-robin distribution sends requests to servers sequentially. More sophisticated approaches consider server load, response times, and server health.
Cloud platforms (AWS, Google Cloud, Azure) provide managed load balancing. For smaller operations, reverse proxies (Nginx, HAProxy) enable load balancing with minimal infrastructure.
API response optimization improves performance of internal and external API calls.
Optimize API query efficiency, implement API result caching, use API pagination to avoid returning massive result sets, implement GraphQL for flexible querying reducing over-fetching.
For third-party API dependencies (payment processing, shipping rates, tax calculation), implement aggressive caching, failover strategies, and async processing where possible to prevent external API slowness from blocking page rendering.
Background job processing moves time-intensive tasks off main request cycle.
Examples: Order confirmation emails, inventory synchronization, analytics processing, report generation, image processing. These tasks don't need to block customer-facing requests.
Implementation: Job queues (Sidekiq, Bull, Hangfire) process background tasks asynchronously. Customer receives immediate response while background jobs complete separately.
Performance Monitoring and Analytics
Continuous performance monitoring identifies issues and measures optimization impact. Real User Monitoring (RUM) versus synthetic monitoring provide complementary performance insights.
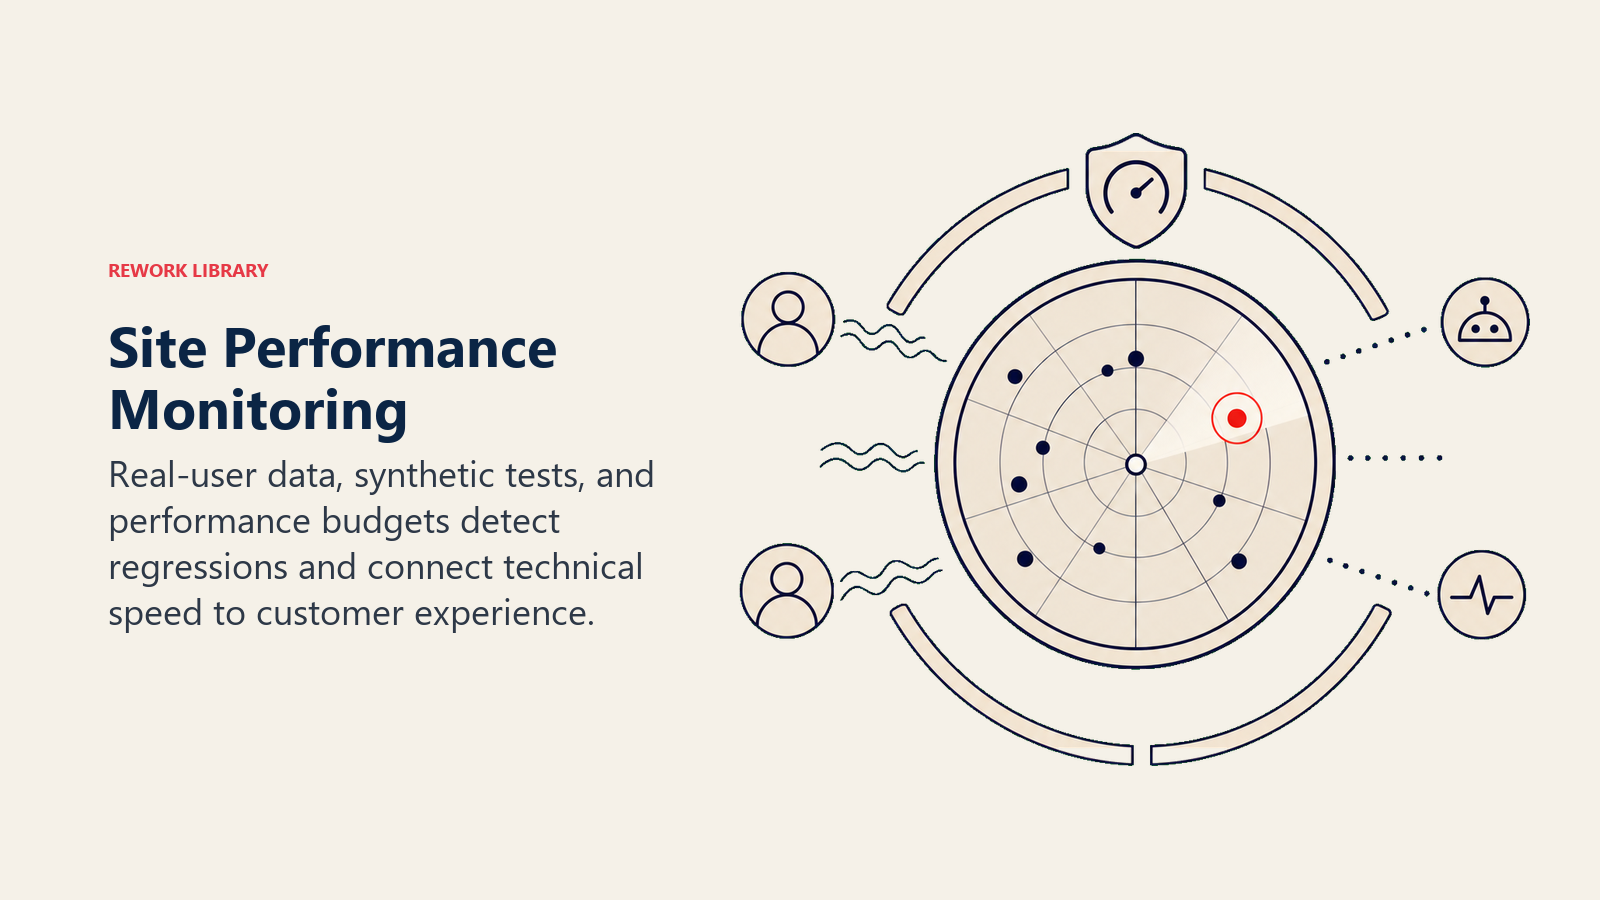
RUM tracks actual user experiences from real visitors using your site. Data reflects real-world conditions: actual devices, actual connection speeds, actual geographic distribution. RUM shows performance as customers experience it.
Synthetic monitoring uses automated scripts to test site performance from specific locations and configurations. Provides consistent baseline, enables testing before issues affect real users, allows comparison across competitors.
Both matter: RUM shows reality, synthetic monitoring enables proactive optimization and controlled testing.
Performance budget setting establishes performance targets preventing regression.
Example performance budget: Total page size under 1.5MB, JavaScript bundle under 300KB, CSS under 150KB, LCP under 2.5 seconds, FID under 100ms, CLS under 0.1.
Enforce budgets through build processes that fail when budgets are exceeded. This prevents well-meaning developers from gradually degrading performance through incremental additions.
Metrics dashboards and alerting provide visibility into performance trends and immediate notification of issues. Proper analytics and tracking setup ensures you capture the performance data needed for informed optimization decisions.
Track over time: Core Web Vitals trends, page load time by page type, performance by device type, performance by geographic region, performance by traffic source.
Configure alerts for: Performance degradation (LCP increases above threshold), sudden traffic spikes affecting performance, server errors increasing, third-party service failures.
Performance testing tools include multiple options for different use cases:
Google PageSpeed Insights: Free, simple, provides Core Web Vitals scores and optimization suggestions. Best for quick checks and non-technical stakeholders.
Lighthouse: Comprehensive auditing tool, available in Chrome DevTools. Provides detailed performance analysis, accessibility checks, SEO recommendations.
WebPageTest: Advanced testing with waterfall charts, filmstrip views, detailed request analysis. Best for technical deep-dives.
Real User Monitoring tools: Google Analytics (basic RUM), SpeedCurve, Calibre, New Relic Browser. Track real visitor performance continuously.
Mobile Performance
Mobile performance requires specific attention due to device constraints and usage patterns.
Mobile-specific optimization techniques address mobile device limitations.
Touch-optimized interactions respond quickly to taps (target under 100ms). Minimize JavaScript processing during scrolling for smooth performance. Reduce animation complexity on less powerful mobile processors. Implement virtual scrolling for long product lists.
Progressive Web Apps (PWA) provide app-like experiences through web technologies.
PWA features: Offline functionality through service workers, home screen installation, push notifications, fast loading through aggressive caching, app-like navigation.
PWA benefits for e-commerce: Instant loading on repeat visits, offline product browsing (cached content), reduced friction compared to app downloads, improved mobile conversion rates.
Accelerated Mobile Pages (AMP) represent Google's framework for fast-loading mobile pages.
AMP relevance for e-commerce has declined, Google removed AMP search result preferences in 2021. Core Web Vitals now matter more than AMP implementation. Focus optimization effort on Core Web Vitals rather than AMP conversion unless you have specific technical reasons.
Touch interaction optimization ensures responsive, smooth mobile interactions.
Use CSS transforms and opacity for animations (GPU-accelerated, smoother). Avoid layout-triggering CSS changes during interactions. Implement passive event listeners for scroll and touch events. Debounce expensive operations during scrolling.
Conversion Impact Testing
Performance optimization should be measured by business impact, not just technical metrics. A/B testing speed improvements quantifies actual conversion impact from performance optimization.
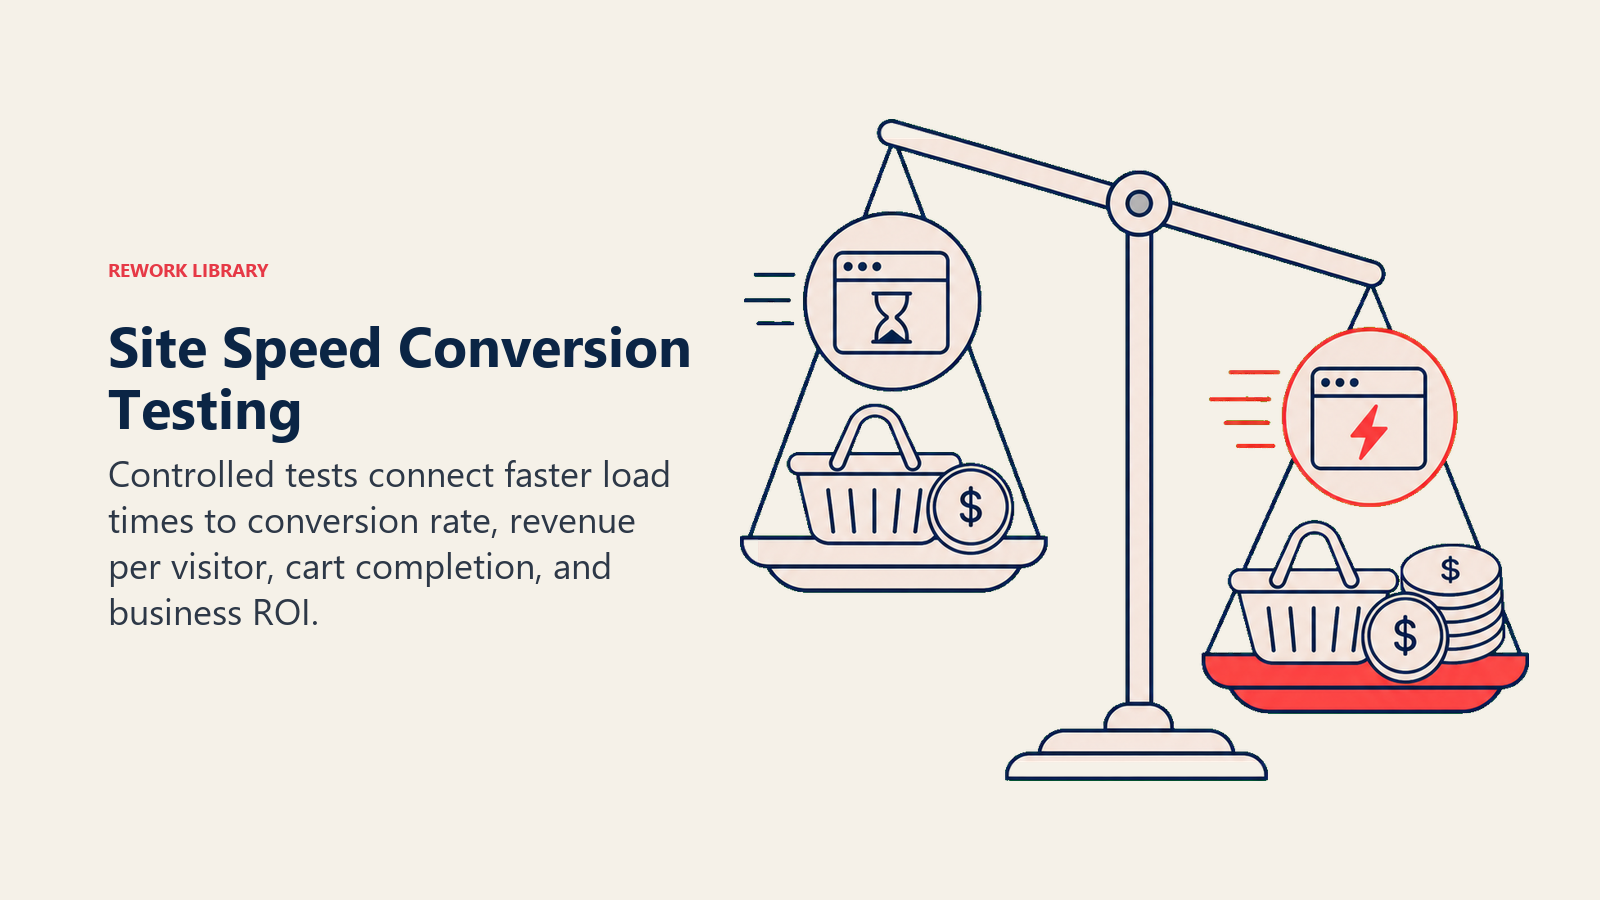
Test setup: Create variant with performance improvements, split traffic between control and variant, measure conversion rate differences, calculate revenue impact.
This data-driven approach proves ROI from performance investment and guides optimization priorities toward highest-impact improvements.
Revenue attribution models connect performance improvements to business outcomes. Understanding these relationships helps demonstrate the value of speed optimization alongside other e-commerce metrics and KPIs.
Track: Conversion rate changes by page load time segments, revenue per visitor by performance cohorts, cart abandonment by page speed quartiles, repeat visit rates by initial visit speed.
Cost-benefit analysis framework evaluates optimization efforts against business value.
Calculate: Developer time invested in optimization, infrastructure costs for performance improvements (CDN, caching systems, server upgrades), revenue increase from conversion rate improvements.
Example: 40 hours developer time at $100/hour ($4,000 cost) plus $100/month CDN ($1,200 annual) = $5,200 total investment. 0.3% conversion rate improvement on $1M annual revenue = $3,000 additional monthly revenue ($36,000 annual). ROI: 590% annual return. These improvements compound over time as faster experiences improve customer lifetime value through increased satisfaction and repeat purchases.
This clear ROI justifies continued performance investment and resource allocation.
ROI calculation for optimization efforts demonstrates business value to stakeholders.
Formula: ((Revenue increase - Optimization costs) / Optimization costs) × 100 = ROI percentage
Document ROI from completed optimizations to build organizational support for ongoing performance prioritization.
Building Your Performance Optimization Strategy
Site performance represents one of the highest-ROI optimization opportunities in e-commerce. Speed improvements benefit every customer, every visit, forever, not just during promotional periods or for specific segments.
Start with measurement: Run Google PageSpeed Insights, collect Core Web Vitals scores, identify primary performance bottlenecks. This data-driven baseline guides optimization priorities.
Address high-impact fundamentals: Image optimization and lazy loading, browser and server caching, CDN implementation, JavaScript and CSS minification. These optimizations deliver immediate, measurable improvements with minimal ongoing maintenance.
Then advance to sophisticated optimizations: Database query optimization, code splitting, edge caching for dynamic content, comprehensive performance monitoring.
Throughout implementation, measure business impact through conversion rate tracking, A/B testing, and ROI calculation. Performance optimization isn't purely technical exercise, it's conversion optimization with direct revenue impact. The stores that treat performance as core business priority rather than technical nice-to-have will capture the substantial conversion improvements that speed enables.

Senior Operations & Growth Strategist
On this page
- Why Site Speed Matters for E-commerce
- Core Web Vitals Explained
- Image Optimization Strategy
- Caching Architecture
- Content Delivery Network (CDN)
- Database Performance Optimization
- Code and Asset Minification
- Server-Side Performance
- Performance Monitoring and Analytics
- Mobile Performance
- Conversion Impact Testing
- Building Your Performance Optimization Strategy