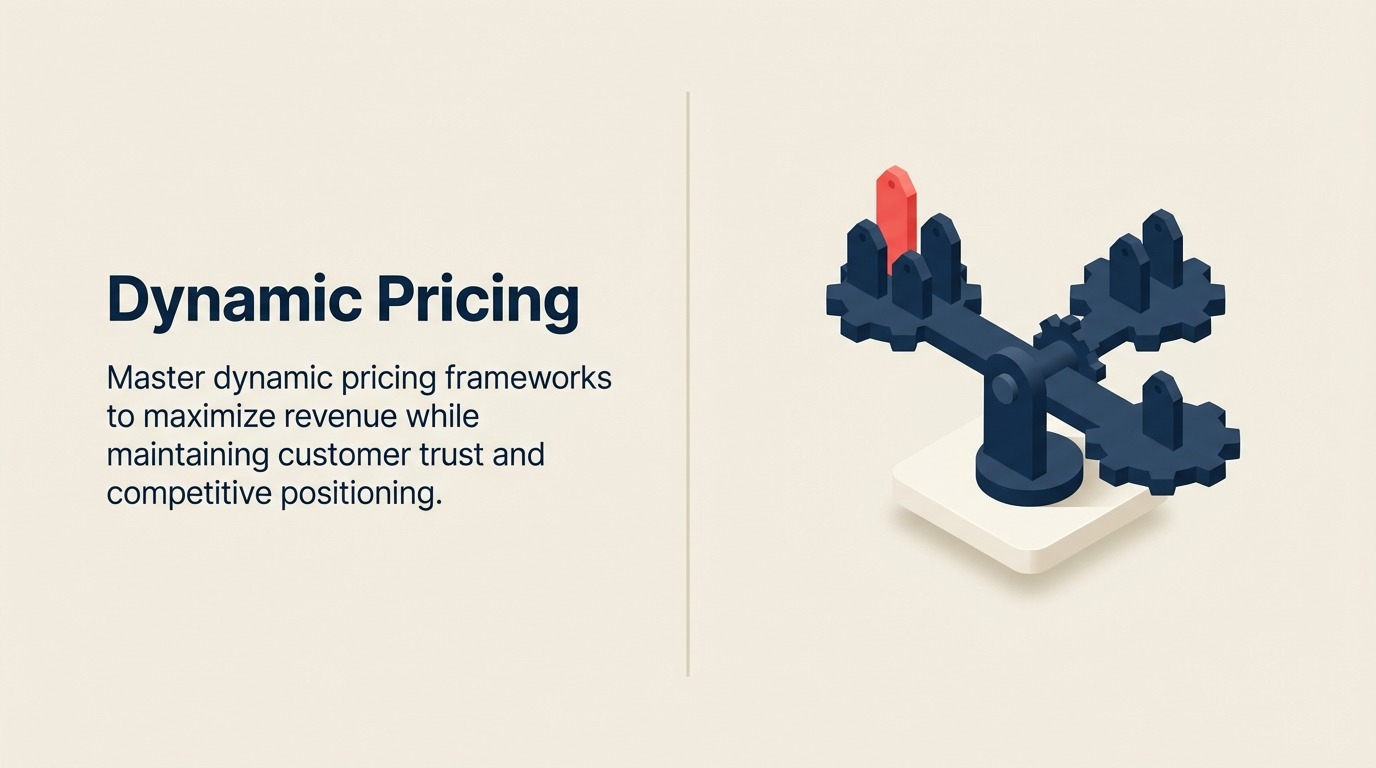
Dynamic Pricing: Algorithmic Price Optimization for E-commerce Profitability
Turn this article into takeaways for your work.
Each assistant summarizes the article only for you and suggests best practices for your work.
Dynamic pricing adjusts product prices in real-time based on demand, competition, inventory levels, and customer behavior. When you do it right, algorithmic pricing can increase revenue by 10-25% while keeping you competitive and maintaining customer trust.
Airlines and hotels pioneered this approach decades ago. Now, e-commerce brands of all sizes use dynamic pricing to optimize margins, clear inventory faster, and respond to market conditions automatically. The key is balancing maximum profitability with customer perception and long-term loyalty as part of your broader pricing strategy optimization approach.
Understanding Dynamic Pricing
Dynamic pricing means your prices change based on predefined rules or machine learning algorithms that respond to market signals. Unlike static pricing where you set a price and leave it for months, dynamic pricing adjusts automatically, sometimes multiple times per day.
The core principle: extract maximum value from each transaction by pricing according to what customers will pay at that specific moment. A winter coat sells for $120 in October when demand is building, $89 in January when competitors are clearing inventory, and $149 in November when a cold snap hits and stock is running low. Real-time adjustments happen through:
- Demand fluctuations (traffic surges, seasonal patterns)
- Competitive price changes (automated competitor monitoring)
- Inventory levels (overstocked vs scarce items)
- Customer segments (new vs returning, high vs low intent)
- Time-based factors (day of week, hour, holidays)
Revenue increases of 10-25% come from capturing more margin when demand is high and accelerating sales when demand is soft. You're not just raising prices. You're optimizing the price-volume relationship to maximize total profit.
The challenge is execution. Customers notice price changes, especially if they feel manipulated. Competitors react to your moves. Your brand reputation is on the line. Success requires careful strategy, not just turning on an algorithm and hoping for the best.
Dynamic Pricing Fundamentals & Economics
Price elasticity measures how demand changes when you adjust price. If a 10% price increase causes a 15% drop in sales, your product is highly elastic (elasticity = -1.5). If sales only drop 5%, it's relatively inelastic (elasticity = -0.5). Understanding elasticity by product category is fundamental:
- Commodities and price-sensitive categories: High elasticity (-2.0 to -4.0)
- Differentiated products with brand loyalty: Lower elasticity (-0.5 to -1.5)
- Unique or exclusive items: Very low elasticity (-0.2 to -0.7)
Demand curves show the relationship between price and quantity sold. In practice, you discover your demand curve through testing, raising and lowering prices on different product segments and measuring conversion rates.
Example: You sell wireless headphones at $79 with 100 daily orders. Test $89 for a week and orders drop to 85. Test $69 and orders jump to 130. Your demand curve shows moderate elasticity. The revenue math:
- $79 × 100 = $7,900/day
- $89 × 85 = $7,565/day (lower revenue despite higher price)
- $69 × 130 = $8,970/day (higher revenue at lower price)
But revenue alone doesn't tell the story. If your cost per unit is $45:
- $79 price = $34 margin × 100 = $3,400 profit
- $89 price = $44 margin × 85 = $3,740 profit (higher profit!)
- $69 price = $24 margin × 130 = $3,120 profit
The optimal price depends on your cost structure and business goals. Understanding unit economics for e-commerce is critical, high fixed costs favor volume while low marginal costs favor premium pricing. Dynamic pricing lets you shift between these strategies based on current conditions.
Market conditions change constantly. Your optimal price on Monday afternoon differs from Friday evening or the week after a competitor launches a sale. Static pricing leaves money on the table by ignoring these fluctuations.
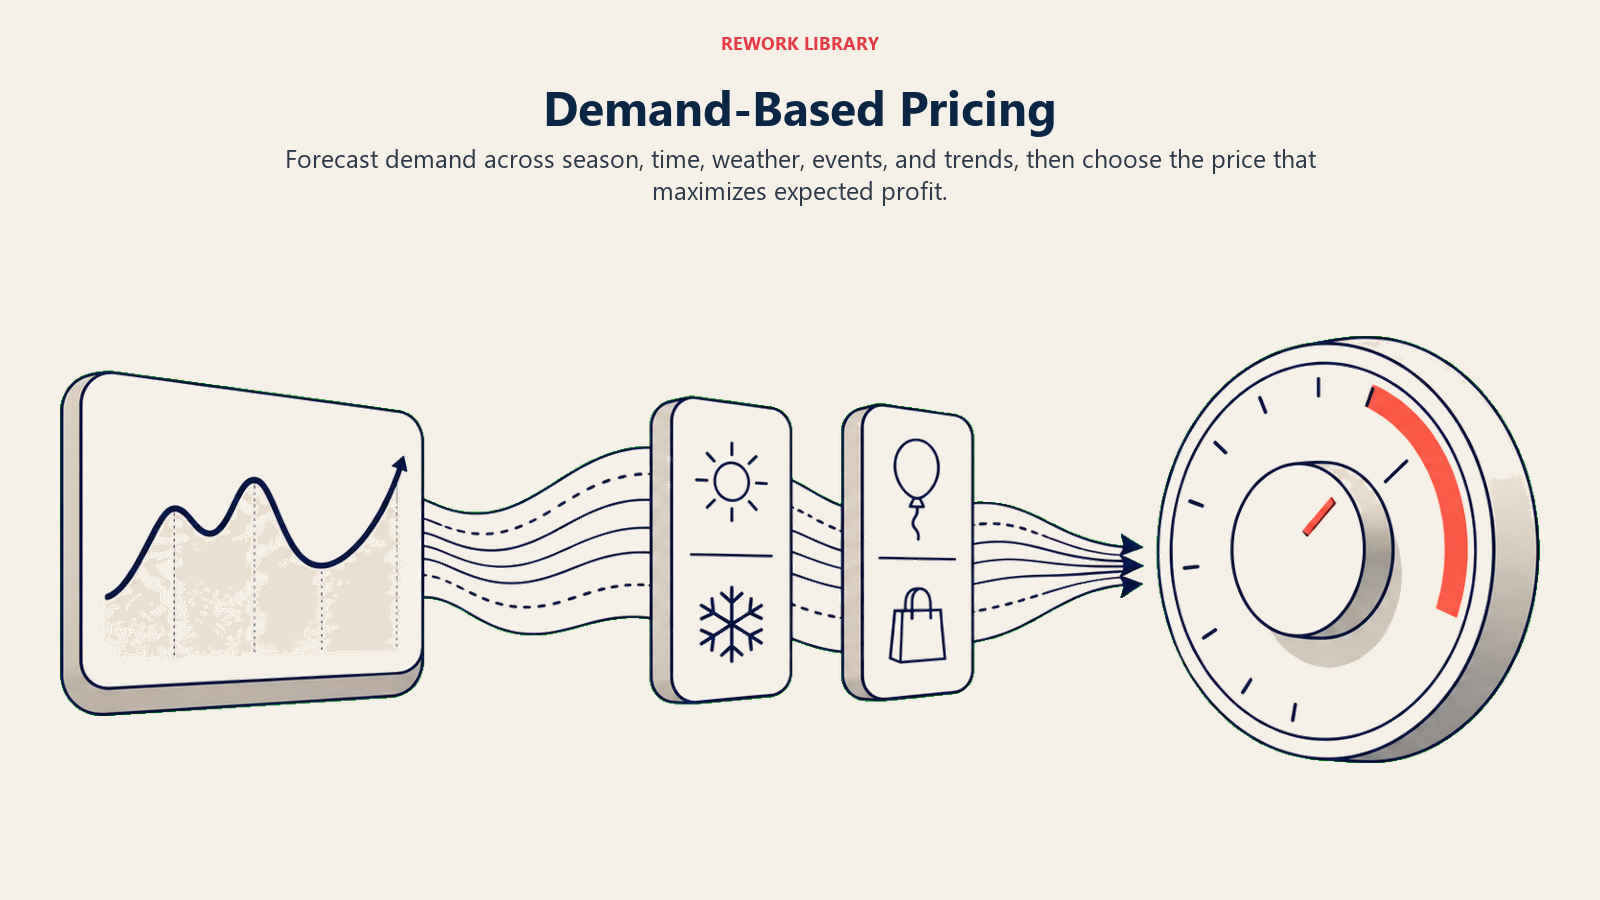
Demand-Based Pricing Algorithms
Demand forecasting drives price adjustments. Your algorithm predicts future demand based on historical patterns, then sets prices to maximize revenue given that forecast. Seasonal patterns are the most obvious signal. A swimwear brand knows demand peaks May-July and crashes in winter. Basic seasonal pricing raises prices 15-20% in April-May when buyers are willing to pay premium for selection, then progressively discounts from August onward. More sophisticated forecasting captures:
- Day-of-week patterns (weekend vs weekday demand)
- Hour-of-day (lunch hour browsing, evening purchasing)
- Weather correlation (rain gear, outdoor equipment)
- Event-driven spikes (back-to-school, holidays, sporting events)
- Trending topics (viral products, sudden popularity)
Time-based variations adjust prices by hour or day. Flash deal mechanics work here, price starts high when the offer launches and traffic is highest, then drops gradually to maintain conversion as interest wanes.
Velocity-based pricing tracks how fast products sell and adjusts accordingly. If a product sells 50 units in the first 3 hours when you expected 20, the algorithm raises price 10-15% to capture more margin before stock depletes. If it sells only 5 units, price drops 8-12% to accelerate movement.
The algorithm needs three inputs:
- Current sales velocity vs forecast
- Remaining inventory
- Time until next restock or season end
A simple rule-based approach:
IF velocity > 150% of forecast AND inventory < 30 days:
    Increase price 10%
ELSE IF velocity < 60% of forecast AND inventory > 60 days:
    Decrease price 12%
ELSE IF velocity 80-120% of forecast:
    Maintain current price
More advanced systems use exponential smoothing or ARIMA models to forecast demand, accounting for trend and seasonality. They predict sales at different price points, calculate expected profit for each scenario, and select the price that maximizes profit over your planning horizon.
Integration with your demand forecasting system ensures pricing decisions align with inventory planning and purchasing.
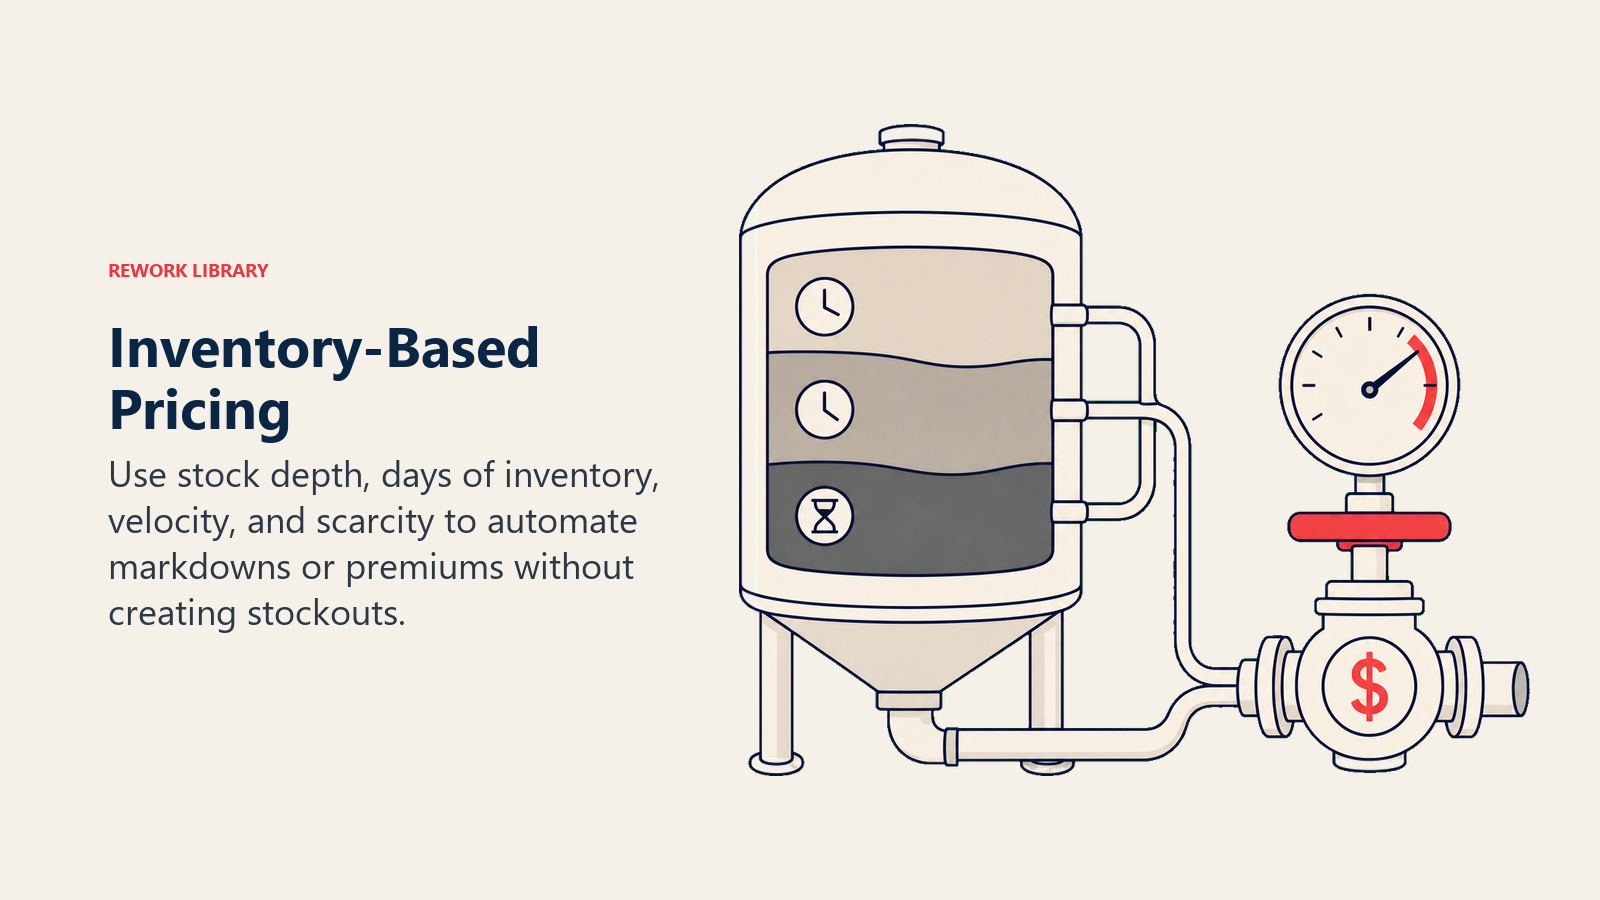
Inventory-Based Dynamic Pricing
Stock levels directly influence optimal pricing. Overstocked items need aggressive discounting to free up cash and warehouse space. Scarce items can command premium prices from motivated buyers. Stock level triggers automate this:
- 100+ days of inventory: Start 15% discount, increase 5% weekly until velocity normalizes
- 60-100 days: Light 5-10% promotional pricing to accelerate sales
- 30-60 days: Standard pricing, monitor velocity
- 7-30 days: Increase price 8-12% if demand is strong
- Under 7 days: Premium pricing (15-25% above baseline) to maximize margin before stockout Overstocked clearance follows a depreciation schedule. An item with 120 days of stock that normally sells 5 units/day needs to move 20% faster to clear in reasonable time. Price drops 18-22% to achieve that acceleration, based on estimated elasticity.
The math: If elasticity is -1.5, a 20% price drop should increase demand by 30% (1.5 × 20%). That moves your 5 units/day to 6.5 units/day, clearing 120-day inventory in 92 days instead.
Scarcity pricing does the opposite. Limited stock creates urgency. Buyers pay premium to secure items before they're gone. The strategy works best with:
- High-demand products with proven track record
- Items that won't be restocked for weeks/months
- Differentiated products where substitutes aren't perfect
- Customer segments that value availability over price
Show scarcity signals on product pages: "Only 3 left in stock" or "Low stock - order soon." Combine this with 10-15% price increase to capture maximum value from urgent buyers while slower buyers wait for restock.
Inventory aging applies time-based depreciation. Fashion and seasonal items lose value as they age:
- Month 1-2: Full price
- Month 3-4: 10% discount
- Month 5-6: 20-30% discount
- Month 7+: 40-50% clearance
Connect dynamic pricing to your inventory management system so algorithms have real-time stock data and can adjust pricing instantly when inventory levels cross thresholds.
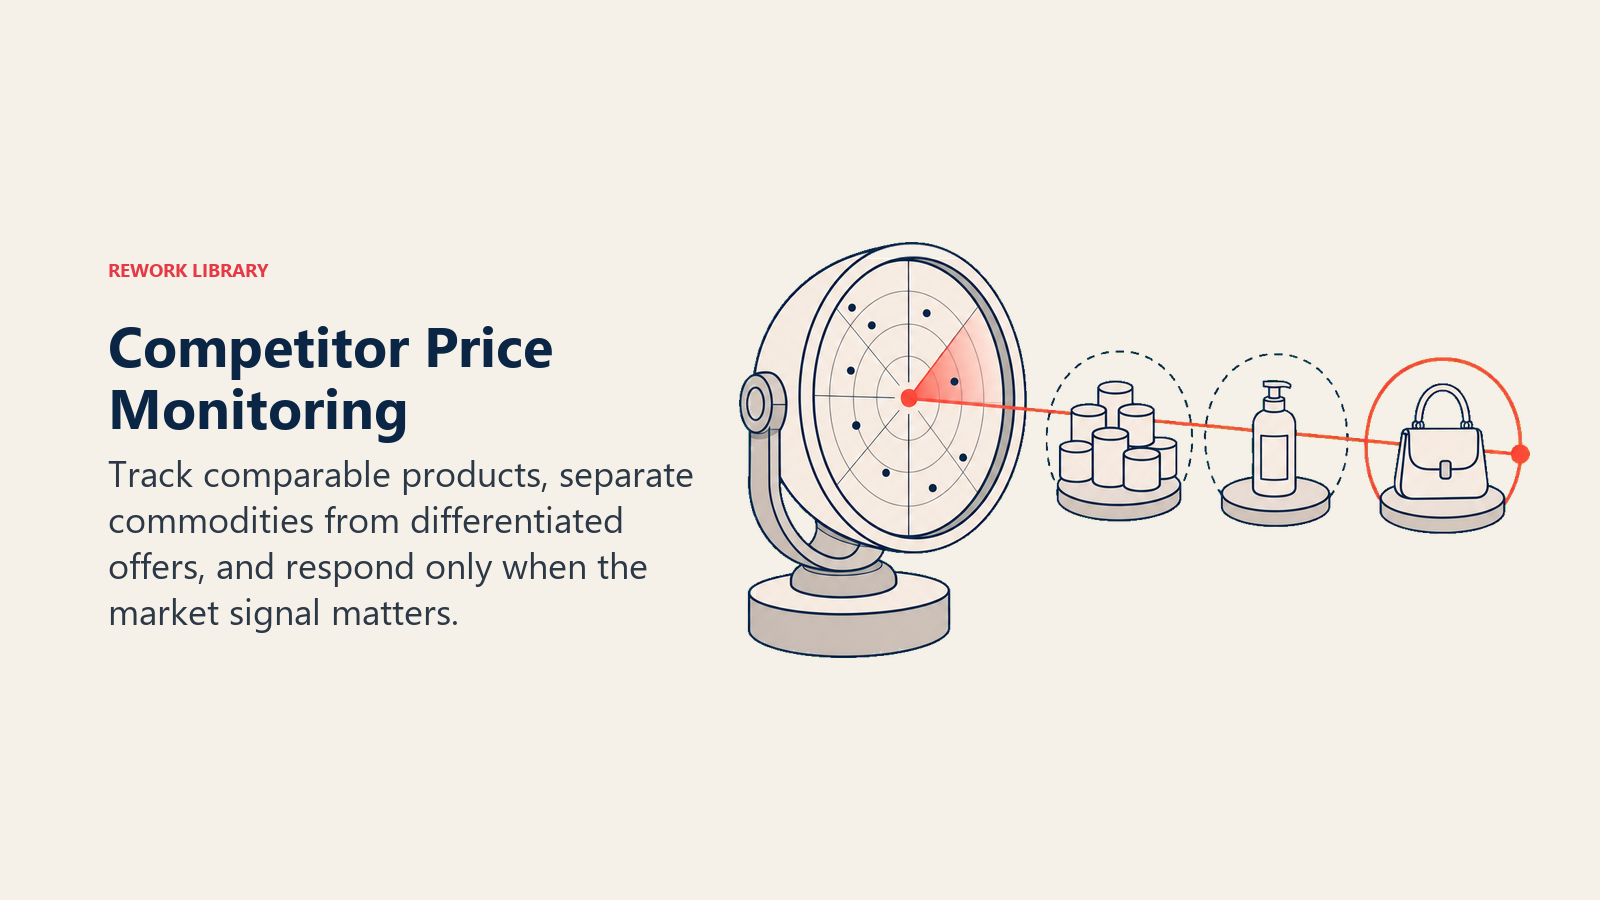
Competitor Monitoring & Market Intelligence
Price tracking tools monitor competitor pricing across hundreds or thousands of products, alerting you to changes and enabling automated responses. Enterprise tools like Prisync, Competera, or Intelligence Node track competitors 24/7. Smaller brands use scraping tools or manual checks on key items. Track three categories differently:
- Price-sensitive commodities: Match or beat competitors within hours to maintain conversion
- Differentiated products: Monitor but don't match, focus on value proposition
- Exclusive items: Ignore competitors, you have pricing power Parity strategies maintain competitive position:
- Match lowest: Automatically match the lowest competitor price (minus $0.01)
- Match average: Price at market average to avoid race-to-bottom
- Competitive range: Stay within 5-8% of competitor range
- Strategic premium: Price 10-15% above competitors but justify with superior service, faster shipping, or better return policy
Market positioning determines your repricing strategy. If you're the value leader, you must respond quickly to competitor discounts. If you're the premium brand, you can ignore most price changes and focus on maintaining perceived value.
Repricing frequency depends on market dynamics:
- High-velocity commodities: Every 1-4 hours
- Standard products: 1-2 times per day
- Premium/differentiated: 2-3 times per week
- Exclusive items: Weekly review only
Build repricing rules that prevent racing to the bottom:
IF competitor price < our price AND our price > minimum margin threshold:
    Match competitor price - $0.01
ELSE IF competitor price < minimum margin threshold:
    Maintain current price, accept lower conversion
Set absolute price floors based on cost structure. Never discount below the point where contribution margin becomes negative, even if competitors do. You'll lose less money walking away from unprofitable sales.
Your competitor analysis monitoring process should feed pricing algorithms with daily competitor data, market share trends, and category dynamics.
Psychological Pricing & Customer Perception
Price fairness concerns limit how aggressively you can implement dynamic pricing. Customers get angry when they discover they paid more than someone else for identical items, especially if the difference seems arbitrary. Transparency vs opacity is your strategic choice:
- Transparent: Explain why prices change (demand, limited stock, time-based offers)
- Opaque: Change prices without explanation, hope customers don't notice
Transparent pricing builds trust but limits your flexibility. "Prices increase as we sell out" is fair and understandable. Customers accept it because the logic is clear and applies to everyone equally.
Opaque pricing extracts more revenue but risks backlash. Changing prices without explanation works until customers notice and feel manipulated. Twitter complaints and negative press can destroy more value than dynamic pricing creates.
Backlash prevention strategies:
- Limit price variation range (±15% maximum swing)
- Change prices at consistent times (daily at midnight, not randomly)
- Never show different prices to different users simultaneously (avoid personalized pricing perception)
- Grandfather pricing for customers who add items to cart
- Explain seasonal/demand-based changes clearly
Framing price changes affects perception:
- Good framing: "Flash sale ending soon - price returns to normal in 2 hours"
- Bad framing: No explanation for why the price you saw yesterday is 20% higher today
Use psychological pricing tactics within your dynamic framework:
- Keep charm pricing ($29.99 vs $30) even as base prices change
- Round up to psychological thresholds ($49→$50) when raising prices significantly
- Anchor against original price: "Was $120, now $89" works better than "$89 (changes frequently)"
Customer lifetime value matters more than transaction profit. If aggressive dynamic pricing increases one-time revenue but reduces repeat rate by 15%, you lose money long-term. Understanding customer lifetime value helps you balance short-term revenue optimization with long-term profitability. Monitor repeat purchase rates by customer cohorts exposed to different pricing strategies.
Connect this to your broader pricing strategy to ensure dynamic adjustments support your overall brand positioning.
Automation & Technology Infrastructure
Software platforms range from simple rule-based tools to sophisticated ML engines: Entry-level ($50-300/month):
- Prisync, RepricerExpress, Appeagle
- Rule-based repricing
- Competitor monitoring
- Basic demand curves
Mid-market ($500-2,000/month):
- Competera, Pricefx, Revionics
- Advanced algorithms
- Multi-factor optimization
- Inventory integration
Enterprise ($5,000+/month):
- Blue Yonder, PROS, Zilliant
- ML-powered optimization
- Cross-channel pricing
- Customer segmentation
API integration connects pricing engines to your e-commerce platform, POS system, inventory management, and competitor tracking tools. Real-time data pipelines ensure algorithms work with current information:
Product Catalog → Pricing Engine
Inventory System → Pricing Engine
Competitor Data → Pricing Engine
Sales Velocity → Pricing Engine

Pricing Engine → E-commerce Platform (price updates)
Pricing Engine → POS System (omnichannel consistency)
Rule-based engines apply if-then logic you define:
IF competitor_price < our_price BY 10%
AND inventory > 60_days
AND margin > minimum_threshold:
    SET price = competitor_price - $1
Advantages: Predictable, transparent, easy to troubleshoot Disadvantages: Can't capture complex interactions, requires constant rule maintenance
ML engines learn patterns from historical data and predict optimal prices without explicit rules. They handle dozens of variables simultaneously and discover non-obvious relationships between factors.
Advantages: Adapts automatically, handles complexity, improves over time Disadvantages: Black box decisions, requires significant data, harder to explain
Most businesses start with rule-based systems and layer in ML as they scale. Rules handle obvious scenarios (match competitors, clear overstock), while ML optimizes the middle ground where multiple factors compete.
Technical requirements:
- Hourly or real-time inventory sync
- Competitor price feeds (scraped or via API)
- Historical sales data (minimum 12 months)
- Product catalog with attributes and costs
- Price change approval workflow (for review before publishing)
Ensure your analytics and tracking setup can capture price change events and correlate them with conversion metrics. Start with 20% of your catalog, high-velocity items where dynamic pricing has the biggest impact. Prove ROI before expanding to your full catalog.
Machine Learning & Predictive Pricing
Linear regression models predict demand as a function of price and other variables:
Demand = β₀ + β₁(Price) + β₂(Day_of_Week) + β₃(Season) + β₄(Competitor_Price) + ε
Train the model on historical data, then use it to forecast demand at different price points. Select the price that maximizes expected profit given predicted demand.
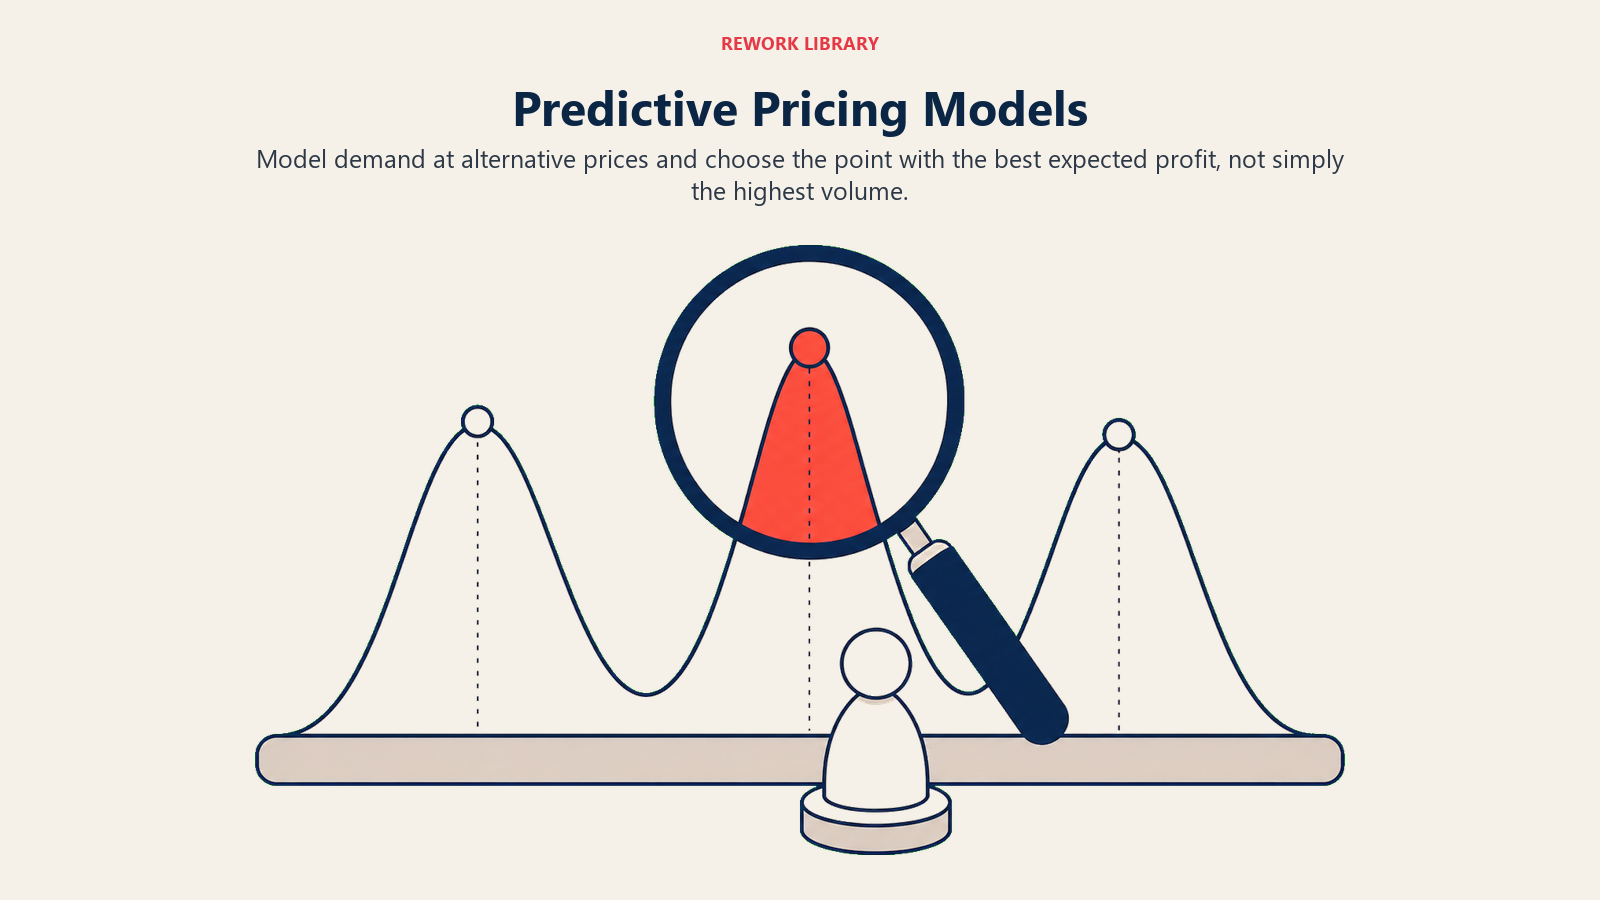
Example: Your model predicts at $79, you'll sell 100 units. At $89, you'll sell 82 units. At $69, you'll sell 124 units. With $45 cost:
- $79: 100 × ($79-$45) = $3,400 profit
- $89: 82 × ($89-$45) = $3,608 profit ← Optimal
- $69: 124 × ($69-$45) = $2,976 profit
Neural networks capture non-linear relationships that regression misses. A deep learning model might discover that price sensitivity changes dramatically based on time-of-month (payday effect) or that certain customer segments are 3x more price-sensitive than others.
Customer segmentation improves predictions by modeling different groups separately. Implementing effective customer segmentation allows you to identify distinct behavioral groups:
- Price hunters: High elasticity, buy only on discount
- Convenience buyers: Low elasticity, value speed over price
- Loyalists: Medium elasticity, willing to pay premium for trusted brands
- New customers: Uncertain elasticity, need testing to classify
Show different prices to different segments? That's where legal and ethical issues arise (covered next section). The safer approach: show the same price but optimize for the average customer visiting at that time. Monday morning traffic skews to convenience buyers, so raise prices. Friday evening skews to price hunters browsing for weekend purchases, so lower prices.
Churn prediction models identify customers at risk of leaving. If your model flags a high-value customer as 70% likely to churn, you might offer personalized discounts to retain them. This is targeted pricing based on predicted lifetime value, not pure profit optimization.
ML systems require:
- Clean historical data (sales, prices, inventory, traffic)
- Feature engineering (day, season, holidays, competitor actions)
- Model training and validation (train on 80% of data, validate on 20%)
- A/B testing (compare ML prices to baseline to prove incremental value)
- Continuous retraining (weekly or monthly to adapt to market changes)
Start simple with linear regression on 5-10 key variables. Add complexity only when you've maxed out simpler approaches. A well-tuned rule-based system often beats a poorly implemented ML model.
Legal & Ethical Considerations
Price discrimination laws vary by jurisdiction. In the US, the Robinson-Patman Act prohibits discriminatory pricing that harms competition, but it applies primarily to B2B sales, not consumer e-commerce. EU consumer protection laws are stricter about personalized pricing.
Legal concerns:
- Geographic discrimination: Charging different prices by location (state, country) is generally legal if based on costs (shipping, taxes), questionable if purely based on ability to pay
- Personalized pricing: Showing different prices to different users based on browsing history, device, or demographic is legally gray and ethically problematic
- Surge pricing transparency: Required to disclose in some jurisdictions (ride-sharing disclosures)
Transparency requirements depend on industry and location. Generally, you must:
- Clearly show the current price
- Not hide fees that inflate total cost
- Honor prices shown when customer adds to cart (for reasonable time period)
- Disclose if prices change frequently
Ethical practices go beyond legal compliance:
- Treat all customers fairly, same product, same price at the same time
- Don't exploit vulnerable populations with predatory pricing
- Explain why prices change if asked
- Don't use dark patterns to hide price increases
Regulation compliance checklist:
- Review pricing practices with legal counsel
- Implement price change logging for audit trail
- Train staff on fair pricing policies
- Monitor for discriminatory patterns in pricing data
- Establish complaint resolution process
The safest approach: Dynamic pricing based on market factors (demand, competition, inventory) that apply equally to all customers. Avoid personalized pricing based on individual user data unless you have clear legal guidance.
Implementation Strategy & Testing
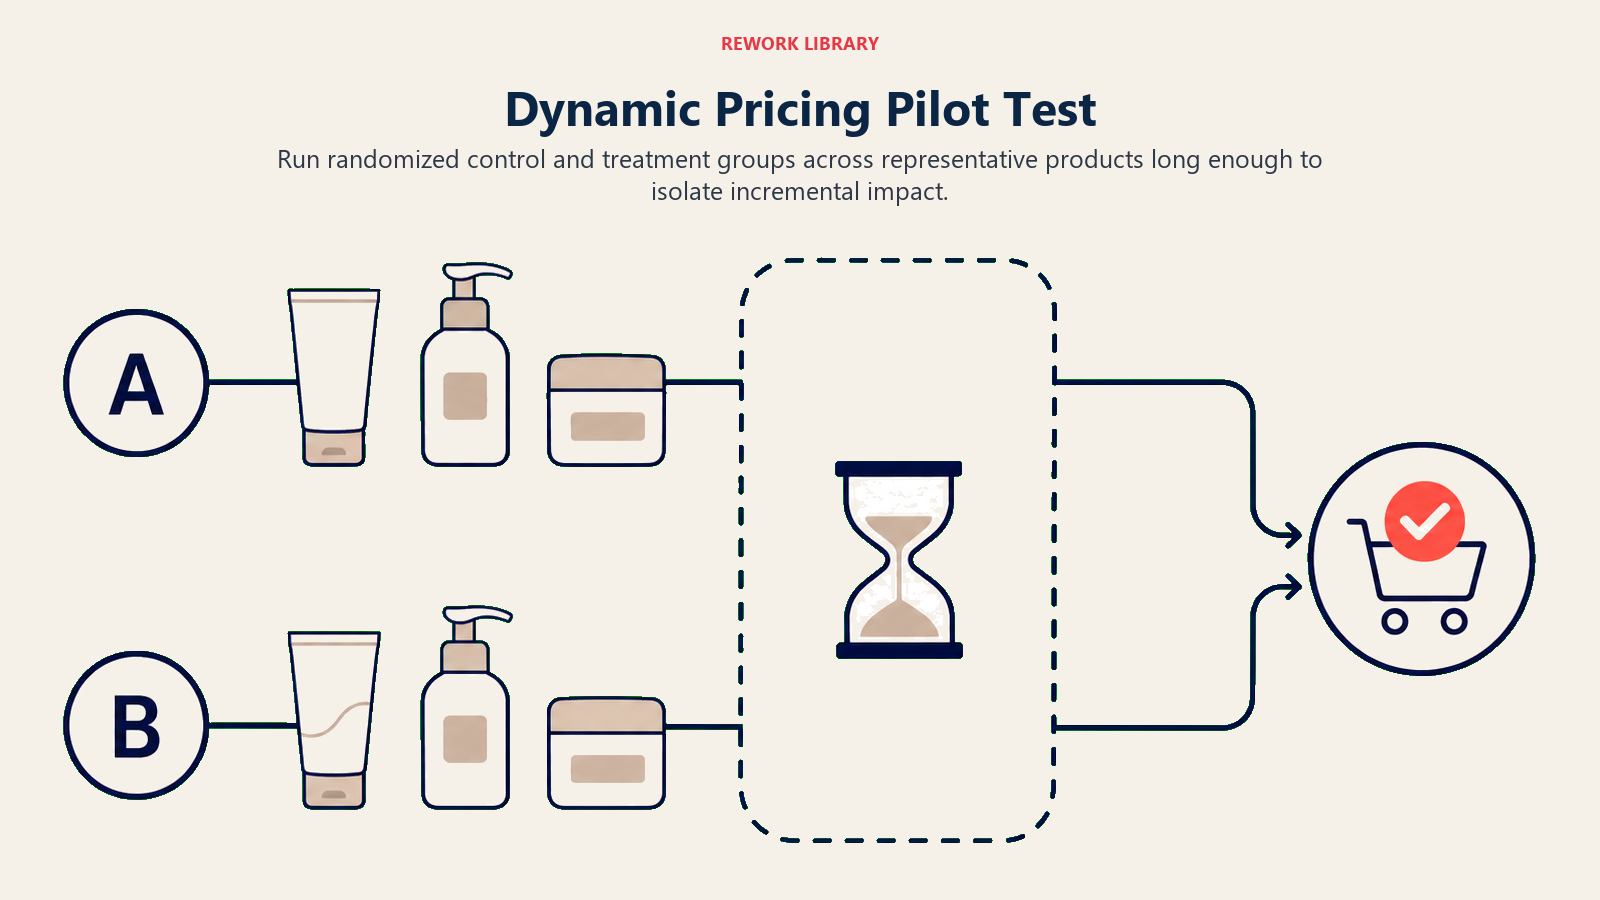
Pilot testing proves the concept before full rollout. Select 50-100 products that represent different categories, price points, and demand patterns. Run dynamic pricing on these products for 60-90 days while holding the rest of your catalog static. A/B testing framework:
- Control group: 50% of test products maintain static pricing
- Treatment group: 50% use dynamic pricing algorithms
- Randomization: Assign products randomly to avoid selection bias
- Measurement period: Minimum 60 days to capture weekly and monthly patterns Holdout groups ensure you can measure incremental impact. Without a control group, you can't separate dynamic pricing effects from seasonal trends, marketing campaigns, or market-wide changes.
Metrics to track by group:
- Revenue per product
- Units sold
- Gross margin
- Price per unit (average selling price)
- Conversion rate
- Cart abandonment rate
- Customer complaints about pricing
Calculate incrementality:
Incremental revenue = (Treatment revenue - Control revenue) / Control revenue
If treatment group generates 18% more revenue with similar margin, you have a clear winner. If revenue is up but margin is down, your algorithm is discounting too aggressively.
Gradual rollout after successful pilot:
- Week 1-2: Expand to 500 products (10% of catalog)
- Week 3-4: Review performance, adjust algorithms
- Week 5-8: Expand to 2,000 products (40% of catalog)
- Week 9-12: Full catalog rollout
Monitor edge cases:
- Products that drop to minimum price and stay there (algorithm thinks demand is too soft)
- Products that spike to maximum price (algorithm over-estimates demand)
- Frequent price oscillation (algorithm is unstable)
Set override rules for manual intervention when algorithms behave unexpectedly. Your team should review pricing changes daily during rollout, weekly once stable.
Structure your pricing experiments using rigorous testing methodology to avoid common statistical pitfalls and ensure valid results.
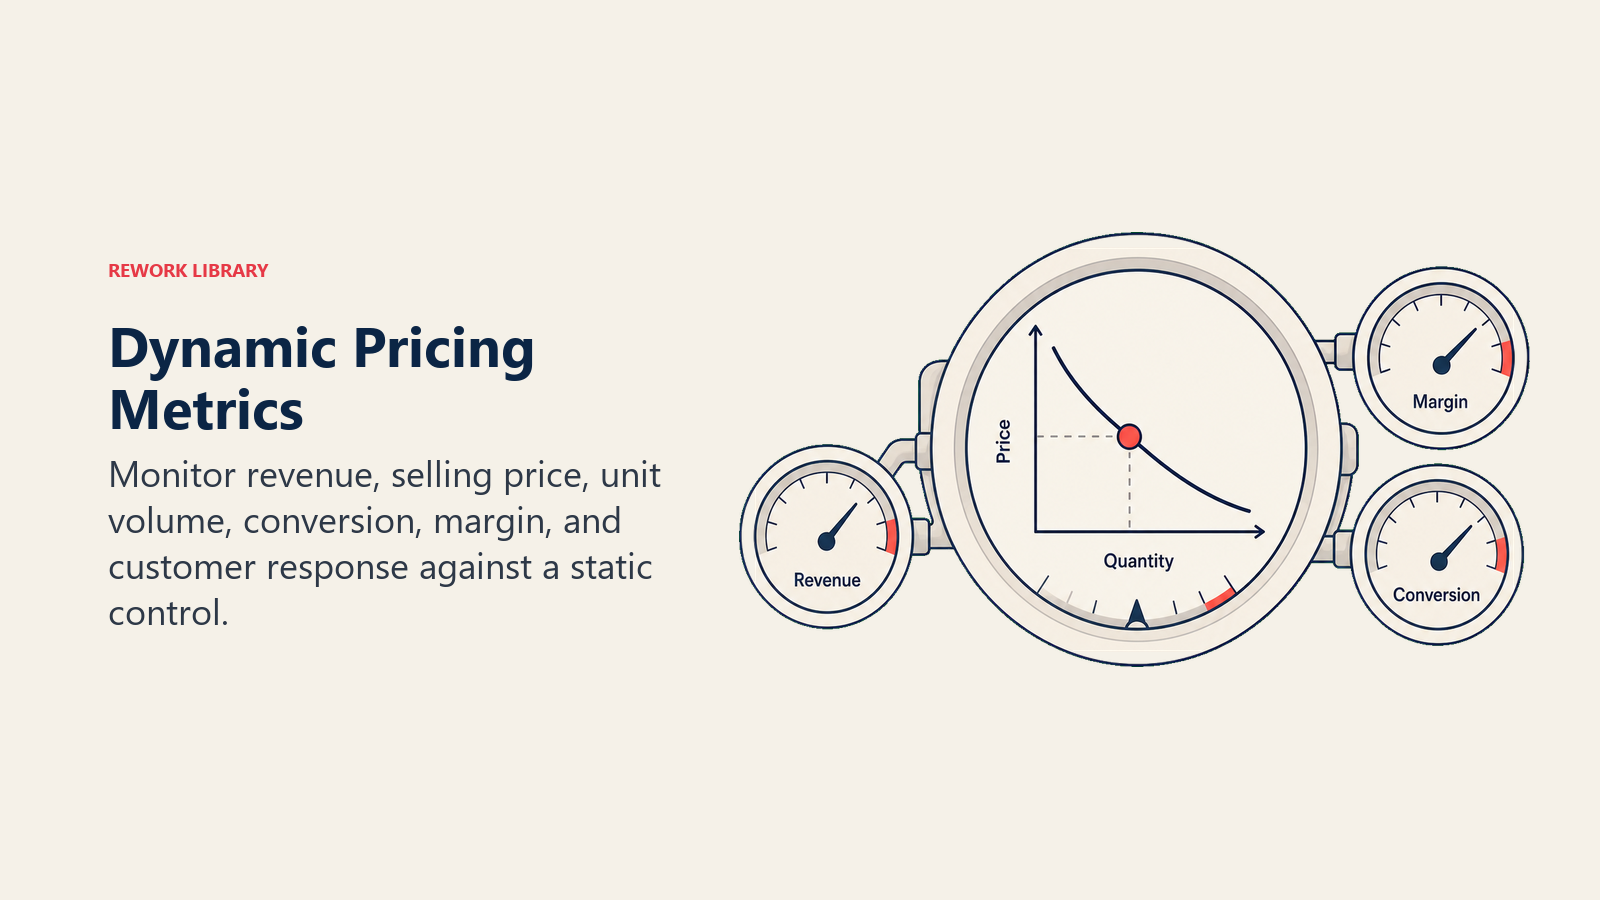
Metrics & Performance Monitoring
Revenue per product measures total sales value. Track this daily for dynamically priced items vs static pricing control group. Look for sustained increases over 30+ day periods to filter out noise. Average selling price (ASP) monitoring reveals whether revenue gains come from volume or margin. If ASP increases 8% while units sold stays flat, you're capturing more margin. If ASP drops 5% but units increase 15%, you're driving volume through lower prices.
The ideal scenario: ASP increases 3-5% while volume increases 5-8%, compounding to 8-14% revenue growth.
Conversion by price point shows elasticity in action:
- $60-69: 4.2% conversion rate
- $70-79: 3.8% conversion rate
- $80-89: 3.1% conversion rate
- $90-99: 2.4% conversion rate
Plot conversion against price to visualize your demand curve. If you spot unexpected jumps or drops, investigate pricing thresholds or competitive factors.
Gross margin tracking prevents the discount trap. Revenue is easy to increase by cutting prices. Profit is what matters. Track gross margin dollars and percentage:
Gross Margin $ = Revenue - (Cost × Units Sold)
Gross Margin % = (Revenue - Costs) / Revenue
Target margin improvement of 2-5% while maintaining or growing revenue. If margin drops, your algorithms are over-discounting.
Dashboard metrics (real-time):
- Current prices vs baseline prices (% change)
- Revenue trend vs forecast
- Margin trend vs target
- Number of out-of-stock items (dynamic pricing should reduce this by optimizing velocity)
- Number of overstock items (should also decrease)
- Competitor price parity (% of items within 5% of competitor average)
Weekly review metrics:
- Win rate on price-sensitive keywords (SEO/PPC where price matters)
- Shopping cart abandonment rate (spikes indicate price resistance)
- Customer service contacts about pricing (complaints are early warning)
- Repeat purchase rate (ensure dynamic pricing doesn't hurt loyalty)
Connect dynamic pricing to your e-commerce metrics and KPIs tracking to understand how pricing changes affect overall funnel performance and broader business outcomes. Monitor conversion rate optimization metrics to identify when price adjustments help or hurt conversion.
Best Practices & Roadmap
Quick wins to start immediately:
- Time-based discounting: Drop prices 8-12% during your slowest traffic hours to boost conversion
- Inventory clearance automation: Auto-discount items over 90 days old by 15-20%
- Competitor matching: Auto-match competitors on your top 20 products within defined margin limits
- Flash sale pricing: Raise prices 10% before announcing flash sales, then "discount" to normal price
These tactics require minimal technology, spreadsheets and manual price updates work for the first month. Prove value before investing in automation.
Cross-channel consistency matters if you sell on multiple platforms. Customers check Amazon, your website, and eBay. Major price discrepancies damage trust. Sync prices across channels or implement platform-specific strategies with clear justification (Amazon fees justify higher prices there).
Profitability balance guide:
- High-margin products (>40%): Aggressive dynamic pricing, wide price range (±20%)
- Medium-margin products (20-40%): Moderate adjustments (±12%)
- Low-margin products (<20%): Conservative approach (±5%), focus on volume
Continuous optimization checklist:
- Review algorithm performance weekly
- Update competitor lists monthly
- Retrain ML models monthly or quarterly
- Adjust seasonality factors before each season
- Test new pricing strategies quarterly
- Survey customers about price perception annually
- Benchmark against industry margin standards quarterly
90-day roadmap for beginners:
Month 1: Foundation
- Audit current pricing and margins
- Implement basic competitor tracking
- Set up inventory-based rules (clearance, scarcity)
- Test on 50 products
Month 2: Automation
- Implement pricing software or build simple scripts
- Expand to 200-500 products
- Set up monitoring dashboards
- Train team on new processes
Month 3: Optimization
- Analyze A/B test results
- Refine algorithms based on learnings
- Plan full catalog rollout
- Document pricing strategy and rules
Long-term sophistication:
- Year 1: Rule-based dynamic pricing
- Year 2: ML-powered optimization
- Year 3: Personalization and advanced segmentation
Dynamic pricing works best when combined with other revenue optimization strategies. Coordinate pricing changes with your seasonal promotional strategy to create urgency around price changes and maximize revenue during peak periods.
The goal isn't just higher prices, it's optimal prices that maximize long-term profitability while building customer trust and market position. Start conservatively, test rigorously, and scale what works.

Senior Operations & Growth Strategist
On this page
- Understanding Dynamic Pricing
- Dynamic Pricing Fundamentals & Economics
- Demand-Based Pricing Algorithms
- Inventory-Based Dynamic Pricing
- Competitor Monitoring & Market Intelligence
- Psychological Pricing & Customer Perception
- Automation & Technology Infrastructure
- Machine Learning & Predictive Pricing
- Legal & Ethical Considerations
- Implementation Strategy & Testing
- Metrics & Performance Monitoring
- Best Practices & Roadmap