Returns Management: Building Profitable Reverse Logistics and Customer-Centric Return Processes

Turn this article into takeaways for your work.
Each assistant summarizes the article only for you and suggests best practices for your work.
Returns represent one of e-commerce's biggest operational challenges and profit drains. While physical retail sees return rates of 8-10%, online stores face 15-40% depending on category. Apparel and footwear hit 30-40%, home goods 15-25%, electronics 10-20%. Each return costs you $10-$30 in reverse logistics alone, before factoring in lost margin, damaged inventory, and processing time.
The financial impact compounds quickly. A store doing $2M annually with a 25% return rate processes $500K in returns. At $20 average cost per return, that's $250K+ in reverse logistics expenses, more than most spend on customer acquisition. Factor in refunds, damaged goods, and restocking labor, and returns can eliminate 5-15% of gross profit.
Customer experience complicates things. Lenient return policies drive conversion (buyers purchase confidently knowing they can return) but create operational nightmares. Strict policies protect margins but hurt acquisition and loyalty. Brands that balance this well treat returns as a customer experience investment with clear ROI targets, not just a cost to minimize.
The hidden opportunity: returns data reveals product issues, sizing problems, and customer expectations gaps that, when addressed, reduce future returns and improve product-market fit. A $50 return might cost you $30 to process, but the insight could prevent 100 future returns worth $3,000 in saved costs.
Returns Economics Foundation
Understanding true return costs determines whether you're operating profitably. Most brands underestimate total return expenses by 40-60% because they only track obvious costs.
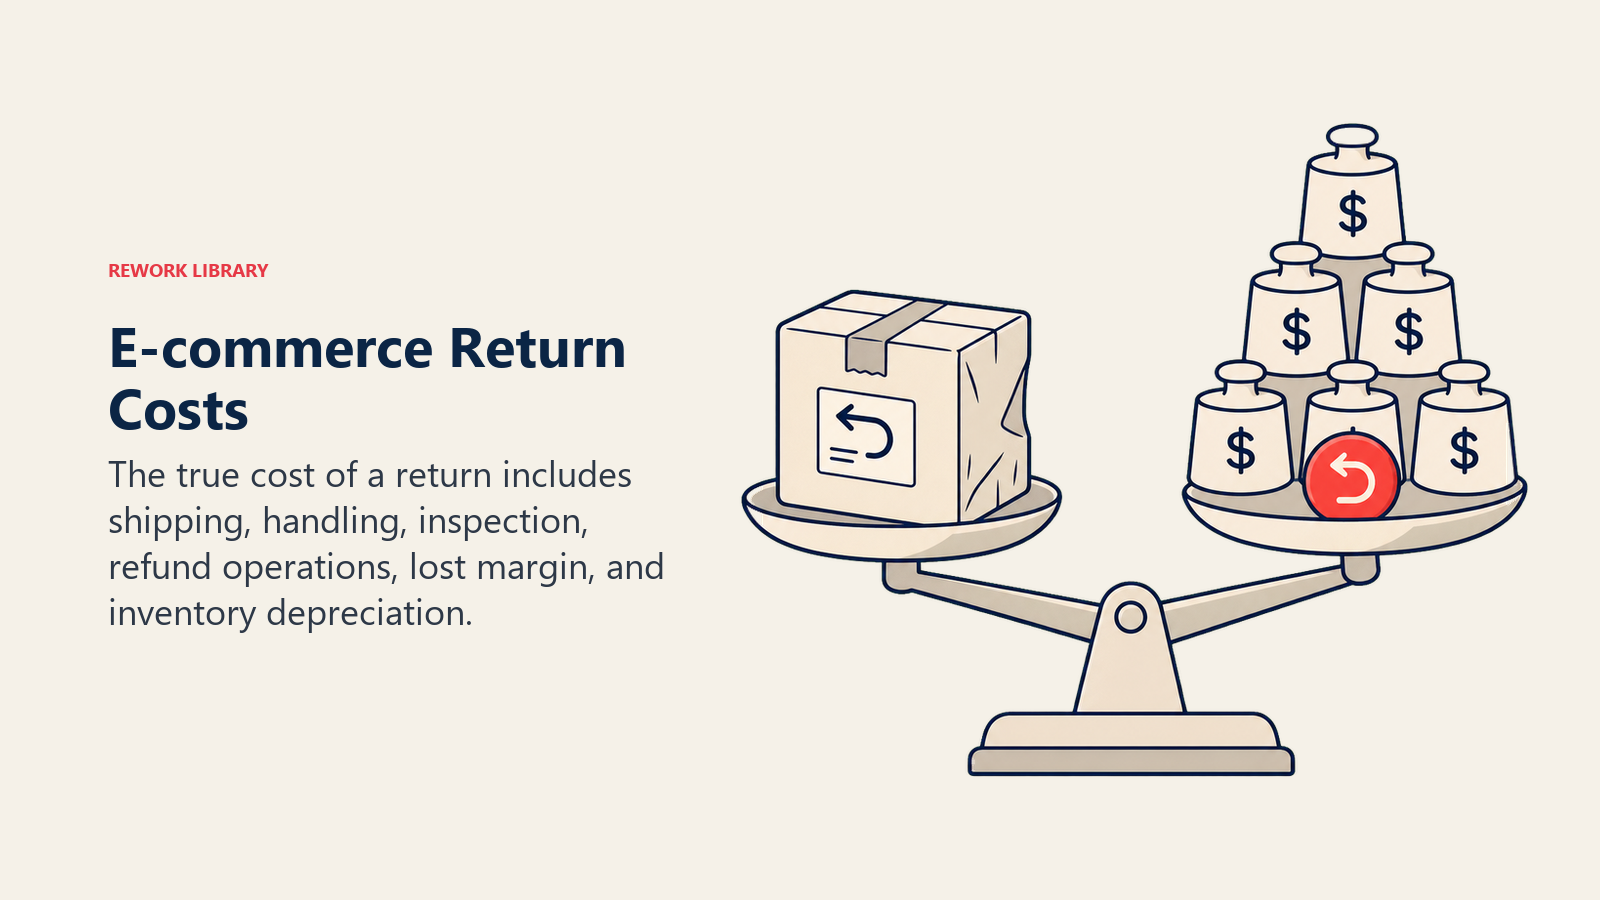
Complete Cost Components:
Outbound shipping credit: $8-15 per return (if you offer free returns) Return shipping label: $5-12 (prepaid labels) Processing labor: $3-8 per return (receiving, inspection, system updates) Inspection time: $2-5 (condition assessment, photo documentation) Restocking labor: $1-3 (cleaning, repackaging, inventory placement) Customer service: $2-5 per return (email support, refund questions) Software/systems: $0.50-2 per return (return portal, tracking, integrations) Shrinkage/damage: 10-30% of returns can't be resold at full price
Total per-return cost: $22-50 depending on product type and infrastructure
This doesn't include the opportunity cost of capital tied up in returned inventory or lost margin on items sold at discount after return.
Calculate your true return cost:
- Track all labor hours on returns (receiving, processing, customer service)
- Add shipping costs (both directions if you cover return shipping)
- Factor inventory loss (percentage unsellable or sold below cost)
- Include software and overhead allocation
- Divide by number of returns processed
Most brands discover their actual cost is 2-3x what they'd assumed.
Impact on Unit Economics:
Product selling for $80 with $40 COGS and $15 shipping/fulfillment generates $25 gross profit. With a 25% return rate, expected return cost per order is $7.50 (25% × $30 average return cost). Your actual gross profit drops to $17.50, a 30% reduction.
If you're targeting 40% gross margin but returns consume 10-15% of revenue, you're really operating at 25-30% margins. This math matters when planning growth, pricing products, or evaluating profitability. Understanding your unit economics for e-commerce becomes critical when returns eat into margins, and the cumulative impact directly affects customer lifetime value calculations.
Return rate benchmarks by category help set realistic targets:
- Apparel/Fashion: 25-40% (fit and style issues)
- Footwear: 30-40% (sizing problems)
- Home Decor: 15-25% (color/size mismatch)
- Electronics: 10-20% (buyer's remorse, compatibility)
- Beauty/Cosmetics: 5-15% (typically non-returnable)
- Furniture: 8-15% (damage during shipping)
Your goal isn't zero returns (impossible and would kill conversion), but optimizing the balance between customer experience and profitability.
Return Policy Framework & Design
Your return policy directly impacts conversion rates, customer acquisition cost, repeat purchase rate, and operational complexity. The right policy balances customer confidence with margin protection.
Core Policy Elements:
Return Window: 30, 60, or 90 days from delivery. Longer windows increase conversion but raise costs (items out of season, style changes, increased fraud). Fashion retailers typically use 30 days, electronics 30-60 days, furniture/home goods 60-90 days. Extended holiday return windows (purchases in Nov/Dec returnable through January) drive Q4 sales but concentrate returns in January.
Condition Requirements: Unworn/unused, tags attached, original packaging. Clear photography showing required condition reduces disputes. "New with tags" for apparel, "unopened box" for electronics, "unassembled" for furniture. Specify hygiene products are final sale (underwear, swimwear, earrings).
Return Shipping Responsibility: Free returns cost you $8-15 per return but increase conversion 5-15%. Customer-paid returns reduce return rate 10-20% but may hurt repeat purchase rate. Hybrid approaches: free exchanges, customer-paid refunds; free returns over $50, customer-paid below; store credit for free returns, customer-paid for refunds.
Refund Speed: Process refunds within 2-5 business days of receipt to minimize customer service contacts. Instant refunds (before item returned) increase loyalty but raise fraud risk. Segment by customer value: instant refunds for repeat customers, standard for first-time buyers.
Exception Policies: Final sale items (clearance, customized products), restocking fees (15-25% for opened electronics or special orders), return windows for seasonal items, international return policies (often customer-paid or store credit only).
Communication and Clarity: Policy should be visible pre-purchase (product pages, checkout, confirmation emails) and post-purchase (order confirmation, shipping notification, return portal). Ambiguity creates customer service burden and negative reviews.
Sample Policy Framework:
"30-day return window from delivery. Items must be unworn with original tags attached. Free returns via prepaid label; refund processed within 3 business days of receipt. Store credit issued immediately; original payment method refunds after inspection. Final sale items marked clearly at checkout. Exchanges ship free; we cover outbound shipping."
This policy balances customer experience (reasonable window, free returns) with cost control (store credit incentive, quick processing, clear conditions).
Test policy variations by segment or channel:
- Email subscribers get 45 days, general customers 30 days
- First-time buyers pay return shipping, repeat customers free
- Items over $100 include free returns, under $100 customer-paid
Track impact on conversion, return rate, repeat purchase, and total cost per order.
Reverse Logistics & Return Fulfillment
How you physically handle returns determines processing cost, speed, and customer experience. Efficient reverse logistics can cut per-return costs 40-60%.
Return Network Design:
Centralized Processing: All returns go to main warehouse or dedicated return center. Simplifies operations, enables specialist training, easier inventory management. Works well under 100 returns/day. Cost per return: $15-25.
Distributed Processing: Returns route to nearest fulfillment center or retail location. Faster processing, lower shipping costs, better for high volume or retail integration. Requires standardized procedures across locations. Cost per return: $12-20 at scale.
Third-Party Returns Processing: Outsourcing to a 3PL includes returns processing. Specialists handle inspection, restocking, liquidation. Variable costs match volume, no infrastructure investment. Cost per return: $18-30 plus percentage of recovery value.
Return Shipping Options:
Prepaid Labels (Emailed): Customer prints label, drops at carrier. Cost: $5-12 depending on carrier negotiation and package size. Provides tracking, professional appearance, enables carrier rate shopping. Best for most e-commerce operations.
Return Portal with QR Codes: Customer receives QR code, brings item to carrier (UPS Store, FedEx Office, Walgreens, etc.). No printer required, reduces friction. Carrier scans code and generates label. Cost: similar to prepaid labels plus small technology fee.
Customer-Paid Returns: Buyer arranges and pays for return shipping. Reduces return rate 10-20%, saves $8-15 per return, but may hurt conversion and loyalty. Test with lower-margin products or high-return-rate items first.
International Returns: Complex and expensive. Options include customer-paid only (explicit in policy), local returns processing in major markets (partner with local 3PL), or store credit for simplified processing. International reverse logistics often costs $25-60 per return.
Carrier Selection and Consolidation:
Negotiate return rates separately from outbound shipping, volume and requirements differ. Major carriers (UPS, FedEx, USPS) offer dedicated return programs with discounted rates. Regional carriers may offer lower rates for specific zones.
Consolidate returns: Instead of immediate processing, hold returns at carrier hubs and ship in bulk to your facility. Can reduce per-pound shipping cost 20-40% but adds 3-5 days to processing time. Balance savings against refund delay complaints.
Integration with Forward Logistics:
Return processing should complement your overall fulfillment strategy. Same warehouse handling both? Ensure adequate space, separate return receiving area, and workflow that doesn't disrupt outbound fulfillment during peak season. Your shipping strategy and pricing decisions for returns should align with your forward shipping approach to maintain customer experience consistency.
Split operations? Main warehouse handles outbound, separate facility handles returns? Works for high volume but requires inventory transfer systems and duplicate overhead.
Return Authorization (RA) Process
Structured RA workflow reduces fraud, improves data collection, and speeds processing. Manual, email-based returns cost 3-5x more to process than automated portal systems.
RA System Design:
Customer-initiated portal: Self-service return request with order lookup, reason selection, item condition photos, preferred resolution (refund, exchange, store credit). Automated approval for eligible returns, flagging for manual review when criteria not met.
Information collected:
- Order number and item SKU
- Return reason (doesn't fit, changed mind, defective, wrong item shipped)
- Detailed reason (size too small, color different than expected, etc.)
- Item condition with photos
- Refund preference
This data feeds product improvement, fraud detection, and inventory disposition decisions.
Reason Code Framework:
Structure return reasons for actionable insights:
Fit/Sizing Issues: Too small, too large, doesn't fit as expected Product Quality: Defective, damaged in shipping, poor quality vs. description Customer Preference: Changed mind, no longer needed, found better price Merchant Error: Wrong item shipped, wrong size sent, item not as described Style/Appearance: Color different than expected, style not as shown, material different
Avoid vague categories like "other" or "didn't like it", force specificity to enable analysis.
Approval Workflow:
Auto-Approve: Returns meeting all criteria (within window, eligible item, valid order, customer not flagged). Issue prepaid label immediately, process refund upon receipt. 70-85% of returns should auto-approve.
Manual Review: Returns outside window, high-value items, customers flagged for fraud, discrepancies in condition, serial returners. Customer service reviews request, approves with conditions (restocking fee, store credit only) or denies with explanation. 10-20% require review.
Auto-Deny: Returns outside policy (final sale items, outside window with no exceptions, items marked non-returnable). Provide clear denial reason and policy reference. 5-10% denied.
Tracking and Communication:
Automated updates at each stage:
- RA request received (confirmation email)
- RA approved with prepaid label (include return instructions)
- Return shipped (tracking notification)
- Return received at facility (inspection timeline)
- Refund processed (method and timing)
Reduces "where's my refund?" customer service contacts 50-70%.
Batch Processing vs. Individual Handling:
Individual processing: Each return handled immediately upon arrival. Higher labor cost but faster refunds and better experience. Necessary for high-value items or customer service recovery.
Batch processing: Returns accumulated and processed in scheduled batches (daily, every other day, weekly). Reduces labor cost 20-40% through efficiency but delays refunds. Balance batch size with refund timeline promises.
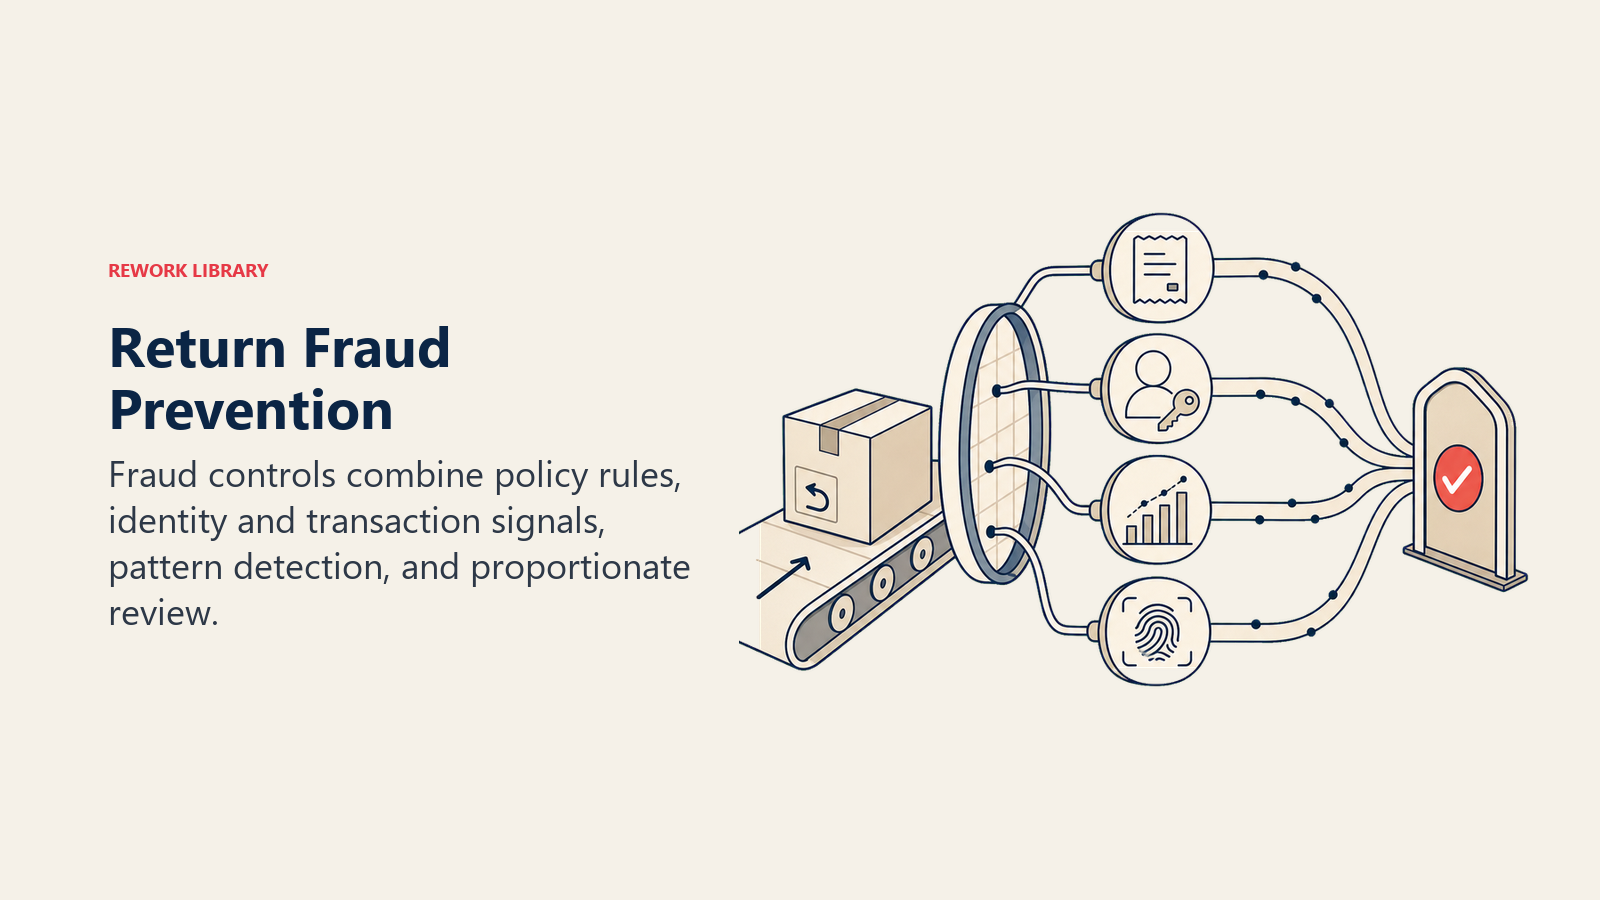
Fraud Prevention & Return Abuse
Return fraud and abuse cost retailers $24 billion annually. Serial returners, wardrobing, and fraudulent claims erode margins without proper detection and enforcement.
Fraud Patterns:
Wardrobing: Buying items for temporary use (event, photo shoot, testing) then returning. Common in apparel, accessories, electronics. Detection: Photos show wear/use, tags removed and reattached, packaging opened carefully, returns consistently 1-2 days before window closes.
Serial Returners: Customers with return rates >50-80%, often buying multiple sizes/colors with intention to return most. Detection: Return rate, frequency, value of items kept vs. returned, brief holding periods before return.
Receipt Fraud: Using stolen credit cards, returning items for refund or store credit, washing money. Detection: New customer with high-value first order, immediate return request, shipping and billing address mismatch.
Item Swapping: Returning counterfeit, damaged, or different items in original packaging. Detection: Serial number mismatch, weight discrepancies, inspection reveals substitution.
Friendly Fraud: Claiming item not received, damaged, or defective when not true. Detection: Tracking shows delivery, photos from delivery service, inconsistent damage claims, multiple claims from same customer.
Risk Scoring System:
Assign risk scores based on:
- Return rate (% of orders returned)
- Return frequency (# returns in 90 days)
- Order/return patterns (ordering multiple, keeping one)
- Time between delivery and return
- Customer tenure and total spend
- Return reasons consistency
- Photo/documentation quality
Low risk (0-30 points): Auto-approve, standard processing Medium risk (31-60 points): Manual review, additional documentation required High risk (61-100 points): Strict inspection, store credit only, possible account restriction
Verification Requirements by Risk Level:
Low Risk: Standard photos, reason selection Medium Risk: Detailed photos (multiple angles), video unboxing for electronics, serial number verification High Risk: In-person return (retail location), third-party inspection before refund, prepayment required for exchanges
Policy Enforcement:
Clearly state consequences in policy: "We reserve the right to refuse returns from customers with excessive return rates or suspected fraud. Accounts may be restricted or closed for policy violations."
Implement graduated enforcement:
- Warning email for high return rate (>40% over 6 months)
- Store credit only for customers exceeding 50% return rate
- Account restriction or closure for confirmed fraud
Document everything. State laws vary on retailer rights to ban customers or refuse returns.
Chargeback Management:
Customer disputes refund or claims item not received/defective. Fight chargebacks with:
- Delivery confirmation with signature for high-value items
- Return tracking showing receipt at your facility
- Inspection photos showing item condition
- Communication history
- Return policy acceptance proof (checkbox at checkout)
Win rate improves 40-60% with proper documentation vs. fighting without evidence.
Protecting Margins Without Destroying Experience:
Balance fraud prevention with customer trust. Aggressive anti-fraud measures (requiring videos, multiple photos, lengthy inspections) reduce fraud but hurt conversion and loyalty.
Segment approach: Trusted customers get streamlined returns, high-risk customers face additional verification. Protect your best customers from fraud-driven policy changes.
Product Inspection & Quality Assessment
Inspection determines item disposition (resell full price, discount, refurbish, liquidate, dispose), refund amount (full, partial, none), and product quality insights.
Inspection Criteria by Category:
Apparel/Fashion:
- Tags attached and intact
- No visible wear (pilling, stretching, staining)
- No odors (perfume, smoke, body odor)
- Original packaging if applicable
- All components present (belts, buttons, matching pieces)
Electronics:
- Original packaging unopened (higher resale value)
- All accessories present (cables, manuals, remote)
- Serial number matches order
- Powers on and functions properly
- No physical damage (scratches, dents, cracks)
Home Goods:
- Unassembled (furniture, if shipped in flat pack)
- No damage to item or packaging
- All hardware and components present
- No signs of use (tool marks, assembly attempts)
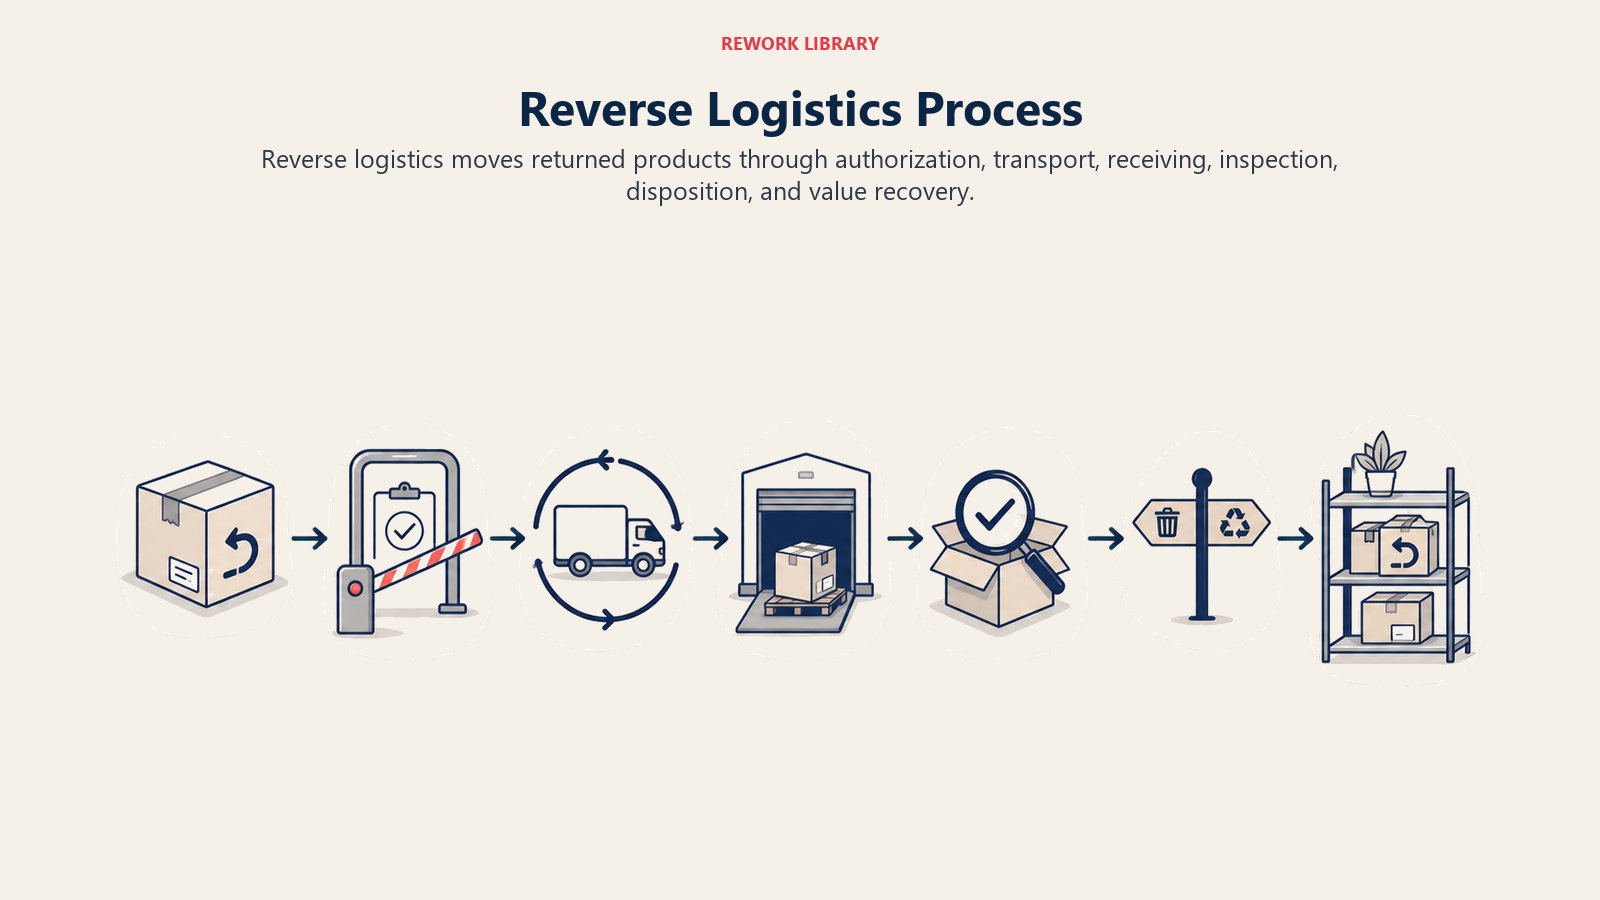
Inspection Process:
- Initial Receipt: Scan tracking number, match to RA, note external package condition
- Package Opening: Document packaging condition, check for obvious damage/tampering
- Item Inspection: Follow category checklist, take standardized photos (minimum 3 angles)
- Functionality Testing: Electronics powered on, zippers tested, defects verified
- Disposition Decision: Resell, refurbish, discount, liquidate, or dispose
- System Update: Record condition, disposition, photos; trigger refund workflow
Time Allocation:
Simple inspection (apparel, accessories): 2-4 minutes Standard inspection (most products): 4-8 minutes Complex inspection (electronics, furniture): 8-15 minutes
Labor cost at $15-20/hour: $0.50-5 per item depending on complexity.
Third-Party Inspection Services:
For high-value items (>$500), complex products (electronics), or high fraud risk, outsource inspection to specialists. Services charge $5-15 per item but provide detailed reports, certified condition assessment, and liability coverage.
ROI positive when preventing $200-500 in fraudulent refunds or improving resale value through proper grading.
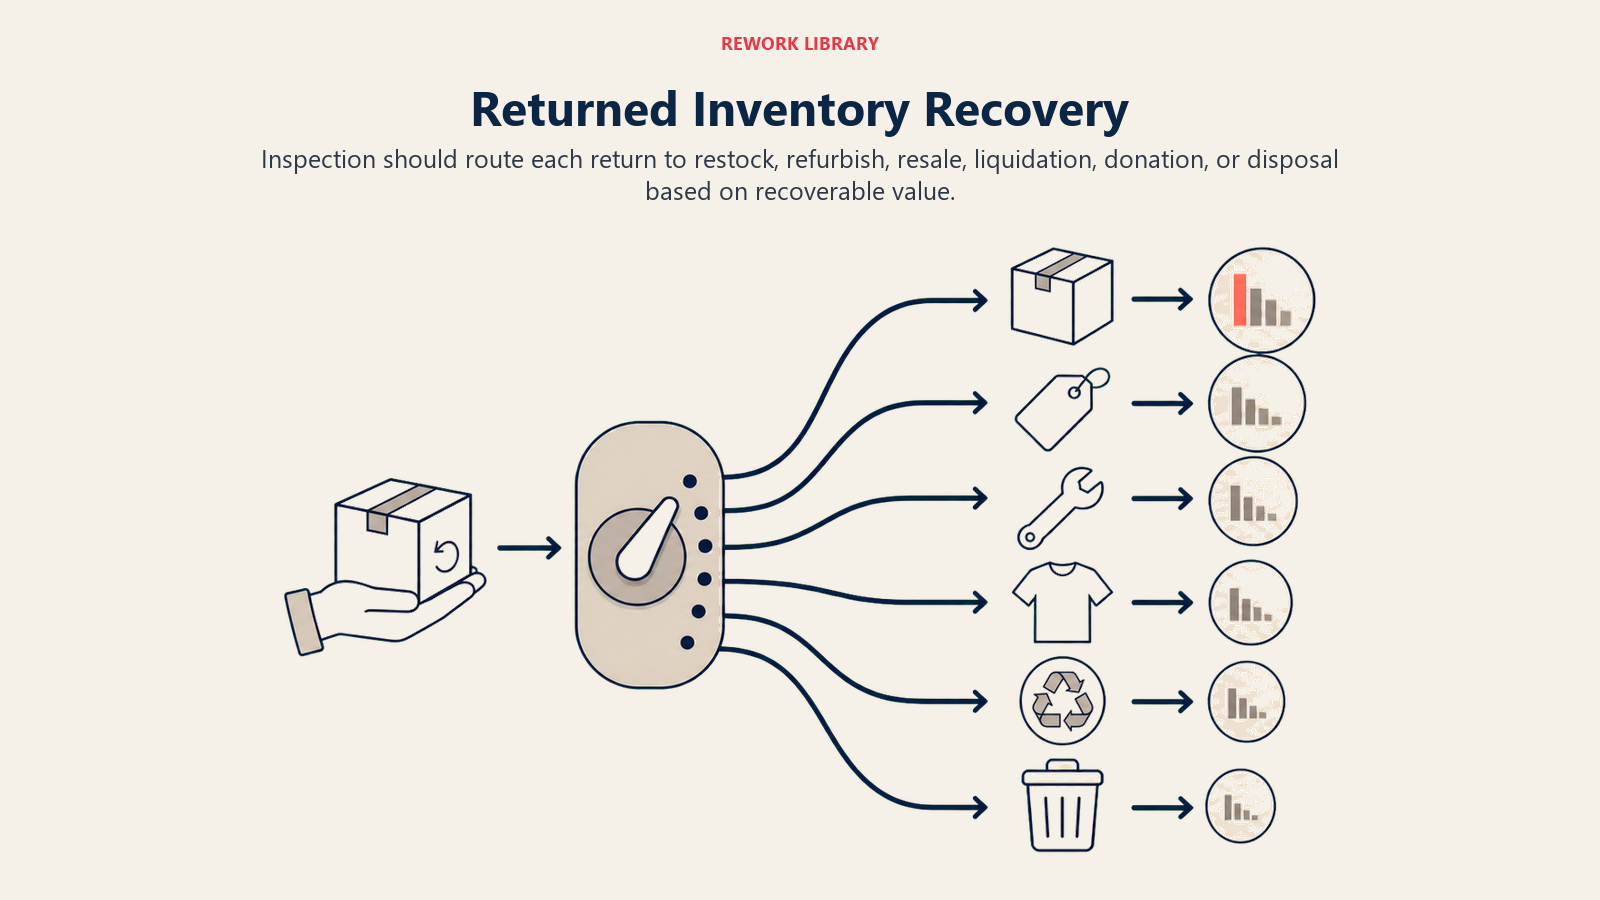
Tiered Disposition System:
Tier 1 - Resell Full Price: Perfect condition, all tags, unopened packaging. 40-60% of returns in well-managed operations.
Tier 2 - Resell Discounted (10-30% off): Slight imperfections, worn once, packaging opened but item perfect, tags missing. 20-30% of returns.
Tier 3 - Refurbish/Repackage: Missing components (replaceable), minor damage (fixable), packaging damaged but item fine. Economics: refurbishment cost vs. discount required. 10-20% of returns.
Tier 4 - Liquidate: Significant damage, missing parts, out of season, style discontinued. Sell to liquidators at 10-30% of cost. 5-15% of returns.
Tier 5 - Dispose/Donate: Unsellable, hygiene issues, severe damage. Write off completely. 5-10% of returns.
Quality Data Collection:
Track inspection outcomes by SKU, return reason, customer, and season. High return + defect rates for specific SKUs indicate supplier quality issues. Pattern of "doesn't fit" for specific sizes indicates sizing guide problems.
Feed this data to product development, supplier quality programs, and your product research and validation processes to improve future selection decisions.
Refund Processing & Customer Communication
Refund speed and method impact customer satisfaction, repeat purchase rate, and working capital. Balance customer experience with cash flow and fraud prevention.
Refund Timing Impact:
Immediate (upon return shipment): Highest satisfaction, builds loyalty, reduces customer service contacts. Risk: item damaged in transit or fraud. Use for trusted customers only.
Fast (1-2 days after receipt): Good balance of speed and verification. Requires efficient inspection workflow. Target for standard returns.
Standard (3-5 days after receipt): Allows thorough inspection, batch processing efficiency. Acceptable if communicated clearly. Default for most operations.
Slow (7+ days): Generates complaints, negative reviews, customer service load. Only acceptable for complex products requiring testing or third-party inspection.
Refund Method Options:
Original Payment Method: Standard expectation, legally required in many jurisdictions for credit card purchases. Processing time: 3-10 business days depending on bank. Customer sees as "fair" but ties up your working capital.
Store Credit (Instant): Issued immediately, encourages repurchase, improves cash flow. Offer incentive: 10-20% bonus credit to choose store credit over refund. Example: $80 purchase gets $88 store credit vs. $80 refund. Acceptance rate: 30-50% with proper incentive.
Exchange (Free Shipping): Cover outbound shipping for exchanges to encourage size/color swaps over returns. Retains sale, costs less than full refund + customer reordering separately. Acceptance rate: 20-40% when offered proactively.
Gift Card: Similar to store credit but transferable. Use for gifts, when original payment method unavailable, or as fraud prevention (limits money laundering).
Partial Refunds:
Used when item returned outside condition requirements but customer pushes back on full denial. Examples:
- Restocking fee (15-25%) for opened electronics, special orders, items outside window with exception approval
- Damage deduction: Return accepted but customer charged for cleaning, repair, missing components
- Shipping cost deduction: Customer-paid returns where you provide label but deduct from refund
Communicate clearly: "We've processed your return with a 20% restocking fee ($16) for the opened packaging. Your refund of $64 will appear in 3-5 business days."
Refund Status Communication:
Automated emails at key stages:
- Return received at facility (inspection in progress)
- Inspection complete (refund approved or issue flagged)
- Refund processed (method, amount, timing)
For issues: "We received your return but noticed [specific issue]. We're issuing a partial refund of [amount] due to [clear reason]. Questions? Reply to this email or call [number]."
Transparency reduces disputes and negative reviews.
Dispute Handling:
Customer disagrees with partial refund or denial. Process:
- Review inspection photos and notes
- Compare to stated policy and return reason
- Respond with specific explanation and evidence (photos)
- Offer compromise if appropriate (partial refund, store credit)
- Stand firm on clear policy violations but grant exceptions for good customers
Document all disputes. Patterns reveal policy clarity issues or inspection inconsistency.
Inventory Reintegration & Recovery
Returned inventory represents capital trapped in limbo. Efficient disposition recovers value and frees up working capital.
Disposition Workflow:
Immediate Restocking (Tier 1): Item inspected, passes all criteria, immediately returned to sellable inventory in your system. Process time: same day or next business day. Recovery rate: 100% of original value.
Refurbishment Queue (Tier 2-3): Items needing minor work (repackaging, cleaning, component replacement). Batch these for efficiency. Evaluate cost vs. recovery:
Refurbishment cost: $5-15 per item (labor, materials, packaging) Discount required: 10-30% off original price Net recovery: 70-90% of original value
Only refurbish if math works. $80 item with $10 refurbishment cost selling at $60 nets $50, vs. liquidating at $25. Refurbishment ROI: $25 additional recovery.
Liquidation (Tier 4): Items not economical to refurbish. Options:
Bulk Liquidators: Sell pallets to liquidation companies at 10-30% of cost. Fast, simple, but low recovery. Minimum volume usually required (pallet or truckload).
Secondary Marketplaces: List on eBay, Poshmark, Mercari, ThredUp, or dedicated liquidation sites. Higher recovery (30-60% of cost) but requires listing labor and platform fees.
Flash Sale to Email List: Offer returned/refurbished items at steep discounts to your customers first. Maintains brand control, builds loyalty, captures higher value than liquidators. Recovery: 40-70% of cost.
Staff Sales: Offer to employees at cost or cost + 10%. Builds morale, moves inventory quickly.
Donation (Tier 5): Unsellable items donated for tax deduction. Value: cost basis deduction (check with accountant). Also builds brand reputation and community goodwill.
Waste Disposal: Last resort. Track disposal rate to identify product quality issues or shipping problems.
Restocking Procedures:
Clean item and packaging (remove previous shipping labels, dust, marks) Verify all components present Replace damaged packaging Update inventory system (quantity, condition grade if applicable) Add to appropriate sales channel (website full price, discount section, liquidation)
Labor cost: $1-5 per item depending on complexity. Efficient restocking directly impacts your inventory management accuracy and ability to maintain optimal stock levels.
Secondary Market Economics:
$80 original retail item returned:
- Return processing cost: $25
- Refurbishment cost: $8
- Liquidation at 40% of cost ($32): Net recovery $32 - $33 = -$1
- Secondary market at 60% of retail ($48): Net recovery $48 - $33 = $15
- Flash sale to customers at 50% off ($40): Net recovery $40 - $33 = $7
Secondary market provides best recovery but requires marketing and inventory management. Evaluate based on volume and resources.
Sustainability Considerations:
Returns generate significant waste (packaging, shipping, unsellable items). Sustainability programs:
- Donate unsellable items to charities (Goodwill, local shelters, schools)
- Recycle materials (cardboard, plastics, electronics through e-waste programs)
- Refurbish and resell as "open box" or "like new" items
- Partner with circular economy platforms (ThredUp for fashion, Back Market for electronics)
Communicate sustainability efforts in marketing, consumers increasingly value responsible returns handling.
Technology Systems & Integration
Returns technology determines processing cost, speed, data quality, and customer experience. Manual returns processing costs 3-5x more than automated systems.
Return Management Software Categories:
Platform-Native Tools: Shopify, BigCommerce, WooCommerce built-in returns functionality. Basic RA creation, label generation, refund processing. Pros: Free, integrated with orders. Cons: Limited customization, basic reporting, minimal fraud detection.
Dedicated Returns Platforms: Loop Returns, Happy Returns, Returnly, Narvar, AfterShip Returns. Full-featured returns portals, advanced workflows, analytics, fraud detection. Cost: $50-500/month + per-return fees. ROI positive at 50+ returns/month.
3PL Returns Management: Careful 3PL partner selection often includes returns software as part of fulfillment services. Integrated with their inspection and disposition workflows.
Core Features Required:
Customer Portal:
- Order lookup (email + order number or account login)
- Item selection with reason codes
- Photo upload for condition documentation
- Refund preference selection (original method, store credit, exchange)
- Prepaid label generation
- Return tracking
Admin Workflow:
- RA approval/denial with rules engine
- Inspection recording with photos
- Disposition decision tools
- Refund processing (manual or automatic)
- Fraud flagging and customer risk scoring
- Performance dashboards
Integration Requirements:
E-commerce Platform: Sync orders, customer data, inventory, process refunds automatically
Warehouse Management System (WMS): Update inventory upon return receipt, track item location and disposition
Shipping Carriers: Generate prepaid labels, track returns in transit, negotiate return rates
Accounting System: Record refunds, inventory adjustments, revenue reversals, COGS updates
Customer Service Tools: Access return history, process exceptions, communicate status
Analytics Platforms: Feed return data to business intelligence tools for deeper analysis
API integrations prevent manual data entry, reduce errors, and enable real-time updates.
Label Generation and Tracking:
Automatic label creation upon RA approval reduces customer friction. Integration with carrier APIs enables:
- Real-time rate shopping (cheapest carrier for package size/destination)
- QR code generation for label-free returns
- Return tracking visibility in customer portal and admin dashboard
- Delivery confirmation triggering inspection workflow
Analytics Dashboards:
Real-time visibility into:
- Return rate by SKU, category, time period
- Average cost per return
- Processing time (RA to refund)
- Disposition outcomes (restock %, liquidation %, waste %)
- Fraud flags and high-risk customers
- Revenue impact (returned revenue, net recovery)
Track trends over time to identify seasonal patterns, product issues, or process improvements.
Technology ROI Framework:
Calculate annual returns volume and current cost:
- 500 returns/month = 6,000/year
- Current cost per return: $35 (manual processing)
- Annual cost: $210,000
Technology investment:
- Platform fee: $300/month = $3,600/year
- Per-return fee: $0.50 × 6,000 = $3,000/year
- Total: $6,600/year
Efficiency gains:
- Reduced processing cost: $10/return savings
- Annual savings: 6,000 × $10 = $60,000
Net ROI: $53,400 savings (80% cost reduction)
Break-even point: typically 40-60 returns/month depending on current inefficiency level.
Return Reasons Analysis & Product Improvement
Returns data reveals product problems, customer expectation gaps, and operational issues that, when fixed, reduce future returns and improve margins.
Categorizing Return Reasons:
Structured reason codes (from RA process) enable analysis:
Fit/Sizing (30-40% of apparel returns):
- Too small (specific size)
- Too large (specific size)
- Poor fit (style issue, not size)
Action: Update sizing charts, add fit guides, include measurements on product pages, offer virtual fitting tools.
Product Quality (10-20% of returns):
- Defective (specific defect type)
- Damaged in shipping
- Poor quality vs. expectations
Action: Supplier quality control, improved photography showing materials, enhanced product descriptions, packaging improvements.
Customer Preference (20-30% of returns):
- Changed mind
- Found better price
- No longer needed
Action: Consider policy adjustments (shorter window, restocking fees), improve product content to set accurate expectations.
Merchant Error (5-10% of returns):
- Wrong item sent
- Wrong size sent
- Item not as described
Action: Warehouse process improvements, SKU management, quality control checks, product content accuracy review.
Style/Appearance (15-25% of returns):
- Color different than expected
- Style not as photographed
- Material different than expected
Action: Improve product photography (multiple angles, lifestyle shots, detail close-ups), add videos, enhance color accuracy, detailed material descriptions.
Mining Data for Insights:
High-Return SKU Investigation:
Identify products with >40% return rates. Drill into reasons:
Example: Women's dress SKU #12345 has 55% return rate
- 70% returns: "Too small"
- 20% returns: "Color different than expected"
- 10% returns: "Changed mind"
Actions:
- Sizing issue: Runs small. Update sizing chart, add note "runs small, consider sizing up," offer free exchanges
- Color issue: Photography shows brighter blue than actual navy. Reshoot photos, update description
Expected outcome: Return rate drops to 30-35%, saving $50-80 per sale in return costs.
Feedback Loop to Product Development:
Build a comprehensive customer feedback loop that integrates returns data:
- Weekly return reason summaries by SKU
- Quarterly high-return product reviews
- Returns data sharing with suppliers (quality issues, sizing inconsistencies)
- Returns insights informing new product selection
Example: High return rate for third-party brand's sizing inconsistency leads to dropping brand or requesting sizing updates.
Sizing Guides and Fit Tools:
Fit issues drive 30-40% of apparel returns. Improvements:
Enhanced Sizing Charts: Detailed measurements (chest, waist, hip, inseam) for each size, not just S/M/L labels. Include measurement instructions.
Fit Recommendations: "Model is 5'8" and wearing size M" with model measurements listed.
Customer Review Integration: "Runs small - 85% of customers sized up" based on review data and returns.
Virtual Fitting Tools: Integration with fit technology (Bold Metrics, Fit Analytics) providing personalized size recommendations based on customer measurements. Reduces returns 10-25% but requires investment ($200-1,000/month).
Quality Control and Supplier Partnerships:
Share defect data with suppliers quarterly:
- Defect rate by SKU
- Specific defect types (stitching, material, functionality)
- Customer photos from returns
Work with suppliers to address issues. High defect rates may warrant switching suppliers or renegotiating terms to include quality guarantees.
Photography and Content Standards:
Return reasons "color different than expected" or "not as described" indicate content gaps:
- Professional photography with color-accurate images
- Multiple angles (front, back, side, detail shots)
- Lifestyle photography showing product in use
- Video content (especially for complex products)
- Detailed descriptions including materials, dimensions, features
- Customer review photos (real-world appearance)
Investment in content quality reduces expectation-mismatch returns 15-30%.
Scaling Returns Operations & Performance Management
Growth brings increasing returns volume. Plan infrastructure, team, and technology to scale efficiently.
Key Performance Indicators:
Return Rate: Returns / Orders
- Target: <20% overall, category-specific benchmarks
- Track by product, category, customer segment, season
- Trend analysis: increasing rates indicate product or expectation issues
Cost per Return: Total return costs / Number of returns
- Target: $15-25 depending on category
- Include all costs (shipping, labor, systems, shrinkage)
- Track improvement over time as you optimize processes
Processing Cycle Time: Days from return receipt to refund processed
- Target: 2-3 days for standard returns
- Faster cycle time reduces customer service contacts
- Monitor by return type and complexity
Restock Rate: Items returned to full-price inventory / Total returns
- Target: 60-75%
- Higher rates indicate good product quality and inspection standards
- Track by category and season
Fraud Rate: Fraudulent returns / Total returns
- Target: <2-3%
- Monitor flagged customers, chargebacks, confirmed fraud cases
- Balance fraud prevention with customer experience
Customer Service Contact Rate: CS contacts about returns / Total returns
- Target: <15%
- High rates indicate communication gaps or refund delays
- Track by contact reason to identify issues
Track these in dashboards with weekly/monthly/quarterly views. Monitor returns performance alongside your broader e-commerce metrics and KPIs for a complete operational picture.
Capacity Planning:
Returns volume correlates with sales volume but lags 7-30 days depending on shipping time and customer behavior. Plan staffing and space:
Monthly Returns Forecast:
- Orders this month × return rate × timing curve
- Add seasonal patterns (January spike from holiday purchases)
- Account for policy changes (extended windows increase volume in specific periods)
Space Requirements:
- Return receiving area (separate from outbound to avoid confusion)
- Inspection stations with lighting, tools, photography setup
- Holding areas for different dispositions (restock, refurbish, liquidate)
- Packing supplies and label printers
Staffing Model:
<100 returns/day: 1-2 people handling receiving, inspection, restocking (2-4 hours/day) 100-500 returns/day: 3-5 dedicated returns staff plus lead (full-time) 500-1,000 returns/day: 8-12 staff with specialized roles (receiving, inspection, restocking, customer service) 1,000+ returns/day: Dedicated returns facility with shift leads, quality control, specialized disposition teams
Team Structure:
Returns Specialist: Receives, inspects, updates systems, restocks Returns Lead: Oversees team, handles escalations, manages fraud cases, process improvement Returns Manager: Strategic planning, vendor management, performance analysis, policy development
Cross-train warehouse staff to handle returns during peak periods without dedicated headcount.
Outsourcing Considerations:
When to consider outsourcing returns processing:
- Returns volume >500/day (economies of scale kick in)
- Lack of warehouse space for dedicated returns operations
- Seasonal spikes make in-house staffing inefficient
- Need specialized services (refurbishment, liquidation management)
- Geographic distribution requires multiple return locations
3PL returns costs: $8-18 per item plus percentage of recovery value (5-15%). Compare to fully-loaded internal cost (labor, space, systems, overhead). Evaluate outsourcing alongside your broader 3PL partner selection criteria to ensure alignment with your overall logistics strategy.
Technology Roadmap:
Phase 1 (0-100 returns/day): Platform-native tools, manual inspection, simple spreadsheets Phase 2 (100-500 returns/day): Dedicated returns software, barcode scanning, automated refunds Phase 3 (500-1,000 returns/day): Advanced analytics, fraud detection systems, WMS integration Phase 4 (1,000+ returns/day): AI-powered inspection, predictive analytics, full automation where possible
Don't over-invest in technology before volume justifies it, but plan for scalability from the start.
Continuous Improvement Process:
Monthly returns performance reviews:
- Analyze KPI trends (rate, cost, cycle time)
- Review high-return SKUs and categories
- Audit sample of inspections for quality control
- Identify process bottlenecks
- Test improvements (policy tweaks, workflow changes, technology additions)
- Measure impact
Quarterly strategic reviews:
- Returns economics impact on overall margins
- Technology and team scaling needs
- Policy effectiveness (conversion impact, fraud trends)
- Product and supplier quality themes
- Long-term returns reduction initiatives
Returns management balances customer experience with profitability. The brands that win treat returns as a complete system, policy, operations, technology, and continuous improvement, not just a necessary cost. Optimize each component, measure religiously, and improve iteratively. Your return rate may never hit zero, but the efficiency of processing those returns and the insights gained can turn this cost center into a competitive advantage.
Learn More
Related Resources:
- Customer Retention Strategies - How your returns experience impacts long-term customer loyalty and repeat purchase rates
- Customer Feedback Loop - Systematically collecting and acting on returns insights to improve products and reduce future returns
- Fulfillment Strategy - Integrating reverse logistics with your overall fulfillment approach
- Inventory Management - Managing returned inventory and restocking procedures effectively

Senior Operations & Growth Strategist
On this page
- Returns Economics Foundation
- Return Policy Framework & Design
- Reverse Logistics & Return Fulfillment
- Return Authorization (RA) Process
- Fraud Prevention & Return Abuse
- Product Inspection & Quality Assessment
- Refund Processing & Customer Communication
- Inventory Reintegration & Recovery
- Technology Systems & Integration
- Return Reasons Analysis & Product Improvement
- Scaling Returns Operations & Performance Management
- Learn More