MRR Growth for Subscriptions: Expansion Revenue & Cohort Analysis Framework

Turn this article into takeaways for your work.
Each assistant summarizes the article only for you and suggests best practices for your work.
Here's the uncomfortable truth about subscription growth: Most companies obsess over acquiring new customers while leaving 40-60% of potential revenue growth completely untapped. They're running a leaky bucket operation, pouring resources into new MRR while existing customers quietly churn or remain stuck in entry-level plans forever.
The companies crushing it? They've cracked the expansion revenue code. They're growing Net Revenue Retention (NRR) to 120-130%, turning every cohort into a compounding revenue engine, and building businesses that grow faster from existing customers than from new ones.
This is your complete framework for MRR growth: the strategies, metrics, and operational playbooks that turn subscription businesses from linear growth machines into exponential revenue engines.
Understanding MRR: The Foundation of Subscription Growth
Monthly Recurring Revenue (MRR) is the normalized, predictable revenue your subscription business generates each month. It's not just total revenue divided by 12. It's the lifeblood metric that determines your valuation, guides your strategy, and reveals whether your business model actually works.
The MRR Formula:
MRR = (Number of Customers) × (Average Revenue Per Account)
But here's where it gets interesting. Your total MRR movement each month comes from four distinct sources:
MRR Movement Components:
- New MRR: Revenue from brand new customers
- Expansion MRR: Additional revenue from existing customers (upgrades, add-ons, volume increases)
- Contraction MRR: Lost revenue from downgrades or reduced usage (negative impact)
- Churned MRR: Lost revenue from cancelled subscriptions (negative impact)
Net New MRR Formula:
Net New MRR = New MRR + Expansion MRR - Contraction MRR - Churned MRR
Most early-stage subscription businesses see 70-80% of their growth come from New MRR. Mature, healthy subscription businesses flip this ratio, 50-60% of growth comes from Expansion MRR. That's the shift you need to engineer.
MRR vs ARR: When to Use Each
Annual Recurring Revenue (ARR) is simply MRR × 12. Use MRR when you have monthly contracts, high churn volatility, or need operational precision. Use ARR when you're communicating with investors, have annual contracts, or comparing against B2B SaaS benchmarks.
For e-commerce subscriptions, MRR is almost always the better operational metric because you need to react quickly to churn patterns and expansion opportunities.
Learn more about subscription economics in our guide to Subscription Model Design.
Expansion Revenue: The 40-60% Growth Opportunity
Expansion revenue is the holy grail of subscription growth because it has a near-zero customer acquisition cost (CAC). You've already paid to acquire the customer. Every dollar of expansion revenue falls almost entirely to the bottom line.

The Three Expansion Revenue Levers:
1. Upgrades (Tier Advancement)
Moving customers from lower-tier plans to higher-tier plans. This is the most straightforward expansion path but requires careful tier design.
Example Upgrade Path:
- Starter Plan: $29/month → Professional Plan: $79/month = +$50 Expansion MRR
- Professional Plan: $79/month → Enterprise Plan: $199/month = +$120 Expansion MRR
The key is creating clear value gaps between tiers that make upgrades feel necessary, not optional. The best trigger? Usage limits that customers actually hit.
2. Add-ons (Feature Expansion)
Selling additional features, modules, or services on top of base subscriptions. This works particularly well for product-based subscriptions in e-commerce.
E-commerce Add-on Examples:
- Base coffee subscription ($35/month) + Premium roast upgrade ($10/month)
- Skincare subscription ($45/month) + Tool kit add-on ($15/month)
- Meal kit subscription ($120/month) + Wine pairing ($30/month)
Add-ons are powerful because they don't require customers to change their core subscription. You're simply enhancing what they already love.
3. Cross-sells (Product Line Expansion)
Introducing customers to entirely new subscription lines or complementary product categories.
Cross-sell Example:
- Customer subscribed to vitamin supplements ($50/month)
- Cross-sell to protein powder subscription ($40/month)
- Total MRR per customer increases from $50 to $90
The secret to successful cross-selling? Wait until customers have experienced success with their first subscription (typically 60-90 days) before introducing complementary products.
Net Revenue Retention (NRR): The Expansion Metric That Matters
NRR measures how much revenue you retain and expand from existing customer cohorts over time, excluding new customer acquisition.
NRR Formula:
NRR = (Starting MRR + Expansion MRR - Contraction MRR - Churned MRR) / Starting MRR × 100
NRR Benchmarks:
- 90-100%: You're losing revenue from existing customers (warning sign)
- 100-110%: Break-even retention (expansion offsets churn)
- 110-120%: Good (expansion exceeds churn)
- 120-130%: Excellent (strong expansion engine)
- 130%+: World-class (you're in the top 5%)
The magic of 120%+ NRR: Your business grows 20% annually even if you never acquire another new customer. That's the power of expansion revenue.
For more on retention metrics, see our guide on Subscription Churn Management.
Downgrades & Downsell Management: Retention's Secret Weapon
Most subscription companies treat downgrades as failures. Smart operators recognize them as retention opportunities. A customer downgrading is infinitely more valuable than a customer churning.
The Downgrade Psychology:
When customers consider canceling, they're making a binary decision: stay or leave. When you offer a downgrade path, you're introducing a third option that keeps them in your ecosystem at reduced MRR rather than losing them entirely.
Strategic Downsell Framework:
1. Proactive Downgrade Offers
Identify at-risk customers before they cancel and present retention pricing:
Trigger Signals:
- Engagement dropping below baseline (50% reduction in usage)
- Payment failures increasing
- Support tickets indicating budget concerns
- Approaching subscription renewal date with low activity
Retention Offer Example: "We noticed you've been less active recently. Would switching to our Essentials plan at $29/month (instead of $79) work better right now?"
This approach typically saves 30-40% of at-risk customers who would otherwise churn.
2. Pause Options vs Downgrades
Give customers the option to pause their subscription (1-3 months) rather than cancel. This is particularly effective for seasonal products or during economic uncertainty.
Pause Success Metrics:
- 60-70% of paused subscriptions reactivate within 90 days
- Reactivated customers have 85% the LTV of never-paused customers
- Infinitely better than 100% churn
3. Win-Back Sequences
For customers who do cancel, create automated win-back campaigns with special pricing:
30-Day Win-Back: "Come back at 20% off for 3 months" 90-Day Win-Back: "Come back at your original price with a free premium add-on for 2 months"
Win-back campaigns typically recover 10-15% of churned customers at full or near-full MRR.
Measuring Downgrade Success:
Track your Downgrade Prevention Rate:
Downgrade Prevention Rate = (Customers Who Downgraded Instead of Churned) / (Total At-Risk Customers) × 100
Best-in-class subscription businesses prevent 35-45% of would-be churn through strategic downselling.
Pricing Optimization for MRR Growth
Your pricing strategy is either a growth accelerator or a growth ceiling. Most subscription businesses set prices once and never optimize, leaving massive expansion revenue on the table.
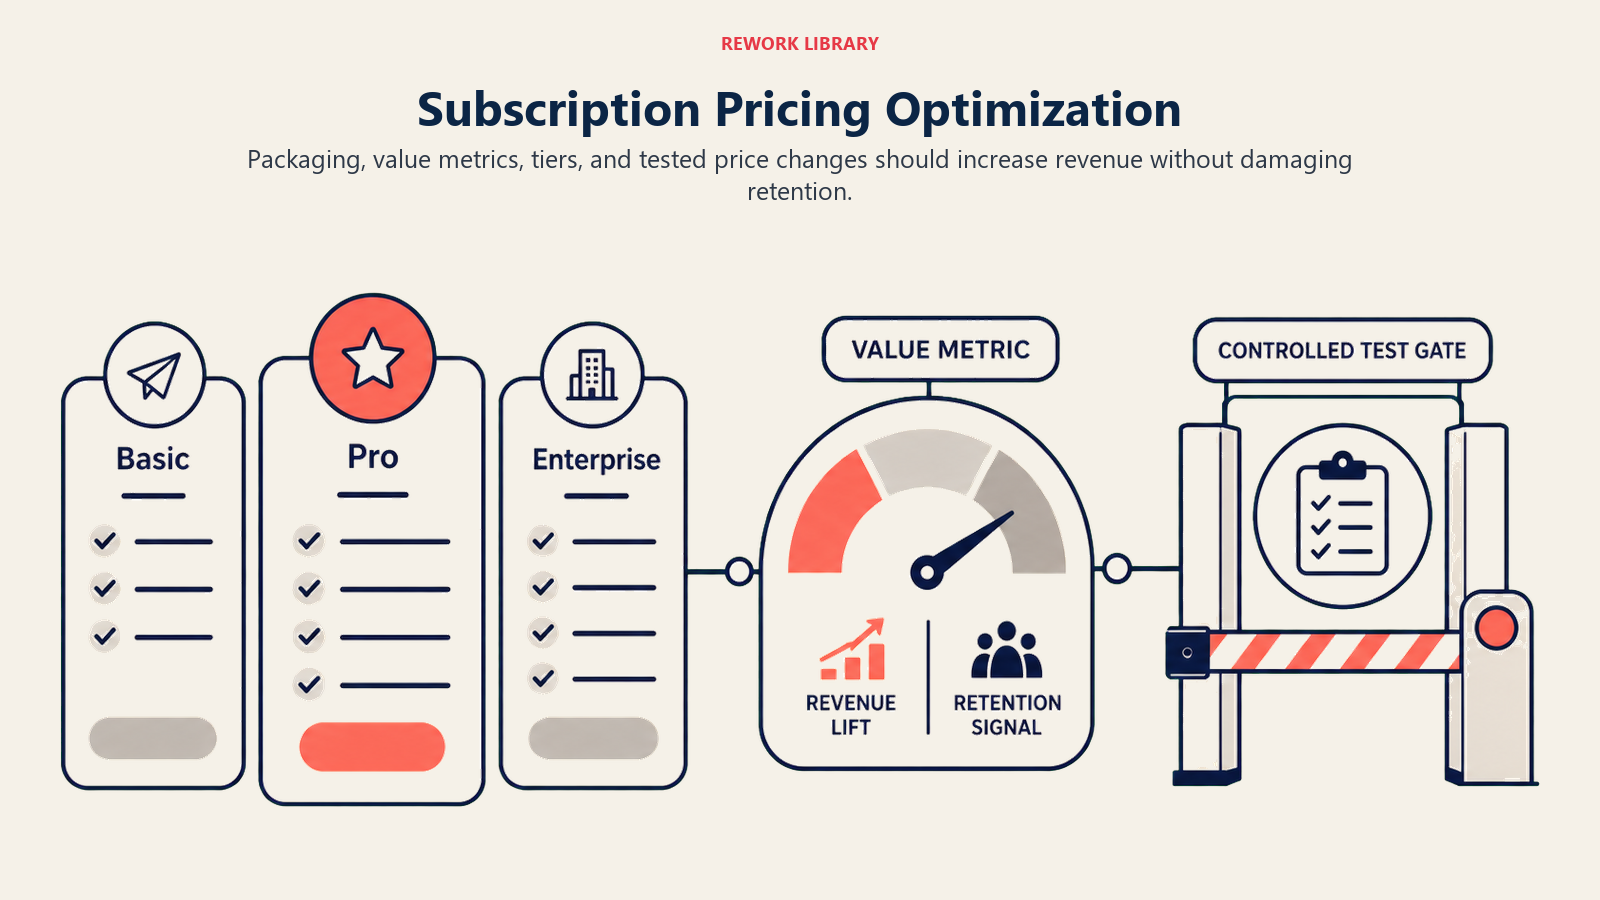
The Three Pricing Optimization Approaches:
1. Tier-Based Pricing (Good-Better-Best)
Structure your pricing tiers to naturally encourage upgrades as customers grow.
Optimal Tier Structure:
- Tier 1 (Starter): Entry point with clear limitations (volume, features, support)
- Tier 2 (Professional): 2.5-3x price of Tier 1, removes major friction points
- Tier 3 (Enterprise): 4-6x price of Tier 1, unlimited or very high limits
The goal: Make 40-50% of customers hit Tier 1 limits within 6 months, creating natural upgrade pressure.
2. Usage-Based Pricing
Charge based on consumption, ensuring your revenue scales automatically with customer value.
E-commerce Usage-Based Examples:
- Per-item pricing for product subscriptions
- Tiered pricing based on number of deliveries per month
- Variable pricing based on product customization level
Usage-based pricing drives 15-25% higher expansion MRR because revenue grows organically with customer engagement.
3. Hybrid Pricing Models
Combine base subscription fees with usage-based or feature-based add-ons.
Hybrid Example:
- Base meal kit subscription: $99/month (4 meals/week)
- Additional meals: $25/each
- Premium proteins: +$10 per meal
This model captures committed recurring revenue while enabling unlimited expansion potential.
Price Elasticity Testing:
Before changing prices, test elasticity with small cohorts:
- Increase prices for 10% of new signups by 10-15%
- Track conversion rate, churn rate, and net revenue impact
- Calculate elasticity: If revenue increases despite lower conversion, raise prices
Elasticity Decision Framework:
- Revenue increases by 10%+ → Roll out price increase to 100% of customers
- Revenue flat or slight decrease → Implement for new customers only
- Revenue decreases by 10%+ → Revert and test smaller increase
Most subscription businesses are under-priced by 20-40%. They're optimizing for conversion rate when they should be optimizing for customer lifetime value.
Learn more in our comprehensive guide to Pricing Strategy for E-commerce.
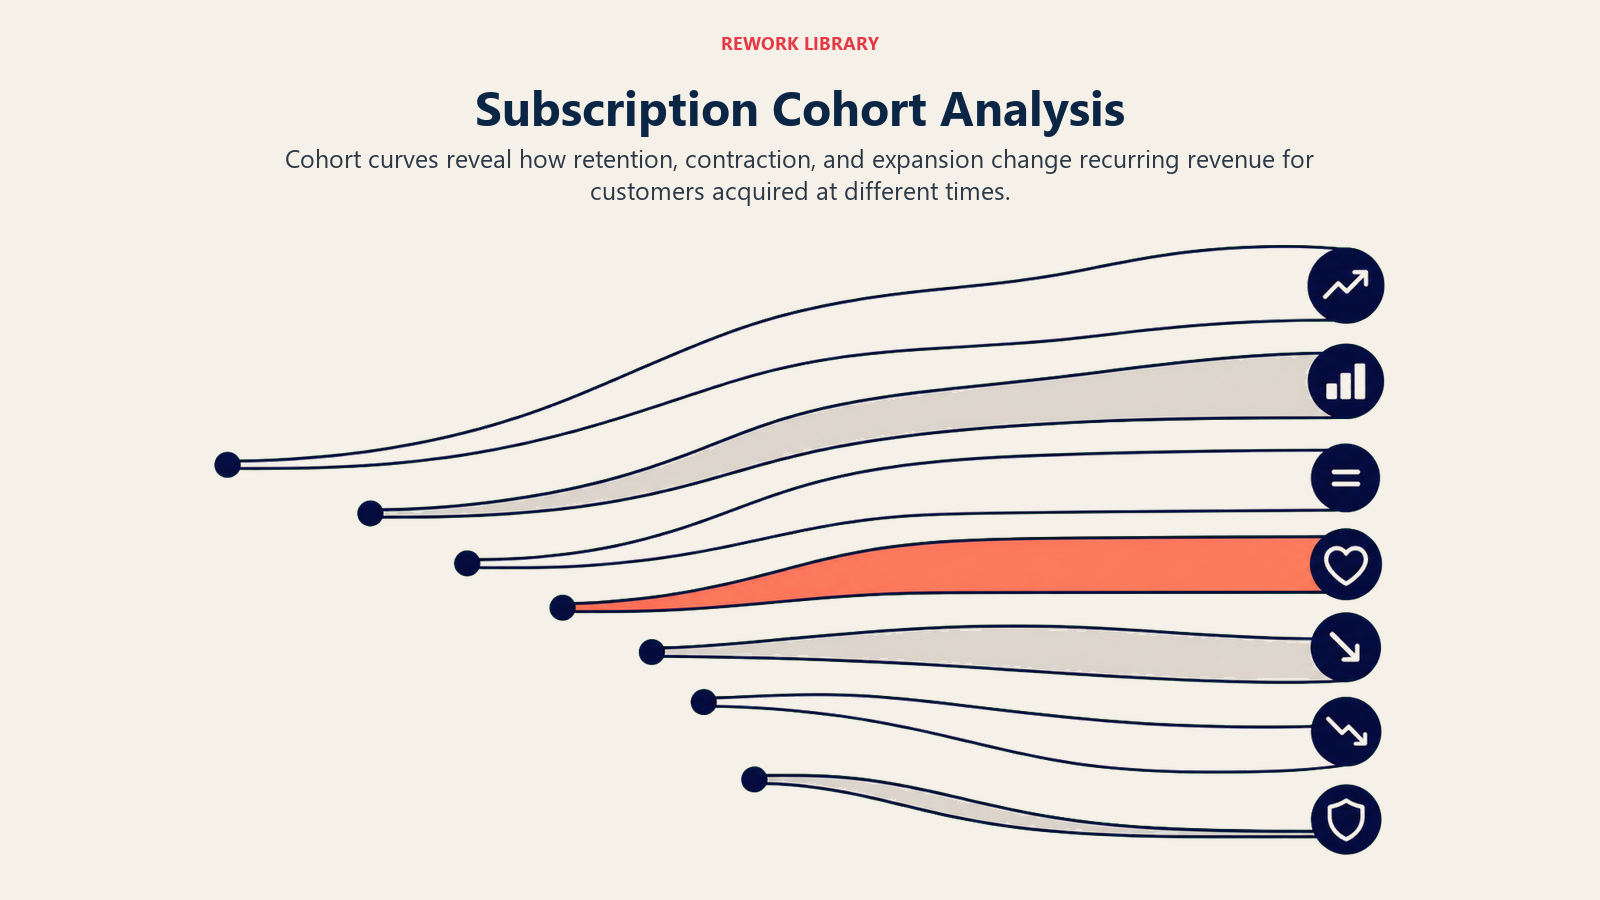
Cohort Analysis Framework: Understanding Your Revenue Engine
Cohort analysis is how you move from aggregate metrics (which hide problems) to precise diagnostics (which reveal opportunities). Every customer cohort tells a story, your job is to read it correctly.
Cohort Definition:
A cohort is a group of customers who share a common characteristic, typically their acquisition month or acquisition channel.
Example Cohorts:
- January 2024 Acquisition Cohort (all customers acquired in January 2024)
- Organic Search Cohort (all customers acquired through organic search)
- Holiday Campaign Cohort (all customers acquired during holiday promotion)
Key Cohort Metrics for MRR Growth
1. MRR per Cohort Over Time
Track how each cohort's total MRR evolves month-over-month.
Example Cohort MRR Tracking:
January 2024 Cohort:
- Month 1 (Jan 2024): $10,000 MRR (100 customers @ $100 avg)
- Month 3 (Mar 2024): $9,200 MRR (85 customers @ $108 avg)
- Month 6 (Jun 2024): $8,800 MRR (75 customers @ $117 avg)
- Month 12 (Dec 2024): $9,500 MRR (65 customers @ $146 avg)
This cohort shows healthy behavior: Despite churn reducing customer count by 35%, MRR only declined 5% because surviving customers expanded by 46%.
2. Cohort Revenue Retention Curve
Plot the percentage of original MRR retained over time:
Cohort NRR Curve:
- Month 1: 100%
- Month 3: 92%
- Month 6: 88%
- Month 12: 95%
When your 12-month retention exceeds your 6-month retention (like this example), you've built an expansion engine. Early churn is being offset by later expansion.
3. Expansion Rate by Cohort
Calculate what percentage of customers in each cohort have expanded their MRR:
Expansion Rate = (Number of Customers Who Increased MRR) / (Total Active Customers in Cohort) × 100
Benchmark Expansion Rates:
- 15-20% expansion rate by Month 6: Good
- 25-35% expansion rate by Month 12: Excellent
- 40%+ expansion rate by Month 18: World-class
Identifying Value Cohorts vs Churn Cohorts
Not all cohorts are created equal. Your goal is to identify which acquisition sources, time periods, or customer attributes produce high-value, low-churn cohorts.
Value Cohort Indicators:
- NRR above 110% by Month 6
- Expansion rate above 25% by Month 12
- Churn rate below 5% monthly
Churn Cohort Indicators:
- NRR below 90% by Month 6
- Expansion rate below 10% by Month 12
- Churn rate above 8% monthly
Strategic Response:
Once you identify value cohorts, allocate more budget to those acquisition channels. Once you identify churn cohorts, either fix the acquisition quality or stop investing in those sources.
Example: If your organic search cohort has 120% NRR while your paid social cohort has 85% NRR, you're likely attracting higher-intent customers from organic and discount-seekers from paid social. Adjust your strategy accordingly.
For more on tracking and analyzing these metrics, see our guide on Analytics & Tracking Setup.
Expansion Metrics Dashboard: What to Track Weekly
Aggregate MRR growth is a lagging indicator. You need leading indicators that tell you whether your expansion engine is working before it shows up in monthly revenue numbers.
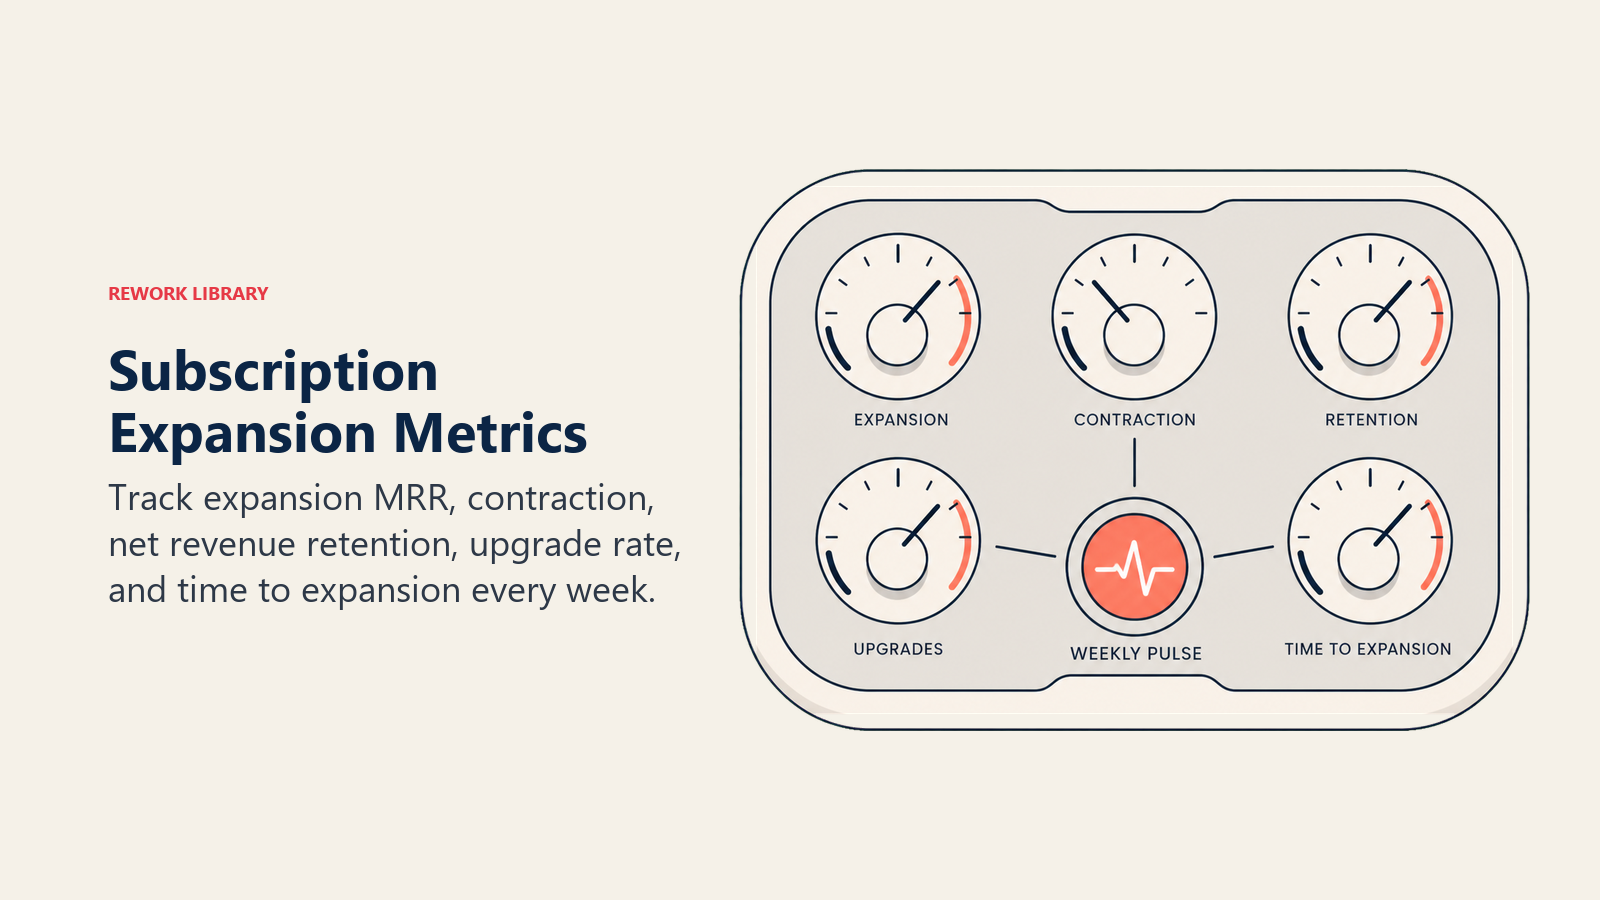
The 8 Essential Expansion Metrics:
1. Expansion MRR Rate
Expansion MRR Rate = (Expansion MRR This Month) / (Total MRR Start of Month) × 100
Target: 2-4% monthly
2. Expansion Percentage
Expansion % = (Customers Who Expanded This Month) / (Total Active Customers) × 100
Target: 3-6% monthly
3. Average Contract Value (ACV) Growth
ACV Growth = (Current Average MRR per Customer) / (Average MRR per Customer 90 Days Ago) - 1 × 100
Target: 5-10% quarterly
4. Upsell Conversion Rate
Upsell Conversion = (Customers Who Accepted Upsell Offer) / (Customers Presented Upsell Offer) × 100
Target: 15-25%
5. Add-on Attachment Rate
Add-on Attachment Rate = (Customers with 1+ Add-ons) / (Total Active Customers) × 100
Target: 30-50%
6. Time to First Expansion
Average days from signup to first MRR increase
Target: 60-90 days
7. Expansion Customer Retention
Retention rate of customers who have expanded vs non-expanded customers
Target: 20-30% higher retention for expanded customers
8. Contraction-to-Expansion Ratio
Ratio = Expansion MRR / Contraction MRR
Target: 2:1 or higher (twice as much expansion as contraction)
Dashboard Check-in Cadence:
- Weekly: Review expansion rate, upsell conversion, and contraction ratio
- Monthly: Analyze cohort NRR, ACV growth, and expansion percentage
- Quarterly: Deep-dive into cohort analysis and expansion program ROI
For a broader view of key subscription metrics, see our guide on E-commerce Metrics & KPIs.
Operational Expansion Programs: Turning Strategy Into Revenue
Metrics don't drive growth, programs do. Here's how to build operational expansion programs that systematically increase MRR from existing customers.
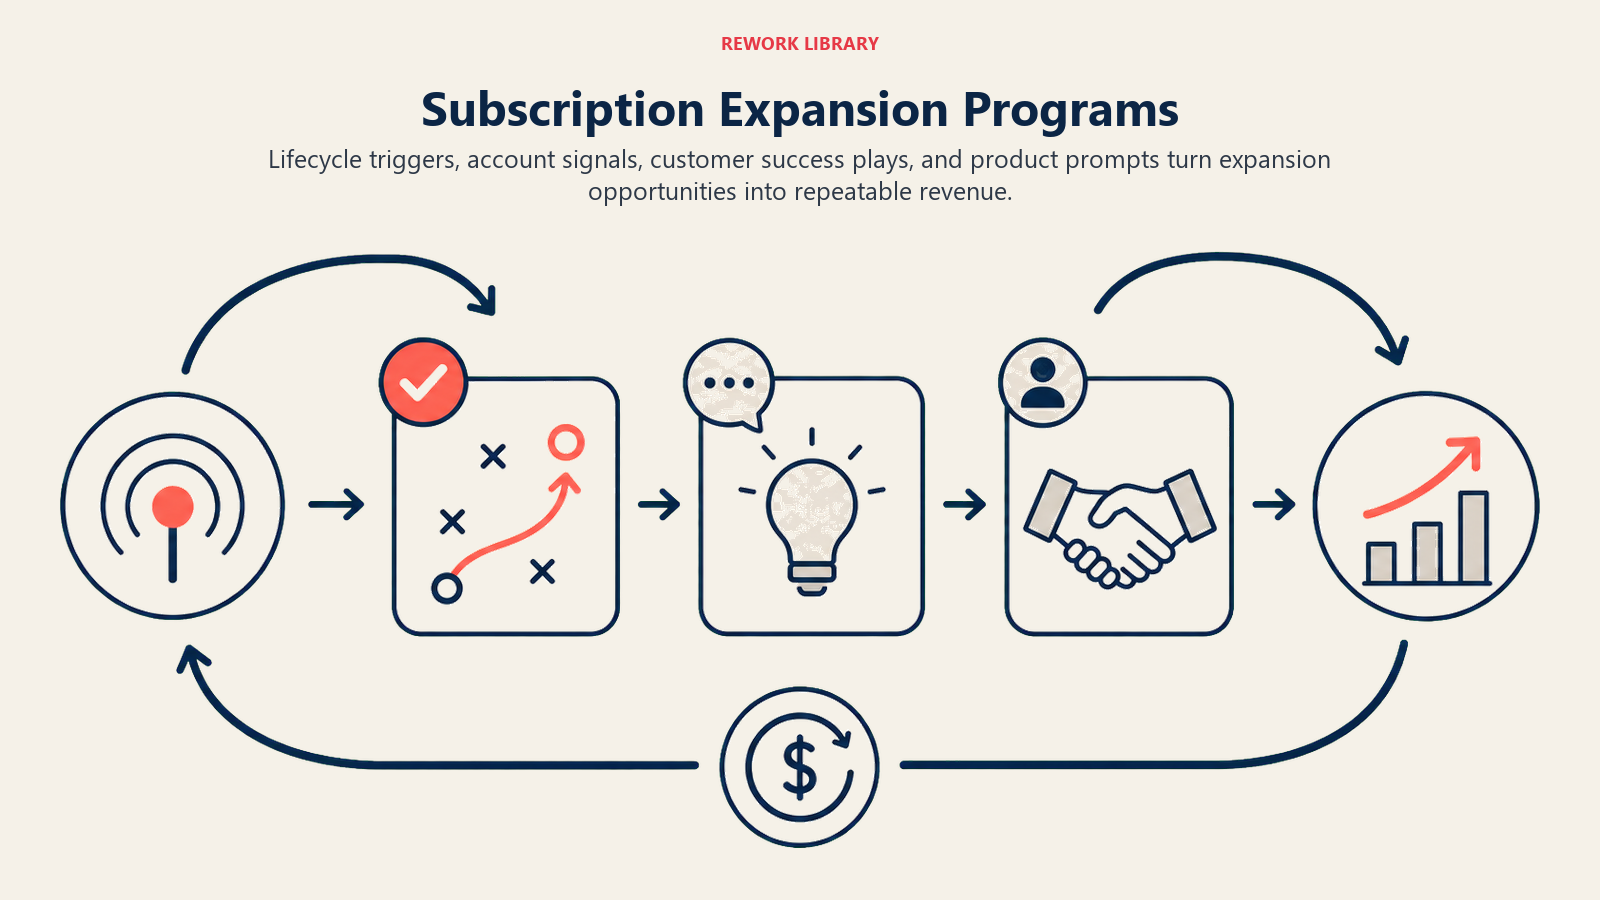
1. Account-Based Expansion (High-Touch)
For customers paying $200+/month or enterprise accounts, assign account managers responsible for expansion:
90-Day Expansion Playbook:
- Days 1-30: Onboarding success, ensure product-market fit
- Days 31-60: Usage analysis, identify expansion opportunities
- Days 61-90: Present personalized expansion recommendation with business case
Business Case Template: "Based on your current usage of X units/month, upgrading to our Professional plan would save you $Y annually while unlocking Z features you've requested in support tickets."
2. Automated Expansion Triggers (Low-Touch)
For customers paying $50-200/month, use automated triggers based on behavior:
Trigger Examples:
Usage Threshold Trigger:
- Customer hits 80% of plan limit
- Automated email: "You're growing! Here's 20% off an upgrade to ensure you never hit limits."
Feature Request Trigger:
- Customer requests feature available in higher tier
- Automated email: "Good news! The feature you asked about is included in our Pro plan."
Success Milestone Trigger:
- Customer completes onboarding milestones
- Automated email: "You're getting great results! Here's how Premium features could 2x your outcomes."
Best Practice: Test trigger timing. Most subscriptions see highest expansion conversion 60-90 days after signup, not earlier.
3. Educational Expansion Campaigns
Build content campaigns that naturally lead to expansion:
Campaign Example: "Maximizing Your Subscription Value"
- Email 1: How to use advanced features (that require upgrade)
- Email 2: Customer success story from higher-tier customer
- Email 3: Limited-time upgrade offer with discount
This "educate before selling" approach increases conversion rates by 40-60% compared to direct sales pitches.
4. Seasonal Expansion Windows
Create predictable expansion campaigns around customer lifecycle events:
- Subscription Anniversary: "Thanks for a great year! Upgrade now and save 25%"
- Renewal Period: "Renew at Professional tier and lock in this year's pricing"
- Product Launches: "New premium products available, add to your subscription"
Seasonal campaigns work because customers are already in an evaluation mindset during these windows.
For specific subscription program strategies, see our guide on Subscribe & Save Programs.
Advanced MRR Modeling: Forecasting Your Growth Engine
Once you understand your expansion metrics, you can build predictive models that forecast future MRR with 85-90% accuracy.
The MRR Forecasting Formula:
Forecasted MRR (Month N) =
  Current MRR × (1 - Monthly Churn Rate) +
  (New Customer Acquisition × Average New MRR per Customer) +
  (Active Customers × Expansion Rate × Average Expansion MRR)
Example Forecast:
Starting Position:
- Current MRR: $100,000
- Monthly Churn Rate: 5%
- New Customer Acquisition: 50 customers/month @ $100 avg MRR
- Expansion Rate: 3% of active customers/month @ $30 avg expansion
Month 1 Forecast:
$100,000 × (1 - 0.05) + (50 × $100) + (1000 × 0.03 × $30)
= $95,000 + $5,000 + $900
= $100,900 MRR
Scenario Planning:
Build three models based on different assumptions:
Conservative Scenario:
- Churn rate: Current rate + 1%
- Expansion rate: Current rate - 0.5%
- New customer acquisition: 80% of target
Base Case Scenario:
- All metrics at current rates
- New customer acquisition: 100% of target
Optimistic Scenario:
- Churn rate: Current rate - 1%
- Expansion rate: Current rate + 1%
- New customer acquisition: 120% of target
This gives you a revenue range that helps with budgeting, hiring, and investment decisions.
CAC Payback Period with Expansion:
Traditional CAC payback ignores expansion revenue. Advanced models include it:
CAC Payback (Months) = Customer Acquisition Cost / (Monthly MRR × Gross Margin × (1 + Average Monthly Expansion Rate))
Example:
- CAC: $300
- Initial Monthly MRR: $100
- Gross Margin: 70%
- Average Monthly Expansion Rate: 2%
CAC Payback = $300 / ($100 × 0.70 × 1.02)
= $300 / $71.40
= 4.2 months
Without expansion, payback would be 4.3 months. Small expansion rates compound to significantly faster CAC recovery.
Learn more about these economics in our guide to Unit Economics for E-commerce and Customer Lifetime Value (LTV).
Common Pitfalls & Solutions
Pitfall 1: Focusing Only on New MRR
The Problem: Most early-stage founders obsess over new customer acquisition while ignoring expansion opportunities from existing customers.
The Cost: Leaving 40-60% of growth potential untapped and building businesses with weak unit economics.
The Solution: Set explicit goals for expansion MRR. If 30% of your growth isn't coming from expansion by Year 2, you don't have a sustainable subscription business.
Pitfall 2: Ignoring Contraction MRR
The Problem: Celebrating expansion wins while downgrade losses silently erode net growth.
The Cost: Inflated expansion metrics that don't translate to actual MRR growth.
The Solution: Track Net Expansion MRR (Expansion MRR - Contraction MRR). Your goal is a 2:1 ratio, $2 of expansion for every $1 of contraction.
Pitfall 3: Premature Expansion Offers
The Problem: Pushing upgrades before customers experience value from their current plan.
The Cost: 60-70% lower conversion rates and damaged customer relationships.
The Solution: Wait until customers hit usage thresholds or success milestones. Data shows expansion offers convert 3x better when triggered by behavior rather than time alone.
Pitfall 4: One-Size-Fits-All Pricing
The Problem: Static pricing that doesn't evolve with customer value or market conditions.
The Cost: Under-monetizing high-value customers and over-charging price-sensitive segments.
The Solution: Implement cohort-based pricing. New customers get current pricing. Existing customers get grandfathered pricing. Test price increases with 10% of new signups quarterly.
Pitfall 5: Measuring MRR Without Cohorts
The Problem: Looking at aggregate MRR growth without understanding which cohorts drive it.
The Cost: Continued investment in acquisition channels that produce low-LTV, high-churn customers.
The Solution: Build cohort dashboards that show NRR by acquisition source, time period, and initial plan tier. Double down on what works, cut what doesn't.
The Path Forward: Building Your Expansion Engine
MRR growth isn't about finding one silver bullet, it's about building a system where every customer cohort becomes more valuable over time. Here's your 90-day roadmap:
Days 1-30: Foundation
- Implement proper MRR tracking (New, Expansion, Contraction, Churn)
- Build cohort analysis dashboard
- Calculate current NRR and expansion rates
Days 31-60: Expansion Programs
- Design tier structure optimized for natural upgrades
- Create automated expansion triggers (usage thresholds, feature requests)
- Launch first educational expansion campaign
Days 61-90: Optimization
- Test pricing elasticity with small cohorts
- Implement proactive downgrade offers for at-risk customers
- Set expansion MRR goals (target 30% of new growth from expansion)
The subscription businesses winning today aren't just acquiring customers, they're building compounding revenue engines where every cohort grows in value over time. That's the MRR expansion advantage.
Your existing customers are your greatest growth opportunity. It's time to unlock it.

Senior Operations & Growth Strategist
On this page
- Understanding MRR: The Foundation of Subscription Growth
- Expansion Revenue: The 40-60% Growth Opportunity
- 1. Upgrades (Tier Advancement)
- 2. Add-ons (Feature Expansion)
- 3. Cross-sells (Product Line Expansion)
- Downgrades & Downsell Management: Retention's Secret Weapon
- 1. Proactive Downgrade Offers
- 2. Pause Options vs Downgrades
- 3. Win-Back Sequences
- Pricing Optimization for MRR Growth
- 1. Tier-Based Pricing (Good-Better-Best)
- 2. Usage-Based Pricing
- 3. Hybrid Pricing Models
- Cohort Analysis Framework: Understanding Your Revenue Engine
- Key Cohort Metrics for MRR Growth
- Identifying Value Cohorts vs Churn Cohorts
- Expansion Metrics Dashboard: What to Track Weekly
- 1. Expansion MRR Rate
- 2. Expansion Percentage
- 3. Average Contract Value (ACV) Growth
- 4. Upsell Conversion Rate
- 5. Add-on Attachment Rate
- 6. Time to First Expansion
- 7. Expansion Customer Retention
- 8. Contraction-to-Expansion Ratio
- Operational Expansion Programs: Turning Strategy Into Revenue
- 1. Account-Based Expansion (High-Touch)
- 2. Automated Expansion Triggers (Low-Touch)
- 3. Educational Expansion Campaigns
- 4. Seasonal Expansion Windows
- Advanced MRR Modeling: Forecasting Your Growth Engine
- Common Pitfalls & Solutions
- Pitfall 1: Focusing Only on New MRR
- Pitfall 2: Ignoring Contraction MRR
- Pitfall 3: Premature Expansion Offers
- Pitfall 4: One-Size-Fits-All Pricing
- Pitfall 5: Measuring MRR Without Cohorts
- The Path Forward: Building Your Expansion Engine