Customer Lifetime Value (LTV): The Ultimate E-commerce Growth Metric
 Customer Lifetime Value (LTV) is the total net profit a customer generates over their entire relationship with your store, calculated as average order value times purchase frequency times customer lifespan times gross margin. It tells you exactly how much you can spend to acquire a customer, which channels produce your most valuable buyers, and whether your e-commerce growth is actually profitable or just busy.
Turn this article into takeaways for your work.
Each assistant summarizes the article only for you and suggests best practices for your work.
The billion-dollar question most e-commerce founders get wrong: which customers should you actually acquire?
Most answers sound like "everyone interested in our product" or "anyone we can get under our target CAC." Wrong. The right answer is: customers whose lifetime value exceeds their acquisition cost by at least 3x.
But there's a problem. 73% of e-commerce companies can't actually calculate their Customer Lifetime Value accurately. They're making million-dollar acquisition decisions based on gut feel, first-order metrics, or wildly optimistic assumptions about repeat purchases. Before diving into traffic acquisition strategy, you need to understand which customers are actually worth acquiring. That's not growth strategy. That's gambling.
If you want to build a sustainable e-commerce business with healthy unit economics, you need to understand LTV. Not as a vanity metric to put in pitch decks, but as the operational foundation that determines every dollar you spend on acquisition, retention, and growth.
What is Customer Lifetime Value (LTV)?
Customer Lifetime Value is the total net profit you expect to earn from a customer over their entire relationship with your business. It's the complete financial picture of a customer - every purchase they make, every dollar you spend serving them, and the margin you keep in between. The basic formula looks simple:
LTV = Average Order Value × Purchase Frequency × Customer Lifespan × Gross Margin
But that simplicity hides crucial complexity. Are you measuring gross LTV or net LTV? Historical LTV or predictive LTV? Cohort averages or customer segments? The details determine whether your LTV calculation drives smart decisions or catastrophic mistakes.
Why LTV is Your Most Important Metric
LTV isn't just another e-commerce metric to track. It's the metric that determines business viability.
LTV defines your acquisition ceiling. If your average customer is worth 120 dollars in lifetime profit, you can't sustainably spend 100 dollars to acquire them. The math doesn't work. Understanding your true LTV tells you exactly how much you can invest in growth.
LTV reveals your best customers. Not all customers are created equal. Some generate 5x the profit of others. LTV analysis by segment, channel, and cohort shows you where to focus your acquisition and retention efforts.
LTV predicts business trajectory. Rising LTV means improving retention, higher AOV, or better margins. Falling LTV signals churn problems, margin compression, or customer quality issues. It's your early warning system.
LTV enables strategic investment. Companies with high LTV can afford aggressive acquisition strategies, knowing they'll recoup costs over time. Low LTV businesses need ultra-efficient funnels and immediate profitability. Know which you are.
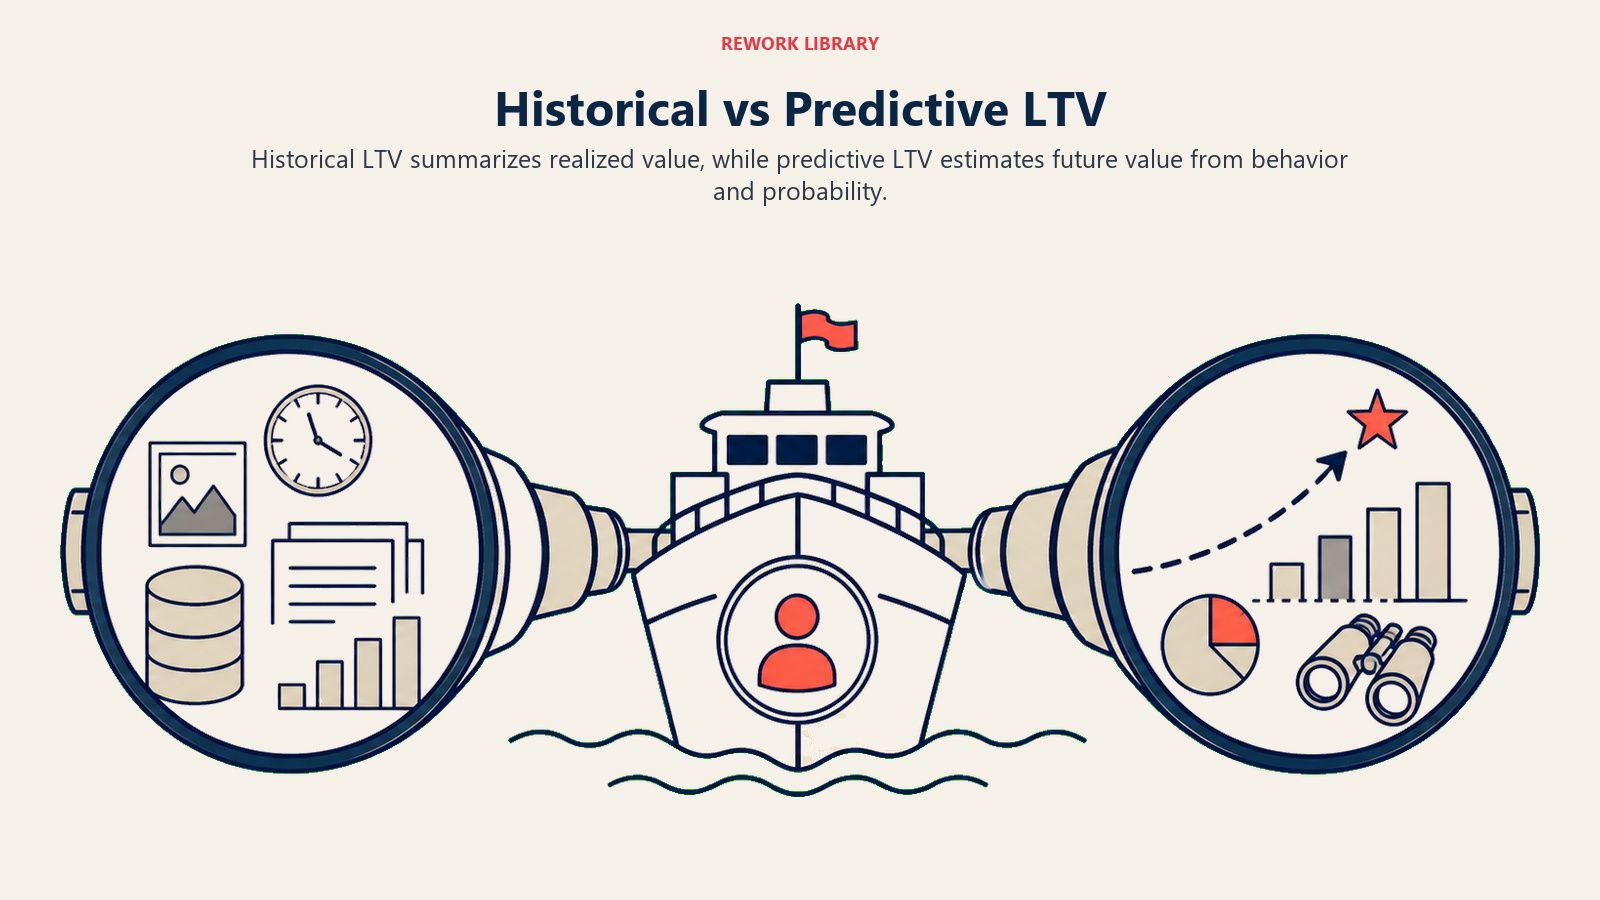
LTV Calculation Methods: Historical vs Predictive
There are two fundamentally different approaches to calculating LTV, and most companies confuse them.
Historical LTV (Backward-Looking)
Historical LTV measures what customers have already done. You look at cohorts of customers acquired 12-24 months ago and calculate the actual revenue and profit they've generated to date. Formula:
Historical LTV = (Total Revenue from Cohort ÷ Number of Customers) × Gross Margin
Example: You acquired 1,000 customers in January 2024. Through January 2026, they've generated 180,000 dollars in revenue at 40% gross margin.
Historical LTV = (180,000 ÷ 1,000) × 0.40 = 72 dollars
Strengths:
- Based on actual data, not projections
- Shows real customer behavior
- Useful for validating predictive models
- Great for post-mortem analysis
Weaknesses:
- Always lagging - tells you what happened, not what's happening
- Doesn't account for future purchases
- Can undervalue customers who are still active
- Requires waiting months or years for useful data
Use historical LTV to validate assumptions and benchmark actual performance. But don't use it for forward-looking decisions about acquisition spend.
Predictive LTV (Forward-Looking)
Predictive LTV estimates the total value a customer will generate over their complete lifetime, including future purchases you haven't seen yet.
Formula:
Predictive LTV = (AOV × Annual Purchase Frequency ÷ Churn Rate) × Gross Margin
Example: Your average order is 80 dollars, customers buy 3x per year, annual churn is 30%, gross margin is 40%.
Predictive LTV = (80 × 3 ÷ 0.30) × 0.40 = 320 dollars
This assumes customers continue their current behavior until they churn. It's predictive, not certain.
Strengths:
- Forward-looking and actionable now
- Enables real-time acquisition decisions
- Shows potential customer value
- Can be calculated for new cohorts immediately
Weaknesses:
- Based on assumptions that might be wrong
- Easy to manipulate with optimistic inputs
- Doesn't account for behavior changes over time
- Can create false confidence
Use predictive LTV for daily decisions and acquisition budgeting. But validate constantly against historical data.
The Hybrid Approach: Cohort-Based Predictive LTV
The smartest approach combines both methods. You use historical cohort data to build predictive models that are grounded in reality.
Track customer cohorts by acquisition month. For each cohort, measure actual LTV to date, then project forward based on retention curves and purchase patterns you've already observed.
Example: Your 12-month-old cohort has generated 85 dollars LTV so far. Based on retention rates, you estimate they'll generate another 45 dollars over the next 24 months before churn.
Total Predicted LTV = 85 + 45 = 130 dollars
This grounds predictions in actual behavior while accounting for future value. It's the best of both worlds.
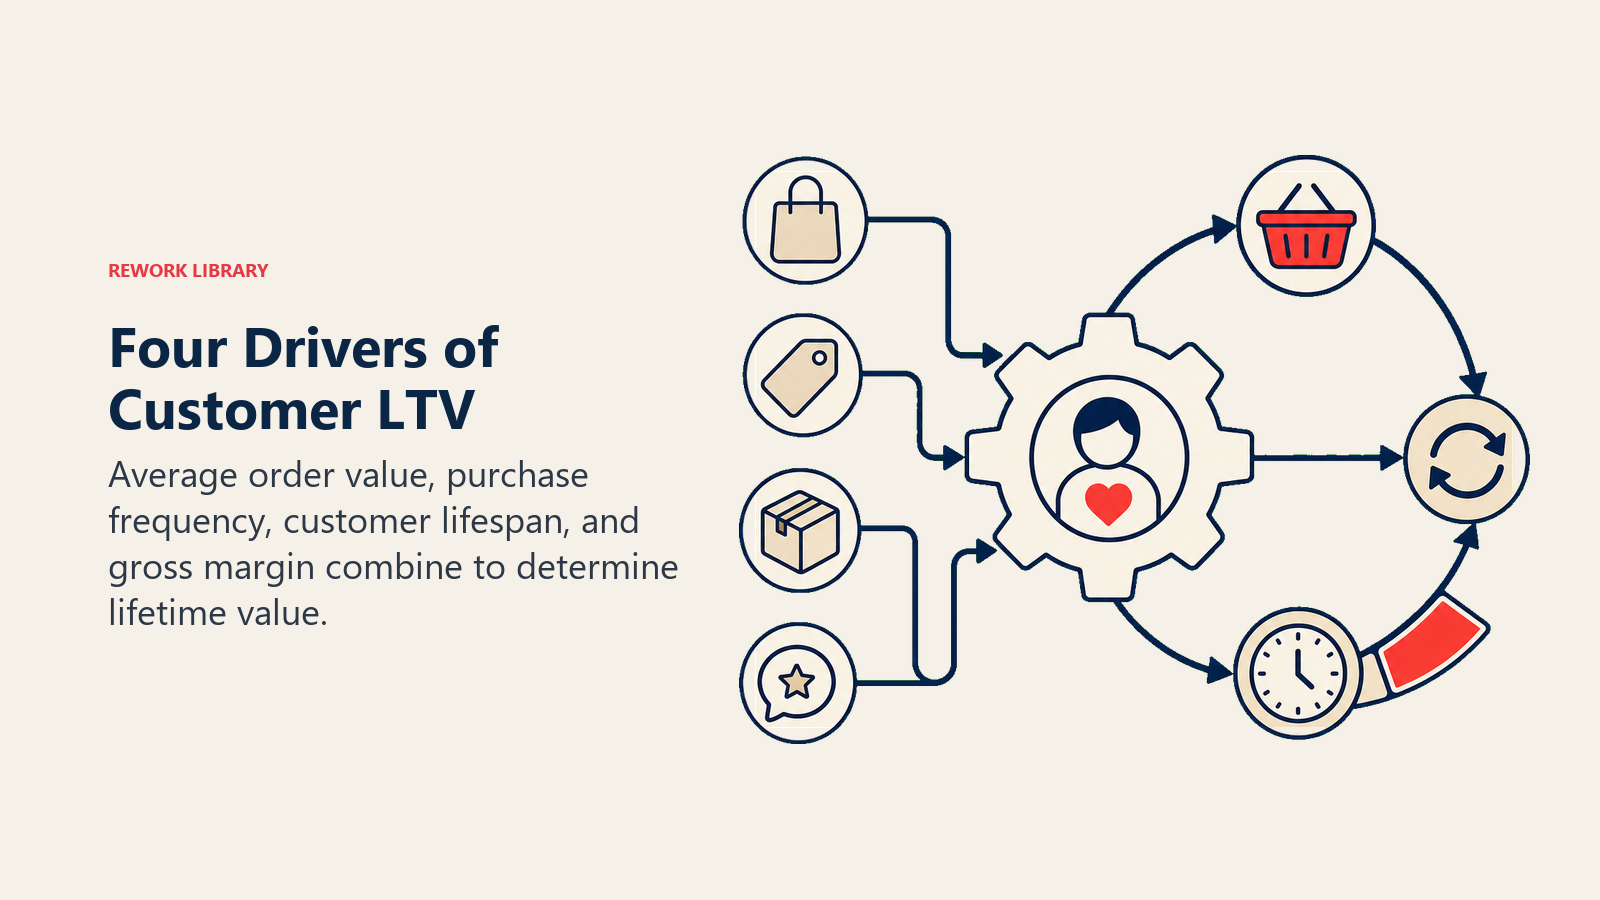
The Four Components That Drive LTV
LTV isn't a single lever - it's the product of four distinct components. Understanding each one helps you know where to focus optimization efforts.
Component 1: Average Order Value (AOV)
AOV is how much a customer spends per transaction. Increase AOV, and you increase LTV proportionally. Typical AOV by business model:
- Fashion/apparel: 60-100 dollars
- Beauty/cosmetics: 45-75 dollars
- Home goods: 80-150 dollars
- Electronics: 200-500 dollars
- Luxury goods: 300-1,000+ dollars
AOV optimization strategies:
- Product bundling and kits
- Tiered pricing structures
- Free shipping thresholds
- AOV optimization tactics like upsells and cross-sells
- Gift-with-purchase incentives
A 10% increase in AOV translates directly to a 10% increase in LTV, assuming other factors stay constant. That makes AOV one of the fastest levers to pull.
Component 2: Purchase Frequency
How often does a customer buy from you per year? This multiplier has enormous impact on LTV.
Typical purchase frequency by category:
- Consumables (coffee, supplements): 6-12x per year
- Beauty products: 3-6x per year
- Fashion/apparel: 2-4x per year
- Electronics: 0.5-1x per year
- Furniture: 0.2-0.5x per year
The gap between one-purchase customers and repeat buyers is massive. A customer who buys once has 1x value. A customer who buys 4x per year for 3 years has 12x value. This is why repeat purchase strategy matters so much.
Frequency drivers:
- Product consumability and replacement cycles
- Email marketing and lifecycle campaigns (covered in email marketing for e-commerce)
- Loyalty programs and rewards
- Personalization and recommendation engines
- Post-purchase engagement
Component 3: Customer Lifespan (or Retention Period)
How long does a customer stay active before churning? Lifespan is the inverse of churn rate.
Average Customer Lifespan = 1 ÷ Annual Churn Rate
If 25% of your customers churn per year, average lifespan is 4 years. If 50% churn per year, average lifespan is 2 years.
Typical retention/churn rates:
- Subscription boxes: 50-70% annual churn (1.4-2 year lifespan)
- Fashion e-commerce: 40-60% annual churn (1.7-2.5 year lifespan)
- Beauty/skincare: 30-50% annual churn (2-3.3 year lifespan)
- Consumables: 20-40% annual churn (2.5-5 year lifespan)
The relationship between retention and LTV is exponential, not linear. Improving retention from 50% to 60% doesn't increase LTV by 10% - it increases it by over 40%. This is why retention strategy is the highest-leverage growth driver.
For subscription businesses, understanding subscription churn management is critical to extending customer lifespan.
Component 4: Gross Margin
Gross margin is what you keep after cost of goods sold (COGS). It's the percentage that actually contributes to covering operating costs and generating profit.
Typical gross margins:
- Private label/DTC brands: 50-70%
- Dropshipping: 15-30%
- Wholesale arbitrage: 20-40%
- Manufacturing brands: 60-80%
- Digital products: 80-95%
LTV must be calculated on gross profit, not revenue. A customer who spends 500 dollars with 60% margins generates 300 dollars gross profit. That's your actual LTV ceiling before operating costs.
Why margin matters more than you think:
A 10% margin improvement has the same impact as a 10% increase in revenue, but it's often easier to achieve through:
- Negotiating better supplier terms
- Optimizing shipping and fulfillment
- Reducing product returns
- Increasing full-price vs discount sales (see pricing strategy for ecommerce)
- Improving product mix toward higher-margin items
LTV Benchmarks by Business Model
Context matters. A "good" LTV varies wildly depending on your e-commerce business model, industry, and customer acquisition strategy.
One-Time Purchase Businesses
These are businesses where most customers buy once and maybe return occasionally. Think furniture, mattresses, high-end electronics.
Typical metrics:
- Purchase frequency: 0.5-1.5x per year
- Customer lifespan: 2-4 years
- LTV: 1.5-3x first purchase value
- LTV:CAC ratio: 1.5-3x (lower than repeat models)
Strategic implications: These businesses need exceptional first-order economics. You can't rely on repeat purchases to recoup acquisition costs. Focus on maximizing AOV and conversion rate optimization rather than retention programs.
Repeat Purchase (Non-Subscription)
Traditional e-commerce where customers return to buy again, but without formal subscriptions. Fashion, beauty, home goods, pet supplies.
Typical metrics:
- Purchase frequency: 2-6x per year
- Customer lifespan: 2-4 years
- LTV: 4-12x first purchase value
- LTV:CAC ratio: 3-5x
Strategic implications: The gap between one-time and repeat customers is huge. Invest heavily in post-purchase engagement, email marketing, and retention. The majority of profit comes from the 20-30% who become repeat buyers.
Subscription Models
Recurring revenue businesses like subscription boxes, software-as-a-service, membership programs. Understanding subscription model design is critical for maximizing LTV in this category.
Typical metrics:
- Monthly retention rate: 85-95% (MRR churn: 5-15%)
- Customer lifespan: 1-3 years average
- LTV: 12-36x monthly subscription price
- LTV:CAC ratio: 3-5x (but longer payback period)
Strategic implications: High LTV enables aggressive acquisition, but cash flow timing matters. Payback period becomes critical - you need capital to fund growth until LTV is realized.
Marketplace Platforms
Multi-sided marketplaces where you connect buyers and sellers. Take rate and frequency drive economics.
Typical metrics:
- Transaction frequency: Varies widely (weekly for food delivery, quarterly for services)
- Customer lifespan: 2-5 years
- LTV: Highly dependent on take rate and frequency
- LTV:CAC ratio: 5-10x (needed to justify two-sided acquisition costs)
Strategic implications: Need high frequency and defensible retention to justify marketplace dynamics. Network effects are critical to economics.
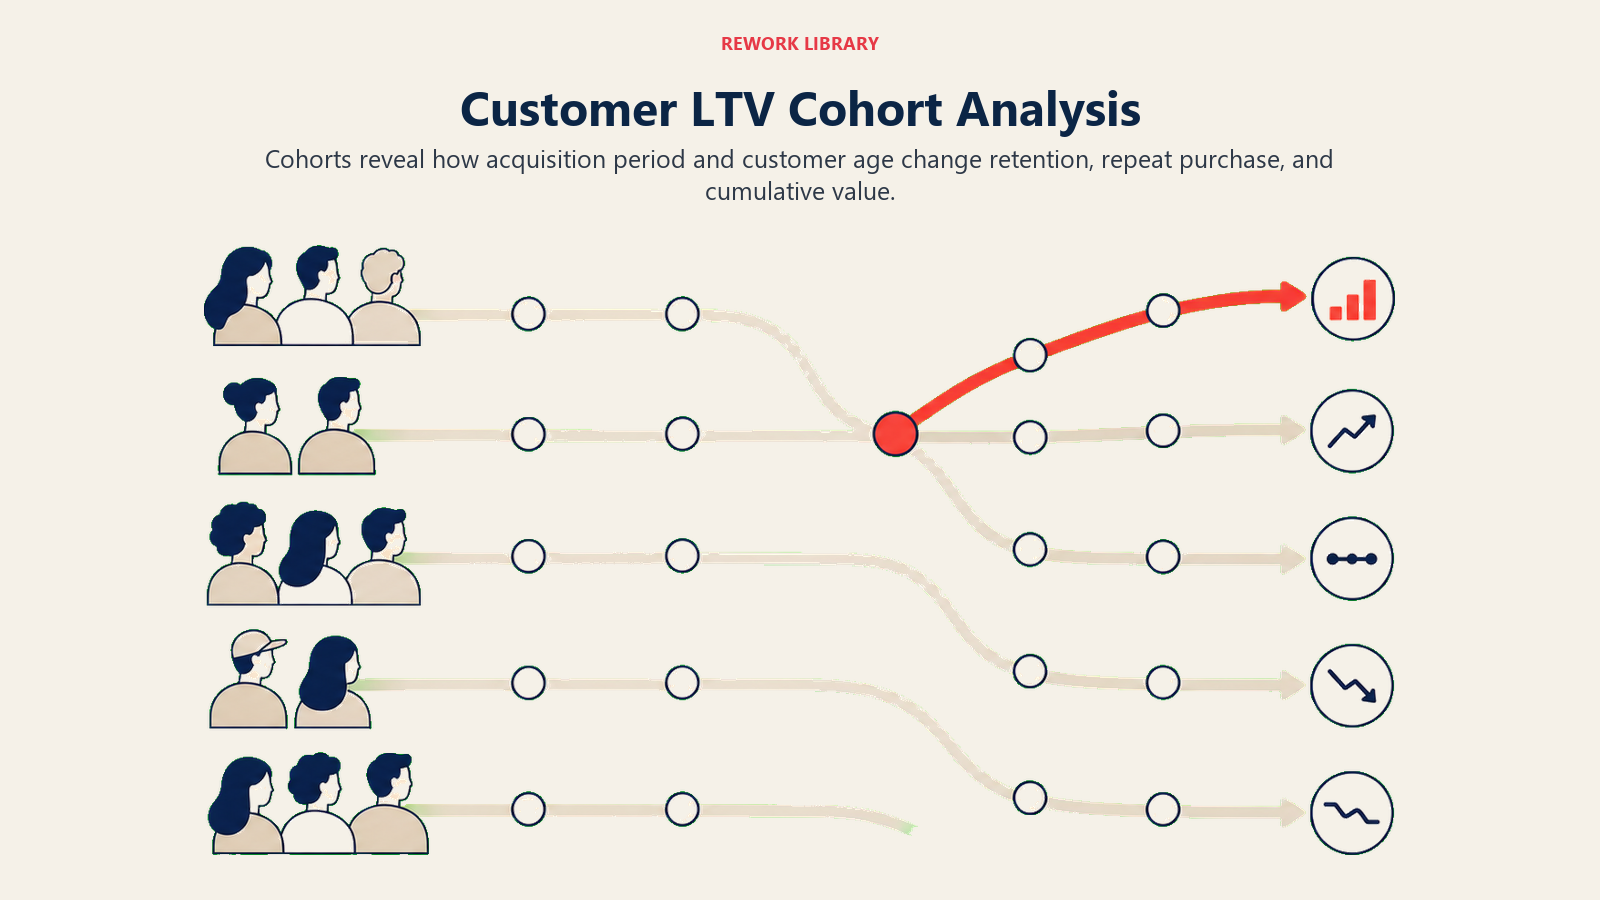
Cohort Analysis: The Key to Actionable LTV Insights
Average LTV across all customers is useful, but cohort analysis is where real optimization happens.
What is Cohort Analysis?
A cohort is a group of customers acquired during the same time period (usually monthly). Cohort analysis tracks how each group performs over time and compares them against each other. Why cohorts matter:
- Different acquisition channels produce different LTVs
- Customer quality changes over time
- Seasonal cohorts behave differently
- Product changes affect retention differently across cohorts
- You can spot trends before they impact aggregate metrics
Building Your Cohort Framework
Step 1: Define cohorts by acquisition month
Group customers by when they made their first purchase:
- January 2024 cohort: 1,247 customers
- February 2024 cohort: 1,563 customers
- March 2024 cohort: 1,892 customers
Step 2: Track LTV progression over time
For each cohort, measure cumulative LTV at 30 days, 60 days, 90 days, 6 months, 12 months, etc.
Example for January 2024 cohort:
- Month 1 LTV: 52 dollars (first purchase AOV × margin)
- Month 3 LTV: 68 dollars (15% made 2nd purchase)
- Month 6 LTV: 89 dollars (25% made 2+ purchases)
- Month 12 LTV: 124 dollars (35% still active, average 3.2 orders)
Step 3: Compare cohorts to spot trends
Are newer cohorts performing better or worse than older ones at the same age?
If your March 2024 cohort has 58 dollars LTV at month 3, but January 2024 had 68 dollars at month 3, that's a red flag. Something changed - customer quality, product mix, competition, or market conditions.
Segmenting Cohorts by Acquisition Channel
The real power of cohort analysis comes from segmenting by acquisition source. Not all customers are equal.
Example channel-based LTV comparison:
| Acquisition Channel | 30-Day LTV | 6-Month LTV | 12-Month LTV | Cost per Acquisition |
|---|---|---|---|---|
| Organic search | 62 dollars | 156 dollars | 278 dollars | 15 dollars |
| Email (owned list) | 58 dollars | 189 dollars | 312 dollars | 5 dollars |
| Facebook Ads | 48 dollars | 98 dollars | 145 dollars | 45 dollars |
| Instagram Influencer | 51 dollars | 112 dollars | 168 dollars | 38 dollars |
| Google Shopping | 55 dollars | 121 dollars | 187 dollars | 32 dollars |
This table tells you everything:
Organic search has the highest LTV and lowest CAC. Double down here.
Email marketing to your owned list has exceptional LTV with near-zero acquisition cost. Invest in list growth.
Facebook Ads has the worst LTV:CAC ratio (145:45 = 3.2x). Either improve creative to attract better customers, or reduce spend.
Google Shopping is solid - decent LTV with acceptable CAC. Scale sustainably.
Without cohort analysis, you'd just see blended metrics that hide these critical differences.
Identifying High-Value Customer Cohorts
Not every customer is worth the same. Within any cohort, there's a distribution:
- 20% are high-value (4-5x average LTV)
- 50% are average
- 30% are low-value (1-2x average LTV or one-time buyers)
The key is identifying what makes high-value customers different so you can acquire more of them.
Common high-LTV signals:
- Higher first-order value (80 dollar+ vs 40 dollar average)
- Faster time to second purchase (under 30 days vs 60+ days)
- Engaged with post-purchase email (40%+ open rate vs 15%)
- Specific product categories (skincare vs makeup, coffee vs tea)
- Certain demographic segments
- Referral source (customer referrals often have highest LTV)
Once you know these signals, you can optimize acquisition toward them and create specialized retention programs for high-value segments.
Retention's Exponential Impact on LTV
The most important thing to understand about LTV: small improvements in retention create massive improvements in lifetime value.
The Math That Changes Everything
Let's compare two scenarios with the same AOV and purchase frequency, but different retention rates:
Scenario A: 70% Annual Retention (30% churn)
- Customer lifespan: 3.3 years
- Annual orders: 3
- AOV: 80 dollars
- Gross margin: 40%
- LTV = 80 × 3 × 3.3 × 0.40 = 317 dollars
Scenario B: 80% Annual Retention (20% churn)
- Customer lifespan: 5 years
- Annual orders: 3
- AOV: 80 dollars
- Gross margin: 40%
- LTV = 80 × 3 × 5 × 0.40 = 480 dollars
A 10 percentage point improvement in retention (70% → 80%) created a 51% increase in LTV (317 → 480 dollars). That's the exponential effect.
Why Retention Multiplies Value
Every additional period a customer stays active creates compounding value:
Period 1: Customer generates margin on their purchases Period 2: They buy again, generating more margin, plus referrals become possible Period 3: Brand affinity strengthens, AOV often increases, referral likelihood rises Period 4+: Truly loyal customers buy full-price, resist discounts, forgive mistakes
Each retained period also has declining marginal cost. You've already paid the acquisition cost. Retention marketing is far cheaper than acquisition marketing. So the longer customers stay, the better your unit economics become.
Retention Improvements = LTV Growth
The fastest path to improving LTV isn't acquiring more customers. It's keeping the ones you have longer.
High-impact retention tactics:
- Post-purchase email sequences that drive 2nd order
- Subscription programs for consumable products
- Loyalty rewards that create switching costs
- Personalized replenishment reminders
- Win-back campaigns for at-risk customers
- Exceptional customer service that builds advocacy
Even a 5% improvement in retention can translate to 25-40% improvement in LTV, depending on your current baseline. That's why retention strategy deserves as much (or more) investment than acquisition.
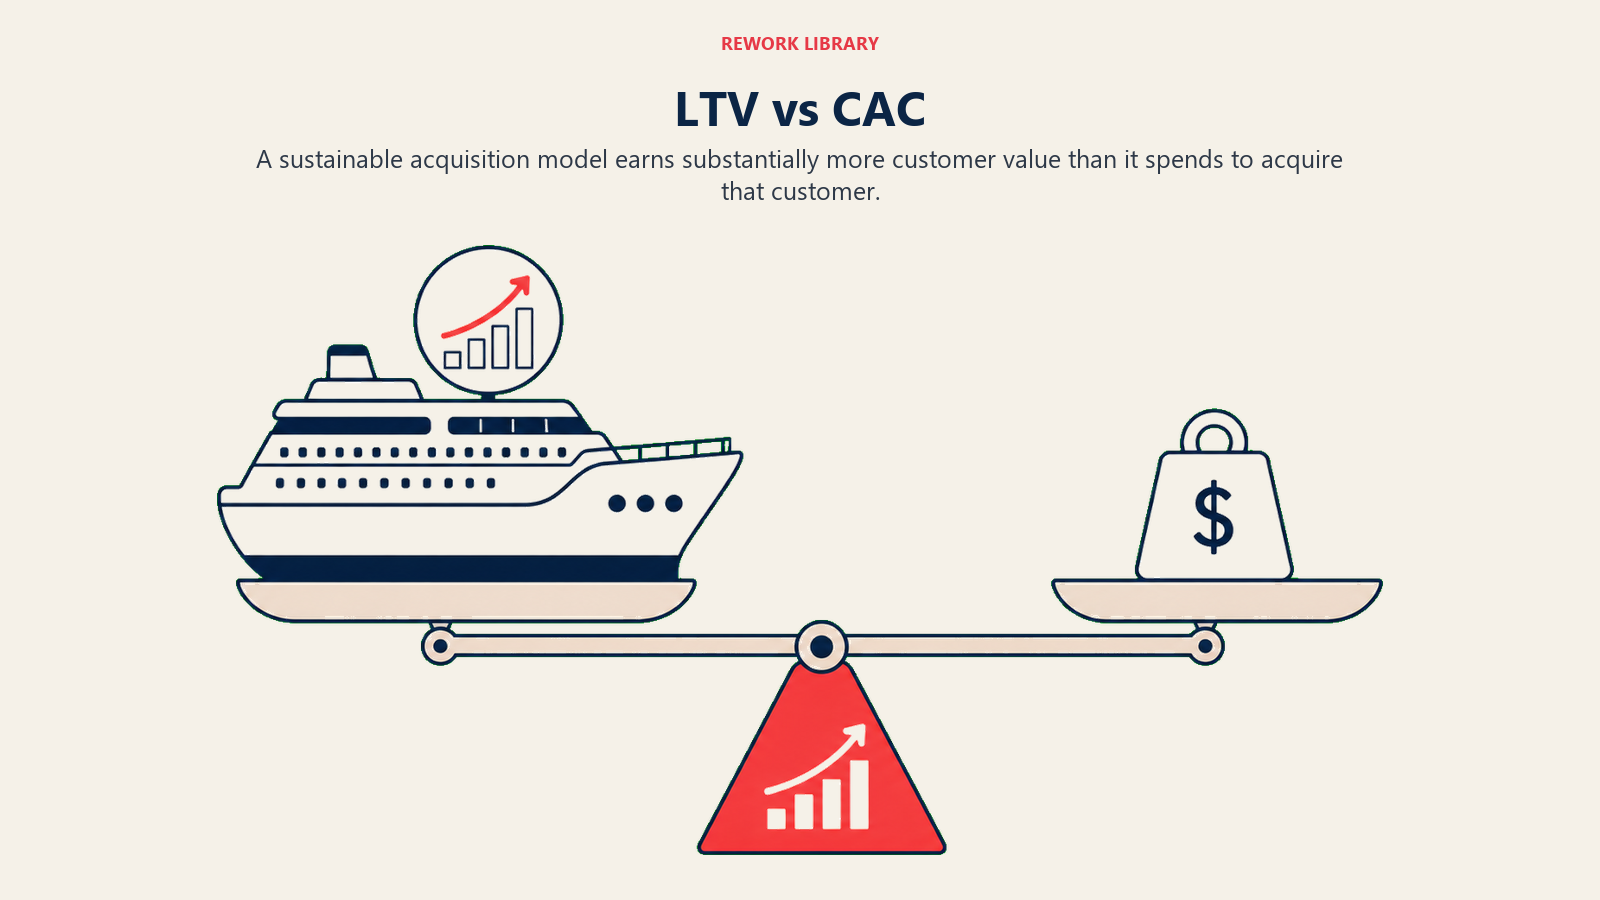
LTV vs CAC: The Profitability Equation
LTV means nothing in isolation. It only matters in relation to Customer Acquisition Cost (CAC).
The 3x Rule (Minimum Viability)
A healthy e-commerce business maintains at minimum a 3:1 LTV:CAC ratio.
LTV:CAC Ratio = Customer Lifetime Value ÷ Customer Acquisition Cost
Example:
- LTV = 240 dollars
- CAC = 60 dollars
- Ratio = 4:1 ✓ Healthy
Why 3x is the minimum:
After gross margin, you still have operating expenses:
- Marketing overhead (team, tools, agency fees): ~15-20% of CAC
- General overhead (ops, tech, support): ~20-30% of revenue
- Working capital needs for inventory and growth
A 3x ratio typically leaves 10-20% net margin after all costs. Below 3x, you're barely profitable or losing money.
LTV:CAC benchmarks:
- 5:1 or higher = Excellent, room for aggressive growth
- 3-5:1 = Healthy, sustainable growth
- 2-3:1 = Marginal, need to improve LTV or reduce CAC
- Under 2:1 = Unsustainable without external funding
CAC Payback Period: The Cash Flow Reality
Even with good LTV:CAC ratios, timing matters. How long until you recoup acquisition costs?
CAC Payback Period = CAC ÷ (Average Monthly Revenue per Customer × Gross Margin)
Example:
- CAC = 60 dollars
- Monthly revenue per customer = 25 dollars
- Gross margin = 40%
- Payback = 60 ÷ (25 × 0.40) = 6 months
Why payback period matters:
You spend 60 dollars today to acquire a customer who will generate 240 dollars lifetime value. But you don't get that 240 dollars today - it trickles in over 3 years. In month 1, you're negative 60 dollars. In month 6, you break even. In month 12, you're finally profitable on that customer.
If you're growing fast, you're constantly spending on acquisition before previous cohorts have paid back. That requires cash reserves or external capital.
Payback benchmarks:
- Under 6 months: Excellent, growth can be self-funded
- 6-12 months: Good, manageable with healthy cash flow
- 12-18 months: Requires capital to fund growth
- 18+ months: Challenging, need strong LTV confidence
Balancing Growth and Profitability
Your LTV:CAC ratio determines how aggressively you can grow:
High LTV:CAC (5:1+): You're leaving money on the table. Increase acquisition spend to capture more market share. Your economics support it.
Moderate LTV:CAC (3-5:1): Optimize carefully. Test new channels, improve existing ones, but watch payback period and cash flow.
Low LTV:CAC (2-3:1): Growth is expensive. Focus on improving LTV through retention and AOV before scaling acquisition.
Negative LTV:CAC: Stop acquiring customers until you fix unit economics. You're subsidizing every customer with investor money or debt.
The mistake most e-commerce brands make is optimizing for growth without ensuring the underlying economics work. They scale CAC spending based on blended returns without understanding cohort-level profitability.
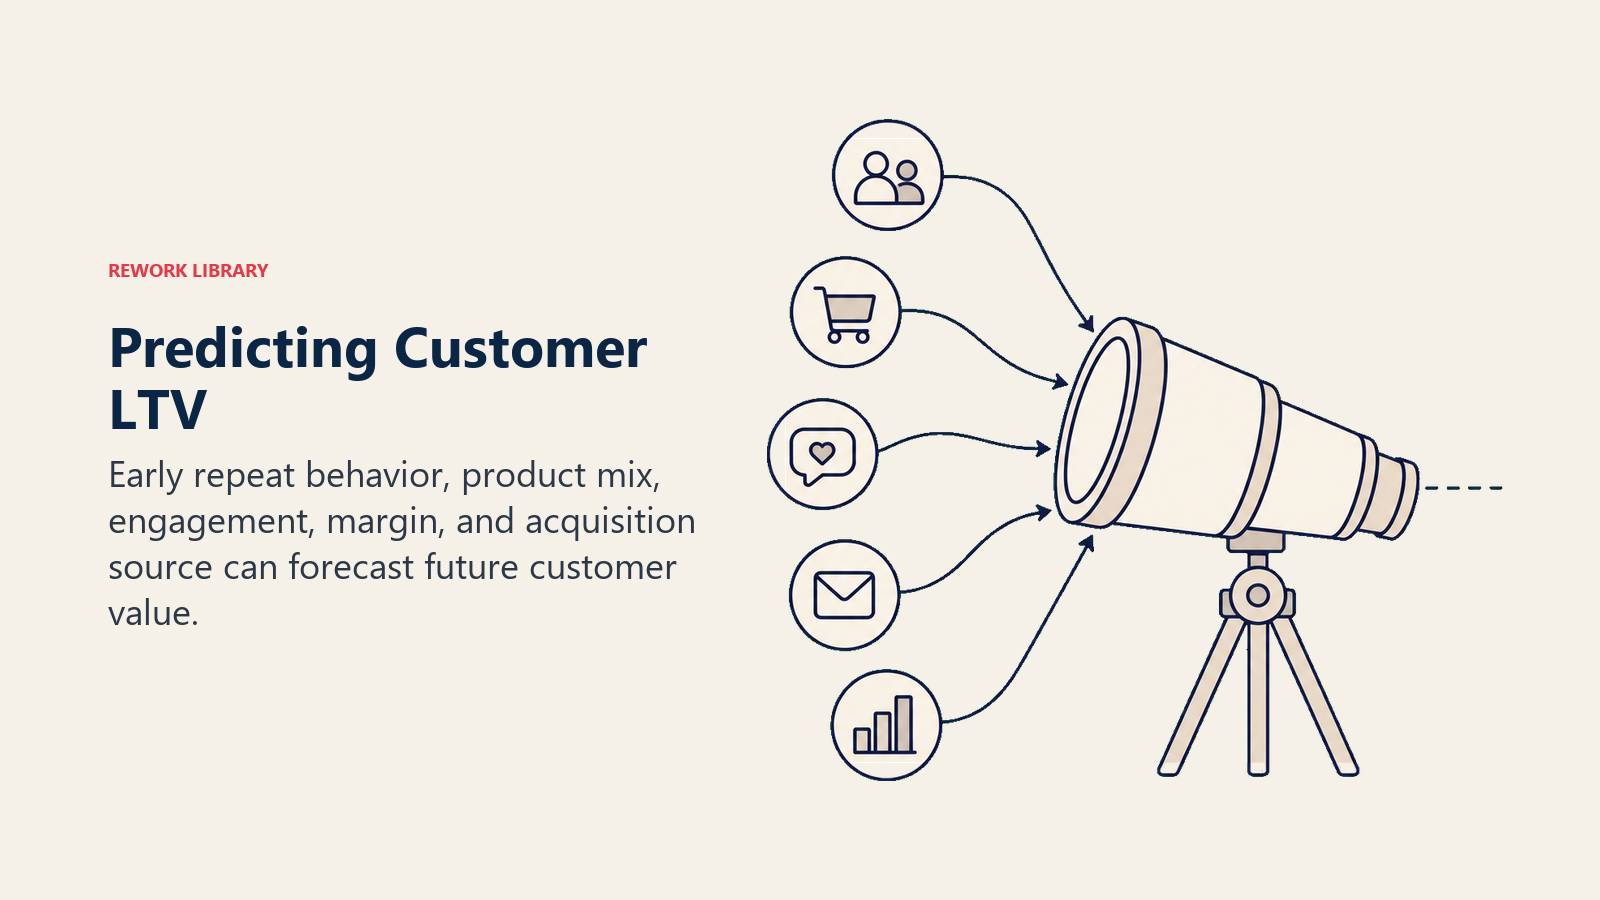
LTV Prediction and Early Indicators
The holy grail of LTV optimization is predicting which customers will be high-value before they demonstrate it. This allows you to treat different customers differently from day one.
First-Purchase Signals That Predict LTV
Certain behaviors in the first 30 days correlate strongly with eventual lifetime value:
High AOV on first order Customers who spend 50%+ above average AOV on their first order typically have 2-3x higher LTV. They're demonstrating buying power and engagement from the start.
Short time-to-second-purchase Customers who return within 30 days have dramatically higher LTV than those who wait 60+ days. Fast second purchase indicates satisfaction and intent to continue.
Email engagement Customers who open 40%+ of post-purchase emails in the first month have 2x higher retention and LTV than those with under 20% open rates.
Full-price vs discount purchase Customers acquired through full-price purchases have 30-50% higher LTV than those who only buy during sales. They value the product, not just the deal.
Product category In many businesses, certain product categories predict higher repeat rates. Skincare > makeup, coffee > tea, etc. Track your category-level retention to identify winners.
RFM Analysis for LTV Prediction
RFM (Recency, Frequency, Monetary) analysis segments customers based on purchase behavior:
Recency: When did they last purchase? Frequency: How many orders have they placed? Monetary: How much have they spent total?
Score each customer 1-5 on each dimension:
- Recency: 5 = purchased this week, 1 = purchased 6+ months ago
- Frequency: 5 = 10+ orders, 1 = 1 order
- Monetary: 5 = 500+ dollars spent, 1 = under 50 dollars
A customer scoring 5-5-5 is your highest-value segment. A customer scoring 1-1-1 has likely churned.
RFM segments and predicted LTV:
- Champions (5-5-5): LTV = 6-10x average
- Loyal Customers (4-5-4): LTV = 4-6x average
- Potential Loyalists (5-2-3): LTV = 2-4x average (if retained)
- At Risk (2-3-4): LTV declining, need win-back
- Lost (1-1-1): LTV complete, already churned
This segmentation lets you allocate retention marketing budget efficiently. Spend heavily on Champions and Potential Loyalists. Use automated win-back for At Risk. Don't waste money on Lost.
Using First-Purchase Behavior to Optimize Acquisition
Once you know which first-purchase profiles predict high LTV, you can optimize acquisition toward them:
Channel optimization: If Facebook drives high AOV first orders but Google drives low AOV, shift budget to Facebook even if CPA is higher. The LTV will justify it.
Creative optimization: Test ad creative that attracts higher-spending customers. Showcase premium products rather than entry-level or discounted items.
Landing page optimization: Direct traffic to higher-AOV products or bundles rather than lowest-price entry points.
Offer strategy: Test whether a 15% discount increases conversion but decreases LTV by attracting deal-seekers. Sometimes no discount produces better long-term economics. Understanding discount strategy helps balance short-term conversion with long-term value.
The goal is acquiring customers who will be valuable over time, not just customers who convert today.
Common LTV Mistakes and Pitfalls
Most e-commerce companies calculate LTV wrong. Here are the mistakes that destroy accuracy and lead to bad decisions:
Mistake 1: Ignoring Repeat Purchase Probability
The error: Calculating LTV as if every customer will repeat purchase at your average rate.
Reality: 50-70% of e-commerce customers never make a second purchase. Your repeat buyer segment has dramatically higher LTV than your one-and-done segment. Blending them together creates false averages.
The fix: Calculate separate LTVs for one-time buyers vs repeat buyers. Report both. Make decisions based on the segment you're targeting.
Mistake 2: Inflated Retention Assumptions
The error: Assuming low churn rates that don't reflect reality.
Example: "We have 10% monthly churn, so customers stay 10 months on average."
Reality check: If 50% of customers never make a second purchase, your effective churn is much higher than your active subscriber churn.
The fix: Calculate retention curves from actual cohort data. Don't extrapolate from your most loyal segment. Include everyone.
Mistake 3: Mixing Business Models in One Metric
The error: Calculating a single average LTV across products with wildly different economics.
Example: Combining one-time luxury purchases (1,000 dollar AOV, 0.2x annual frequency) with consumable subscriptions (30 dollar AOV, 12x frequency) into one blended LTV.
The fix: Segment LTV by business model and product category. Report them separately. Optimize each independently.
Mistake 4: Underestimating Discount Impact
The error: Calculating LTV on full-price revenue when 60% of purchases use discounts.
Example: AOV = 80 dollars, but 50% of orders use 20% discounts. Real AOV = 0.5 × 80 + 0.5 × 64 = 72 dollars.
The fix: Calculate LTV using actual realized revenue after discounts, returns, and refunds. Gross margin should reflect true profitability, not aspirational pricing.
Optimization Strategies for Higher LTV
Once you understand your current LTV, here's how to systematically improve it:
Strategy 1: Improve Repeat Purchase Rates
The most impactful lever for most e-commerce businesses. Getting more customers to make a second purchase transforms economics.
Tactics:
- Automated post-purchase email sequences with 2nd order incentives
- Personalized product recommendations based on first purchase
- Subscription options for consumable products
- Replenishment reminders at natural reorder cycles
- Early repeat buyer loyalty benefits
Target: Increase 2nd purchase rate from 20% to 30% = 50% increase in overall LTV
Strategy 2: Increase AOV per Customer
Get existing customers to spend more per transaction through bundling, upsells, and cross-sells. Implementing effective upsell and cross-sell strategies can significantly boost transaction value.
Tactics:
- Product bundles and kits at slight discounts
- Free shipping thresholds just above average cart value
- Recommendations for complementary products
- Tiered discounts (spend 100 dollars, save 15 dollars)
- Limited-time offers on high-margin products
Target: Increase AOV from 75 dollars to 85 dollars = 13% increase in LTV
Strategy 3: Extend Customer Lifespan
Keep customers active longer through engagement, personalization, and creating switching costs. Building VIP customer programs can significantly extend the lifespan of your most valuable customers.
Tactics:
- Loyalty programs that reward cumulative spending
- VIP tiers with exclusive benefits
- Community building (Facebook groups, user-generated content)
- Content marketing that keeps your brand top-of-mind
- Exceptional customer service that creates advocacy
Target: Reduce annual churn from 35% to 25% = 58% increase in LTV
Strategy 4: Reduce Churn Through Retention Programs
Proactively identify and save at-risk customers before they churn.
Tactics:
- Win-back campaigns for customers 60+ days inactive
- Personalized incentives based on purchase history
- Surveys to understand dissatisfaction and address it
- Downgrade options (for subscriptions) rather than full cancellation
- Re-engagement through new product launches
Target: Recover 20% of at-risk customers = 10-15% increase in overall retention
Strategy 5: Post-Purchase Engagement Impact
The first 30 days after acquisition are critical. Maximize engagement to drive second purchase and long-term retention.
Tactics:
- Welcome series that educates on product usage
- Social proof and customer testimonials in email
- Exclusive "new customer" offers for 2nd purchase
- Request reviews and user-generated content
- Personalized follow-up based on purchase
Target: Increase 30-day repeat rate from 15% to 25% = 35-50% increase in long-term LTV
Putting It All Together
Customer Lifetime Value isn't just a metric. It's the lens through which every growth decision should be made.
Should you increase Facebook ad spend? Depends on the LTV of Facebook cohorts vs your CAC.
Should you invest in retention programs? Depends on how much a 10% churn reduction increases LTV.
Should you launch a subscription program? Depends on whether subscription LTV justifies the operational complexity.
Should you expand to a new channel? Depends on early cohort LTV signals from test campaigns.
Every strategic question in e-commerce comes back to understanding the lifetime value of the customers you're acquiring and retaining.
The companies that win long-term:
- Calculate LTV accurately using cohort analysis
- Segment LTV by acquisition channel and customer type
- Track LTV trends over time to spot problems early
- Optimize for LTV improvement, not just revenue growth
- Maintain healthy LTV:CAC ratios with sustainable payback periods
The companies that struggle:
- Make acquisition decisions based on first-order ROAS
- Ignore retention and focus only on top-of-funnel growth
- Don't know which customers are actually profitable
- Confuse revenue growth with sustainable unit economics
The choice is clear. Build your business on solid LTV fundamentals, or scale yourself into a unit economics crisis.
Frequently Asked Questions
How do you calculate customer lifetime value in e-commerce? The standard formula is LTV = Average Order Value times Purchase Frequency times Customer Lifespan times Gross Margin. For example, an 80 dollar AOV, 3 orders per year, a 3-year lifespan, and 40% margin gives an LTV of 288 dollars. Always calculate on gross profit, not revenue, so the number reflects what you actually keep.
What is a good LTV to CAC ratio? 3:1 is the minimum healthy benchmark for e-commerce. A 4:1 or 5:1 ratio supports aggressive growth, while anything under 2:1 is unsustainable without external funding. If your ratio climbs above 5:1, you are likely underspending on acquisition and leaving market share on the table.
What is the difference between historical and predictive LTV? Historical LTV measures the actual profit a past cohort has already generated, so it is accurate but lagging. Predictive LTV estimates total future value from current behavior, so it is actionable today but assumption-dependent. The best practice is a hybrid: ground predictive models in real cohort retention curves.
Why does retention have such a large impact on LTV? The relationship is exponential, not linear, because customer lifespan is the inverse of churn. Improving annual retention from 70% to 80% can lift LTV by roughly 50%, since each retained period compounds margin while costing far less than acquiring a new customer.
Ready to master e-commerce profitability metrics? Start with understanding your complete unit economics for e-commerce and build a comprehensive e-commerce metrics & KPIs dashboard.
Learn more:

Senior Operations & Growth Strategist
On this page
- What is Customer Lifetime Value (LTV)?
- Why LTV is Your Most Important Metric
- LTV Calculation Methods: Historical vs Predictive
- Historical LTV (Backward-Looking)
- Predictive LTV (Forward-Looking)
- The Hybrid Approach: Cohort-Based Predictive LTV
- The Four Components That Drive LTV
- Component 1: Average Order Value (AOV)
- Component 2: Purchase Frequency
- Component 3: Customer Lifespan (or Retention Period)
- Component 4: Gross Margin
- LTV Benchmarks by Business Model
- One-Time Purchase Businesses
- Repeat Purchase (Non-Subscription)
- Subscription Models
- Marketplace Platforms
- Cohort Analysis: The Key to Actionable LTV Insights
- What is Cohort Analysis?
- Building Your Cohort Framework
- Segmenting Cohorts by Acquisition Channel
- Identifying High-Value Customer Cohorts
- Retention's Exponential Impact on LTV
- The Math That Changes Everything
- Why Retention Multiplies Value
- Retention Improvements = LTV Growth
- LTV vs CAC: The Profitability Equation
- The 3x Rule (Minimum Viability)
- CAC Payback Period: The Cash Flow Reality
- Balancing Growth and Profitability
- LTV Prediction and Early Indicators
- First-Purchase Signals That Predict LTV
- RFM Analysis for LTV Prediction
- Using First-Purchase Behavior to Optimize Acquisition
- Common LTV Mistakes and Pitfalls
- Mistake 1: Ignoring Repeat Purchase Probability
- Mistake 2: Inflated Retention Assumptions
- Mistake 3: Mixing Business Models in One Metric
- Mistake 4: Underestimating Discount Impact
- Optimization Strategies for Higher LTV
- Strategy 1: Improve Repeat Purchase Rates
- Strategy 2: Increase AOV per Customer
- Strategy 3: Extend Customer Lifespan
- Strategy 4: Reduce Churn Through Retention Programs
- Strategy 5: Post-Purchase Engagement Impact
- Putting It All Together
- Frequently Asked Questions