E-commerce Metrics & KPIs: Essential Performance Indicators for Scaling Online Revenue
Turn this article into takeaways for your work.
Each assistant summarizes the article only for you and suggests best practices for your work.
E-commerce metrics and KPIs are the quantified signals that show whether an online store grows profitably. The metrics that matter most are unit economics: gross merchandise value, average order value, gross and contribution margin, customer acquisition cost, CAC payback period, customer lifetime value, and the LTV to CAC ratio. Everything else supports these.
Reality check: 73% of e-commerce businesses track the wrong metrics. They obsess over vanity numbers like pageviews and social media followers while their profitability bleeds out from poor unit economics and customer acquisition costs that will never pay back.
If you're trying to scale an online business, you can't afford to fly blind on metrics. But there's a trap: there are hundreds of metrics you could track. Most of them don't matter. Some actively mislead you. And a handful are so critical that ignoring them guarantees failure.
This guide cuts through the noise. We'll show you which KPIs actually predict profitable growth, how to calculate them correctly, and what benchmarks tell you if you're winning or losing. No fluff, no theory. Just the operational metrics that separate sustainable e-commerce businesses from those burning cash.
The Metrics Myth: Why Most KPI Dashboards Destroy Profitability
Let me tell you what happens at most e-commerce companies. Someone builds a dashboard packed with 40+ metrics. Revenue is up and to the right. Traffic is growing. Email subscribers are increasing. Everyone feels productive. Meanwhile, the business is six months from running out of cash because nobody's watching the metrics that actually matter: contribution margin by channel, customer acquisition cost payback period, and true customer lifetime value.
The problem isn't lack of data. E-commerce generates more data than almost any business model. The problem is knowing which metrics drive profitability versus which ones just make you feel busy.
The framework that works: tier your metrics by strategic importance. Tier 1 metrics determine whether your business model is sustainable. Tier 2 metrics help you optimize channels and conversion. Everything else is noise you check quarterly at best.
Get Tier 1 wrong and it doesn't matter how good your conversion rate optimization is. You're building on quicksand.
Tier 1 Metrics: Revenue and Unit Economics
These are your foundation metrics. If these numbers don't work, your business doesn't work. Period.
Gross Merchandise Value (GMV) vs Net Revenue
GMV is the total sales dollar value of merchandise sold through your platform over a given period. If you sold $500,000 worth of products, your GMV is $500,000.
But GMV isn't what hits your bank account. Net Revenue deducts returns, discounts, and marketplace fees (if applicable). That $500K in GMV might be $425K in net revenue after a 10% return rate and 5% in discounts.
Why this matters: GMV growth looks impressive in board decks. Net revenue growth determines if you can pay your bills. Always forecast and measure based on net revenue, not GMV.
Calculation:
- GMV = Total transaction value of all orders
- Net Revenue = GMV - Returns - Discounts - Marketplace fees
Benchmarks:
- Returns: 5-10% for apparel, 2-5% for consumer goods, 15-30% for fashion accessories
- Discount rate: 5-15% depending on promotional strategy
Average Order Value (AOV) and Order Growth
Average Order Value tells you how much customers spend per transaction. Calculate it by dividing total revenue by number of orders.
AOV is one of only three levers you can pull to grow revenue: increase traffic, increase conversion, or increase AOV. Understanding how to systematically improve AOV through AOV optimization strategy is critical.
But here's what most people miss: AOV means nothing without context about profitability. An AOV of $85 sounds great until you realize your cost of goods sold (COGS) is $70 and your CAC is $45. You're losing money on every order.
Track AOV alongside gross margin to understand real profitability per transaction, considering your overall unit economics for e-commerce.
Calculation:
- AOV = Total Revenue ÷ Number of Orders
Optimization tactics:
- Product bundling (typically increases AOV 15-30%)
- Volume discounts ("Buy 2, get 15% off")
- Free shipping thresholds (set 20-30% above current AOV)
- Strategic upsells at checkout
Benchmarks by vertical:
- Fashion/Apparel: $50-$100
- Home & Garden: $60-$150
- Electronics: $150-$400
- Luxury goods: $300+
Gross Margin and Contribution Margin by Channel
Gross Margin is your revenue minus cost of goods sold (COGS). If you sell a product for $100 and it costs you $40 to manufacture and ship, your gross margin is $60 or 60%.
But gross margin doesn't tell you if your business is profitable because it ignores all the money you spent acquiring that customer.
That's where Contribution Margin comes in. It's the more honest metric.
Contribution Margin = Revenue - COGS - Variable Marketing Costs (CAC)
If that $100 sale has $40 COGS but you spent $35 on Facebook ads to acquire the customer, your contribution margin is only $25 (25%). That needs to cover all your fixed costs: salaries, software, warehouse rent, everything.
Here's the killer insight: contribution margin varies wildly by channel. Your email marketing might have 65% contribution margin while your paid social is at 15%. This tells you where to invest more and where to pull back.
Critical thresholds:
- Gross margin below 40%: Very difficult to scale profitably
- Contribution margin below 20%: Not enough to cover fixed costs at most e-commerce businesses
- Contribution margin above 40%: Strong unit economics, room for growth investment
Track by channel:
- Organic search: Usually highest contribution margin (50-70%)
- Email/SMS to existing customers: Very high (60-80%)
- Paid search: Medium (30-50%)
- Paid social: Often lowest (15-35%)
- Marketplaces: Factor in 15-30% marketplace fees
Customer Acquisition Cost (CAC) and CAC Payback Period
Customer Acquisition Cost is exactly what it sounds like: how much you spend to acquire one customer.
CAC = Total Marketing & Sales Spend ÷ Number of New Customers Acquired
Seems simple, but there's a trap. Most companies calculate CAC wrong by excluding overhead, agencies, content production, influencer payments, and all the other costs that go into acquisition.
The honest CAC calculation includes:
- Ad spend (paid search, social, display)
- Marketing agency fees
- Content creation costs
- Marketing software and tools
- Promotional discounts for new customers
- Attribution: salaries of marketing team members focused on acquisition
If you're spending $50,000/month on "marketing" and acquiring 1,000 customers, your blended CAC is $50. But if 300 of those customers came from organic channels that cost you almost nothing, your paid CAC might be $71 per customer ($50K ÷ 700 paid customers).
Track both blended CAC and paid CAC. Blended tells you overall efficiency. Paid tells you if your growth channels are sustainable.
CAC Payback Period is even more critical: How long does it take to recover your customer acquisition cost from gross profit?
If your CAC is $60, gross margin is 50%, and average first order is $80, you make $40 in gross profit on the first purchase. You need 1.5 purchases to break even ($60 ÷ $40). If average time between purchases is 90 days, your CAC payback is about 135 days.
Why this matters: Until you hit CAC payback, every new customer is a drain on cash. If your payback is 12 months but you're scaling aggressively, you need external capital to fund the gap between spending on acquisition and recovering that spend through profit.
Benchmark targets:
- CAC Payback under 6 months: Excellent, can scale aggressively
- CAC Payback 6-12 months: Good, sustainable with proper cash management
- CAC Payback 12-18 months: Challenging, requires strong retention
- CAC Payback over 18 months: Dangerous unless LTV is extremely high
Tier 2 Metrics: Conversion and Traffic Performance
Once your unit economics work, these metrics help you optimize your growth engine.
Conversion Rate (Overall and by Channel)
Conversion Rate is the percentage of visitors who complete a purchase.
Conversion Rate = (Number of Orders ÷ Number of Sessions) × 100
But here's what matters more than your overall conversion rate: conversion rate by channel and by device.
Your email traffic might convert at 8% while cold Facebook traffic converts at 0.7%. Your desktop traffic converts at 3.2% while mobile converts at 1.9%. These differences are massive and they should drive completely different optimization strategies.
Why aggregate conversion rate misleads: If you shift traffic mix from high-converting email (8%) to low-converting paid social (0.7%) to drive growth, your overall conversion rate tanks even if you're executing perfectly. Judge channel performance against channel benchmarks, not against your overall average.
Benchmark conversion rates by channel:
- Email to engaged list: 5-12%
- Organic search (branded): 4-8%
- Organic search (non-branded): 2-4%
- Paid search (branded): 5-10%
- Paid search (non-branded): 2-4%
- Paid social (retargeting): 3-6%
- Paid social (cold traffic): 0.5-2%
- Direct traffic: 3-7%
Benchmark by vertical:
- Fashion/Apparel: 1-3%
- Consumer electronics: 2-4%
- Home goods: 2-5%
- Beauty/cosmetics: 2-4%
- Food & beverage: 3-6%
Track conversion rate through your analytics & tracking setup with proper channel attribution.
Traffic Sources and Attribution Complexity
You need to know where your traffic comes from and which sources drive profitable revenue, not just volume.
Most e-commerce businesses use last-click attribution by default. Someone clicks a Facebook ad, buys, and Facebook gets 100% of the credit. But that customer might have discovered you through organic search two weeks ago, engaged with your email sequence, and finally converted after seeing a retargeting ad.
Multi-touch attribution attempts to distribute credit across the customer journey. There are several models:
Linear attribution: Every touchpoint gets equal credit. If there were 4 touches before conversion, each gets 25%.
Time-decay attribution: More recent touches get more credit. The retargeting ad that drove the final click gets more weight than the initial awareness touch.
Position-based attribution: First and last touches get 40% each, everything in between shares 20%. This values both initial discovery and final conversion.
Data-driven attribution: Uses machine learning to assign credit based on statistical contribution. Only works with significant data volume (thousands of conversions).
Here's the reality: Attribution is messy and will never be perfect, especially with iOS privacy changes killing cookie-based tracking. Track multiple attribution models in your traffic acquisition strategy, look for patterns, and make directional decisions rather than treating any single model as truth. Proper implementation requires robust analytics tracking setup from day one.
Critical metrics by source:
- Sessions and users
- New vs returning visitor ratio
- Conversion rate
- Revenue per session
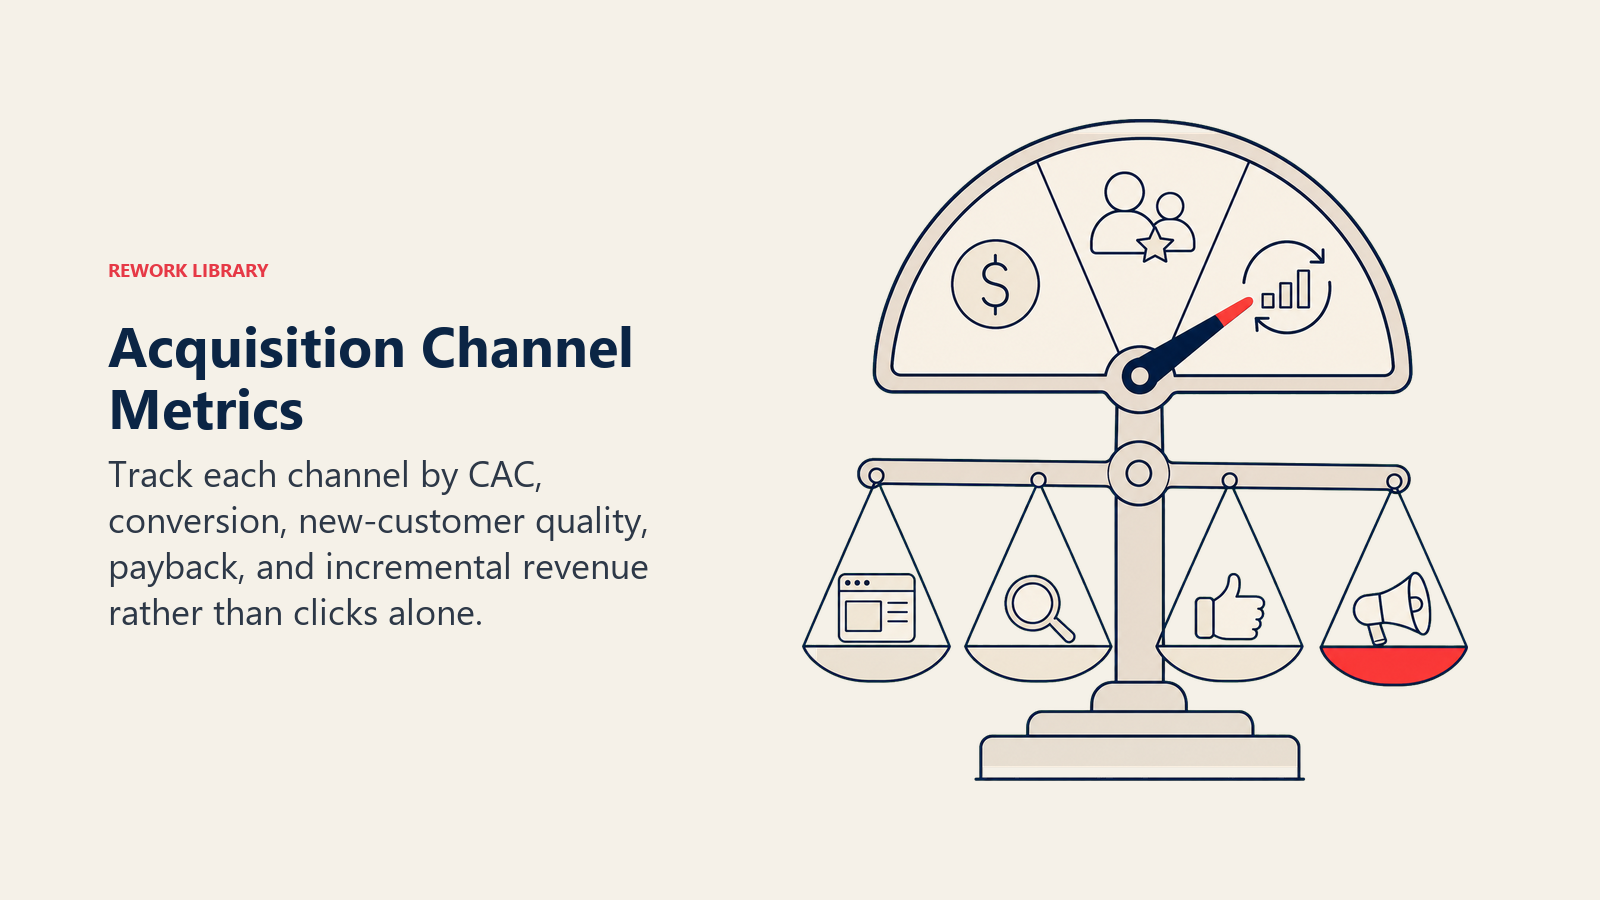
- CAC and contribution margin (what really matters)
Click-Through Rate (CTR), Cost Per Click (CPC), and Cost Per Acquisition (CPA)
For paid channels, these metrics form a hierarchy that determines profitability.
Click-Through Rate (CTR) = (Clicks ÷ Impressions) × 100
Higher CTR means your ads are relevant to the audience seeing them. It also lowers your cost per click on most platforms because ad algorithms reward engaging ads.
Cost Per Click (CPC) = Total Ad Spend ÷ Number of Clicks
CPC varies wildly by platform, audience, and competition:
- Google Search branded keywords: $0.50 - $2.00
- Google Search non-branded: $1.00 - $5.00+
- Facebook/Instagram feed ads: $0.50 - $3.00
- TikTok ads: $0.50 - $2.00
- Pinterest ads: $0.10 - $1.50
Cost Per Acquisition (CPA) = Total Ad Spend ÷ Number of Conversions
This is what actually matters. You can have a low CPC but terrible conversion rate, resulting in unsustainable CPA.
The relationship: CPA = CPC ÷ Conversion Rate
If your CPC is $2.00 and conversion rate is 2%, your CPA is $100. If you improve conversion rate to 4%, CPA drops to $50 - same traffic cost, double the efficiency.
Target CPA framework: Your maximum acceptable CPA = (AOV × Gross Margin %) × Target Contribution Margin %
Example: AOV is $120, gross margin is 50%, you want 30% contribution margin:
- Gross profit per order: $60
- Target contribution margin: $60 × 30% = $18
- Maximum CPA: $60 - $18 = $42
If your CPA is above $42, you're not hitting profitability targets.
Customer Lifetime Value and Retention Metrics
One-time customers don't build sustainable e-commerce businesses. Repeat customers do.
Customer Lifetime Value (LTV) Calculation Methodologies
Customer Lifetime Value predicts the total profit a customer will generate over their entire relationship with your business.
There are multiple ways to calculate LTV, from simple to sophisticated:
Simple LTV (for newer businesses): LTV = Average Order Value × Purchase Frequency × Average Customer Lifespan
Example: AOV is $75, customers buy 4 times per year, average relationship is 3 years: LTV = $75 × 4 × 3 = $900
Profit-adjusted LTV (more accurate): LTV = (Average Order Value × Gross Margin %) × Purchase Frequency × Average Customer Lifespan
Using same example with 50% gross margin: LTV = ($75 × 50%) × 4 × 3 = $450
This is your actual LTV for CAC comparison.
Cohort-based LTV (most accurate): Track actual purchasing behavior by acquisition cohort. Customers acquired in Q1 2024 purchased an average of $X in their first month, $Y in their second month, etc. Sum the cumulative revenue and apply gross margin.
This method accounts for the reality that most customers don't purchase on a perfect schedule. Some buy heavily in year one then churn. Others stick around for years with small purchases.
Learn the detailed frameworks in our guide to customer lifetime value.
Important insight: LTV is a prediction, not a fact. Early-stage businesses often wildly overestimate LTV because they're extrapolating from their first few months of best customers. Reality usually disappoints.
Use conservative assumptions:
- Calculate LTV after at least 12 months of cohort data
- Don't assume purchase frequency will remain constant (it usually declines)
- Apply churn rates (some customers will stop buying)
- Discount future profit (a dollar in three years is worth less than a dollar today)
LTV:CAC Ratio and Profitability Thresholds
The LTV:CAC ratio is the single most important metric for determining if your e-commerce business model is viable.
LTV:CAC Ratio = Customer Lifetime Value ÷ Customer Acquisition Cost
Interpretation:
- Below 1:1 - You lose money on every customer. Business is unsustainable.
- 1:1 to 2:1 - You're breaking even or barely profitable. Not enough margin for growth.
- 2:1 to 3:1 - Acceptable, but still tight. Limited room for error.
- 3:1 to 4:1 - Healthy ratio. Good business model with room to invest in growth.
- Above 4:1 - Very strong. Either you're extremely efficient or you're underinvesting in growth.
Here's the nuance most people miss: Your target LTV:CAC ratio depends on your CAC payback period.
If CAC payback is 3 months and LTV:CAC is 3:1, you're in great shape. You recover acquisition cost quickly and have long-term profit potential.
If CAC payback is 18 months and LTV:CAC is 3:1, you're in a precarious position. It takes forever to break even and your profit margin after that is thin.
Best case scenario: CAC payback under 6 months, LTV:CAC above 3:1. This gives you fast capital recovery and strong long-term economics.
Repeat Purchase Rate and Customer Retention Cohorts
Repeat Purchase Rate measures what percentage of customers come back to buy again.
Repeat Purchase Rate = (Customers Who Made 2+ Purchases ÷ Total Customers) × 100
Industry benchmarks vary widely:
- Fashion/apparel: 25-35%
- Beauty/cosmetics: 30-40%
- Consumables (food, supplements): 40-60%
- Furniture/home goods: 15-25%
- Electronics: 10-20%
But here's what matters more: retention cohort analysis. Track what percentage of customers from each acquisition month make a second purchase, third purchase, etc.
Example cohort analysis:
- January 2024 cohort: 1,000 customers acquired
- Month 1: 35% made repeat purchase (350 customers)
- Month 3: 55% total made repeat purchase (550 customers)
- Month 6: 62% total made repeat purchase (620 customers)
- Month 12: 68% total made repeat purchase (680 customers)
This tells you several things:
- Most repeat purchases happen in first 90 days (55% by month 3)
- You can predict 12-month retention by month 3-6 performance
- If future cohorts underperform this curve, something's wrong with product quality, service, or positioning
Track retention curves by acquisition channel too. Customers from organic search might have better retention than those from discount-driven Facebook ads because they discovered you by intent rather than interruption.
Strong retention is the foundation of repeat purchase strategy that drives sustainable growth.
Churn Rate and Customer Payback Periods
For subscription e-commerce or consumable products with expected repeat purchase, track monthly churn rate.
Monthly Churn Rate = (Customers Lost This Month ÷ Customers at Start of Month) × 100
If you started February with 10,000 customers and 500 didn't make their expected repeat purchase, your churn rate is 5%.
Churn compounds. A 5% monthly churn rate means:
- Month 1: 95% remain (0.95)
- Month 6: 77% remain (0.95^6)
- Month 12: 54% remain (0.95^12)
- Month 24: 29% remain (0.95^24)
This is why retention matters so much. If you reduce churn from 5% to 3% monthly:
- Month 12: 69% remain instead of 54%
- Month 24: 48% remain instead of 29%
That difference directly impacts LTV and makes customer acquisition far more profitable.
Traffic and Acquisition Channel Metrics
You can't improve what you don't measure by channel.
Organic Search Traffic and SEO Performance
Organic search is often the highest-margin acquisition channel because the traffic is free once you rank, and searchers have high intent. Building a comprehensive e-commerce SEO strategy pays compounding returns over time.
Track these organic search metrics:
Keyword rankings: How many high-intent keywords do you rank for in positions 1-3, 4-10, 11-20? Track rankings for product categories, comparison terms, and transactional keywords.
Organic traffic volume: Sessions from organic search month-over-month and year-over-year.
Organic conversion rate: Almost always higher than paid traffic because people searched for you.
Revenue per organic session: Typically 2-5x higher than paid social.
Rankings for high-value terms: If you sell running shoes, ranking #1 for "best running shoes" drives far more value than ranking #1 for "history of running shoes."
The key with organic search: it's a long game. Takes 6-12 months to see meaningful results from SEO investment. But once you rank, the traffic compounds and margins are exceptional.
Paid Advertising Efficiency Across Channels
Different paid channels serve different purposes in your acquisition strategy:
Paid Search (Google Ads, Bing):
- Best for: High-intent, bottom-of-funnel conversions
- Typical ROAS: 3-6x for non-branded, 8-15x for branded
- Key metrics: CPC, conversion rate, impression share
- Watch for: Competitive keyword bidding wars destroying CAC
Paid Social (Facebook, Instagram, TikTok):
- Best for: Brand awareness, prospecting, retargeting
- Typical ROAS: 2-4x for prospecting, 5-10x for retargeting
- Key metrics: CPM, CTR, conversion rate, frequency
- Watch for: Ad fatigue (frequency above 3-4 kills performance)
- Learn advanced tactics in our Facebook Instagram ads guide
Display/Programmatic:
- Best for: Brand awareness at scale, retargeting
- Typical ROAS: 1.5-3x
- Key metrics: CPM, viewability, brand lift
- Watch for: Low-quality placements and ad fraud
Shopping Platforms (Google Shopping, Pinterest, Amazon Ads):
- Best for: Product discovery and direct response
- Typical ROAS: 3-6x
- Key metrics: Product feed quality, click-through rate, conversion rate
- Watch for: Margin erosion from promotional bidding
- Optimize performance with our Google Shopping ads strategies
Track ROAS (Return on Ad Spend) by channel:
ROAS = Revenue from Ads ÷ Ad Spend
A 4:1 ROAS means you generate $4 in revenue for every $1 spent on ads.
But ROAS is misleading if you ignore gross margin. A 4:1 ROAS with 40% gross margin means:
- Spend: $1
- Revenue: $4
- Gross profit: $1.60
- Contribution margin after CAC: $0.60
That's a 60% contribution margin - strong. But if your gross margin is only 25%:
- Spend: $1
- Revenue: $4
- Gross profit: $1.00
- Contribution margin after CAC: $0
You're breaking even at best.
Always calculate contribution margin, not just ROAS.
Email Marketing and SMS Metrics
Email and SMS are your highest-leverage channels for existing customers.
Email metrics that matter:
List growth rate: New subscribers minus unsubscribes as a percentage of total list size. Healthy e-commerce: 2-5% monthly growth.
Open rate: Industry average is 15-25%, but this metric is increasingly unreliable due to privacy changes (Apple Mail Privacy Protection).
Click-through rate: Percentage of recipients who click a link. Benchmark: 2-5% for promotional emails.
Conversion rate: Percentage of recipients who purchase. Benchmark: 0.5-3% depending on list quality and offer.
Revenue per email sent: Typically $0.05 - $0.30 per email for engaged lists.
SMS metrics:
SMS has higher engagement but more limited use cases (you can't spam SMS like email).
Opt-in rate: Percentage of customers who subscribe to SMS. Target: 15-30% of email list.
Click-through rate: Much higher than email, typically 15-35%.
Conversion rate: Also much higher, 8-15% for promotional texts.
Unsubscribe rate: Watch carefully. Above 5% means you're texting too frequently or with irrelevant offers.
The golden rule: Email and SMS to existing customers should be your most profitable channels. If they're not generating 5-10x ROAS, you're doing something wrong with segmentation, messaging, or frequency. Master the fundamentals with our email marketing for ecommerce guide.
Product Performance and AOV Metrics
Not all products are created equal. Some drive profits, some drive traffic, some do neither.
Product-Level Conversion Rates and Revenue Contribution
Track these metrics at the product level:
Product conversion rate: What percentage of people who view the product page actually buy? Benchmarks vary wildly (2-15%), but what matters is relative performance. Your top converters are products to promote more heavily.
Revenue contribution: What percentage of total revenue comes from each product? Often follows the 80/20 rule: 20% of products drive 80% of revenue.
Profit contribution: Revenue is nice, but profit matters more. Some high-revenue products have terrible margins after COGS and returns.
Product view-to-cart rate: Percentage of product page viewers who add to cart. This isolates upper-funnel product page performance from checkout conversion. Improve this metric through strategic product page optimization.
Cart-to-purchase rate: What percentage of people who add the product to cart actually complete checkout? If this is low, you have a checkout problem, not a product problem.
Use this data to:
- Allocate ad spend to products with best conversion × margin
- Kill or discount slow-moving inventory with low conversion
- Identify which products need better photography, descriptions, or reviews
- Determine which products to feature on homepage and category pages
Cross-Sell and Upsell Attachment Rates
Attachment rate measures how often customers buy additional products beyond their primary purchase.
Cross-sell attachment rate = (Orders with 2+ Products ÷ Total Orders) × 100
If 30% of your orders include multiple products, your cross-sell attachment rate is 30%.
Upsell effectiveness: When you recommend a higher-priced alternative, what percentage of customers take it?
Strategies to improve attachment rates:
- "Frequently bought together" bundles (increases attachment 15-40%)
- "Complete the look" for fashion/accessories
- Volume discounts (buy 3, save 20%)
- Free shipping thresholds that encourage adding one more item
- Post-purchase upsells (after checkout completes, offer add-on)
Track which product combinations have highest attachment rates and systematically recommend them. If 40% of people who buy Product A also buy Product B, that's a natural bundle.
Bundle Penetration and Category Performance
Bundle penetration: What percentage of orders include a pre-configured bundle vs individual items?
Bundles typically increase AOV by 20-35% and improve margins because you can package slower-moving inventory with bestsellers. See our product bundling guide for tested bundle structures.
Category performance analysis:
Track these metrics by product category:
- Revenue contribution
- Gross margin (COGS varies significantly by category)
- Conversion rate (some categories browse more than buy)
- Return rate (apparel returns 3x higher than home goods)
- Repeat purchase rate by first category purchased
This tells you which categories to expand, which to promote, and which to potentially exit.
Example insight: Your electronics category drives 40% of revenue but has 15% gross margin and 25% return rate. Your home goods category drives 20% of revenue but has 55% gross margin and 5% return rate. Home goods is far more profitable even though it generates less revenue.
Operational and Fulfillment Metrics
Revenue doesn't matter if you can't fulfill orders profitably.
Order Fulfillment Time and Shipping Costs
Order fulfillment time: Hours/days from order placed to order shipped. Target: under 24 hours for in-stock items.
Fast fulfillment impacts:
- Customer satisfaction and reviews
- Repeat purchase rate
- Support ticket volume
Shipping costs as percentage of revenue: Track both actual costs and what you charge customers.
If average shipping cost is $8, you charge $5, and AOV is $75, you're subsidizing $3 per order (4% of revenue). That's a strategic decision to improve conversion, but you need to know the true cost.
Shipping method mix: Percentage of orders via standard, expedited, overnight. Higher-margin businesses can afford faster shipping defaults.
Return Rate and Return Logistics Costs
Return rate varies dramatically by category:
- Apparel: 15-30%
- Footwear: 20-35%
- Home goods: 5-10%
- Consumer electronics: 8-15%
High return rates destroy profitability through:
- Refunded revenue (lost sale)
- Shipping costs both ways (often $10-20 per return)
- Restocking labor
- Inventory that can't be resold as new
Implement effective returns management processes to minimize these costs.
True cost of returns:
- Lost revenue: $75 average order
- Outbound shipping (you paid): $7
- Return shipping (often you pay): $7
- Restocking cost: $3
- Inventory markdown (25% can't resell full price): $5
- Total cost: $97 for a $75 order
If your return rate is 20%, you're effectively losing $97 on every 5th order. That's catastrophic if not factored into unit economics.
Strategies to reduce returns:
- Better product photography and descriptions
- Size guides and fit recommendations
- Customer reviews mentioning fit/quality
- Higher quality control standards
- Virtual try-on technology
Even a 5% reduction in return rate (from 25% to 20%) can increase profitability by 8-12% through saved costs.
Inventory Turnover and Stockout Impact
Inventory turnover measures how many times per year you sell through your entire inventory.
Inventory Turnover = Cost of Goods Sold ÷ Average Inventory Value
A turnover of 6 means you sell through your inventory every 2 months (12 months ÷ 6).
Benchmarks by vertical:
- Grocery/consumables: 10-20x per year
- Fashion/apparel: 4-6x per year
- Electronics: 6-8x per year
- Furniture: 3-5x per year
Higher turnover is generally better (less capital tied up in inventory), but too high means frequent stockouts. Effective inventory management balances turnover with availability.
Stockout rate: Percentage of time your bestsellers are out of stock.
Track revenue impact: If a product that generates $5,000/week is out of stock for 10 days, you lost approximately $7,000 in revenue (assuming 70% of demand doesn't wait).
Balance inventory turnover against stockout risk. Holding an extra 2 weeks of inventory for top SKUs costs money but prevents lost sales.
Customer Experience and Engagement Metrics
User experience directly impacts conversion and retention.
Cart Abandonment Rate and Recovery Performance
Cart abandonment rate is the percentage of shoppers who add items to cart but don't complete checkout.
Cart Abandonment Rate = (1 - Completed Checkouts ÷ Carts Created) × 100
Industry average: 65-70% abandon rate. Yes, that high.
Common abandonment triggers:
- Unexpected shipping costs (55% of abandoners)
- Required account creation (34%)
- Complicated checkout process (26%)
- Payment security concerns (19%)
- Slow website/crashes (18%)
Cart recovery tactics:
Abandoned cart emails: Send automated emails to remind shoppers about their cart.
- First email: 1 hour after abandonment (recovers 5-10% of carts)
- Second email: 24 hours later (recovers another 2-4%)
- Third email: 72 hours with discount incentive (recovers 3-6%)
SMS cart recovery: Higher open rate than email (35% vs 20%), recovers 8-12% of carts with first text.
Exit-intent popups: Offer discount or free shipping when user shows intent to leave. Converts 2-4% of otherwise-lost sessions.
Track recovery rate by channel and tactic. Even recovering 10% of abandoned carts at 70% abandonment rate effectively increases your conversion rate by 30% relative to baseline. Implement systematic cart abandonment recovery workflows for maximum impact.
Net Promoter Score (NPS) and Customer Satisfaction
Net Promoter Score measures customer loyalty by asking: "How likely are you to recommend us to a friend?" (0-10 scale)
- Promoters: 9-10 (loyal enthusiasts)
- Passives: 7-8 (satisfied but unenthusiastic)
- Detractors: 0-6 (unhappy customers)
NPS = % Promoters - % Detractors
Benchmarks:
- NPS above 50: Excellent
- NPS 30-50: Good
- NPS 10-30: Needs improvement
- NPS below 10: Crisis
Why NPS matters for e-commerce: Promoters have 3-5x higher LTV and generate word-of-mouth referrals (free acquisition).
Track NPS by:
- Acquisition channel (some channels bring higher-quality customers)
- Product category
- Customer cohort
- Purchase recency
Post-purchase satisfaction: Survey customers 5-7 days after delivery when product experience is fresh. Track satisfaction trends and investigate drops immediately.
Website Speed and Core Web Vitals Impact on Conversion
Page load speed directly impacts conversion. For every 1 second delay in load time:
- Conversion drops 7%
- Bounce rate increases 11%
- Page views decrease 11%
Core Web Vitals are Google's metrics for user experience:
Largest Contentful Paint (LCP): How long until main content loads. Target: under 2.5 seconds.
First Input Delay (FID): How long until page responds to user interaction. Target: under 100ms.
Cumulative Layout Shift (CLS): How much page elements shift during loading. Target: under 0.1.
Mobile optimization is critical: 60-70% of e-commerce traffic is mobile, but mobile typically converts 30-40% lower than desktop due to slower speeds and worse UX. Streamlined checkout flow optimization is essential for mobile conversion.
Speed optimization impact: Improving LCP from 4.2s to 2.1s can increase conversion rate by 15-25%. That's essentially free revenue from existing traffic. Dig into the technical fixes in our site speed and performance guide.
Dashboard and Reporting Best Practices
Tracking metrics is useless if you don't review them systematically.
Real-Time KPI Tracking and Alert Thresholds
Build dashboards with three time horizons:
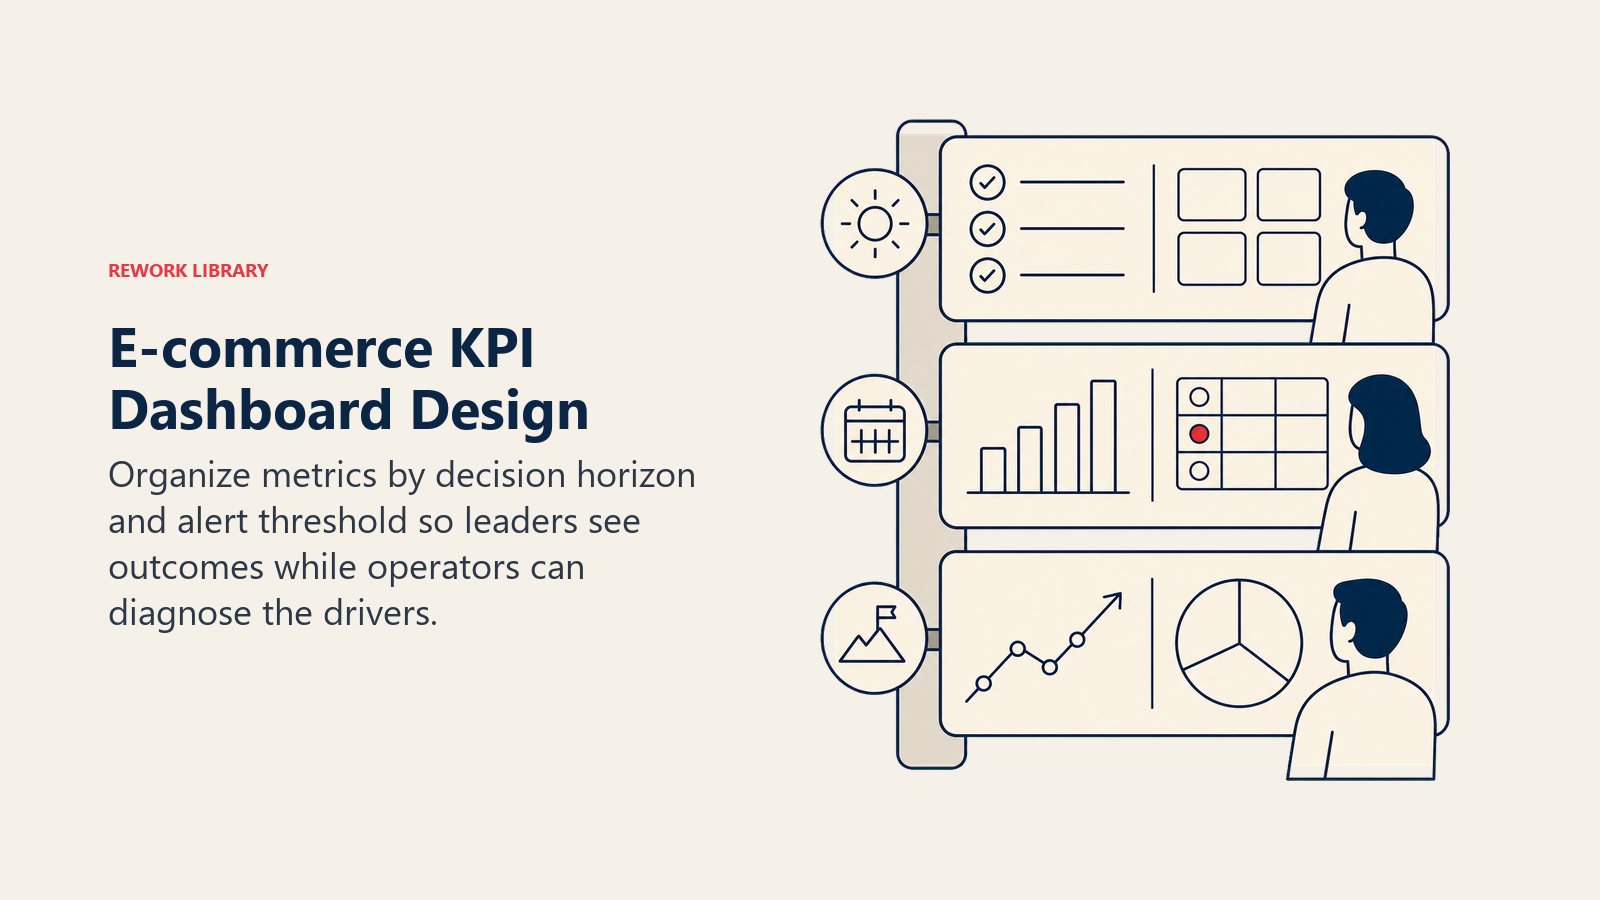
Real-time dashboard (check daily):
- Revenue vs target
- Orders vs target
- Conversion rate by channel
- Top products sold
- Critical alerts (site down, inventory stockouts, payment processing errors)
Weekly dashboard:
- CAC and CPA by channel
- New customer acquisition
- Repeat purchase rate
- Email/SMS performance
- Return rate
- Top performing products
Monthly dashboard:
- Full P&L tied to metrics
- LTV:CAC by cohort
- Contribution margin by channel
- Inventory turnover
- Operational metrics (fulfillment time, support tickets, etc.)
Set alert thresholds: If conversion rate drops below 1.5%, CAC exceeds $75, or return rate goes above 22%, get automatic alerts. Don't wait for monthly reviews to discover problems.
Cohort Analysis and Customer Segmentation
Cohort analysis groups customers by acquisition period and tracks behavior over time.
Compare cohorts to answer:
- Do customers acquired in Q4 (holiday season) have same LTV as Q2 customers?
- Did the March 2024 cohort (product launch) retain better than average?
- Are recent cohorts showing worse retention, indicating product or service degradation?
Customer segmentation groups by behavior and value:
RFM segmentation (Recency, Frequency, Monetary):
- Champions: Bought recently, buy frequently, spend a lot
- Loyal customers: Buy regularly, moderate spend
- At-risk: Haven't purchased in a while, were valuable
- Can't lose them: High spenders who haven't bought recently
- New customers: Recent first purchase
Tailor marketing by segment:
- Champions: VIP access, early product launches, exclusive offers
- At-risk: Aggressive win-back campaigns
- New customers: Onboarding sequences optimized for second purchase
Track segment migration: Are new customers graduating to loyal? Are champions slipping to at-risk?
Metric Prioritization and Strategic Alignment
Not all metrics deserve equal attention. Use this prioritization framework:
Stage 1: Launch to $100K/month revenue
- Focus: Product-market fit and unit economics
- Critical metrics: Conversion rate, CAC, gross margin, AOV
- Track weekly: Revenue, orders, traffic sources
Stage 2: $100K-$1M/month revenue
- Focus: Channel optimization and repeatability
- Critical metrics: CAC payback, contribution margin by channel, repeat purchase rate
- Track weekly: All Tier 1 metrics, channel performance
Stage 3: $1M-$10M/month revenue
- Focus: Operational efficiency and retention
- Critical metrics: LTV:CAC, inventory turnover, fulfillment costs, cohort retention
- Track weekly: Full dashboard with operational metrics
Stage 4: $10M+ monthly revenue
- Focus: Market expansion and margin optimization
- Critical metrics: Category profitability, marketplace efficiency, brand equity metrics
- Track daily: Real-time dashboard with predictive forecasting
Align metrics with department accountability:
- Marketing: CAC, traffic volume, ROAS by channel
- Merchandising: Product conversion rates, AOV, inventory turnover
- Operations: Fulfillment time, shipping costs, return rate
- Finance: Contribution margin, cash flow, gross margin by category
- Customer success: NPS, retention rate, support ticket volume
The Bottom Line: Metrics That Matter
What separates profitable e-commerce businesses from those burning cash: ruthless focus on unit economics and contribution margin.
You can have impressive traffic, strong conversion rates, and growing revenue - but if your CAC payback is 18 months and LTV:CAC ratio is 2:1, you're building on quicksand.
Start with Tier 1 metrics. Get unit economics working. Then optimize Tier 2 metrics to improve channel efficiency and conversion. Everything else is nice to have.
Track metrics by channel, by cohort, and by product category. Aggregated numbers hide problems and opportunities. The real insights come from segmentation.
And most importantly: review metrics with action in mind. Don't just look at dashboards. Ask "What decision does this metric inform?" If a metric doesn't drive a decision, stop tracking it.
Frequently Asked Questions about E-commerce Metrics & KPIs
What is the most important e-commerce metric?
The LTV to CAC ratio is the single most important indicator of whether your business model is viable. It compares the lifetime profit of a customer against what you spent to acquire them. A ratio above 3:1 signals healthy unit economics with room to invest in growth.
What is a good conversion rate for e-commerce?
A typical e-commerce conversion rate sits between 1% and 3%, but it varies sharply by channel and vertical. Engaged email lists can convert at 5-12%, while cold paid social often converts below 2%. Judge each channel against its own benchmark, not your overall average.
How often should I review e-commerce KPIs?
Use three time horizons. Check revenue, orders, and conversion daily. Review CAC, repeat purchase rate, and channel performance weekly. Reserve LTV to CAC by cohort, contribution margin, and inventory turnover for a monthly deep dive.
Learn More
Master the foundational concepts that drive these metrics:
Core E-commerce Growth:
- E-commerce Growth Model Overview - Understand the complete growth framework
- Unit Economics for E-commerce - Master the financial foundation
- Customer Lifetime Value - Calculate and optimize LTV
Optimization Strategies:
- Conversion Rate Optimization - Improve conversion across the funnel
- AOV Optimization Strategy - Increase average order value
- Repeat Purchase Strategy - Build retention systems
Technical Implementation:
- Analytics & Tracking Setup - Implement proper measurement infrastructure
- Traffic Acquisition Strategy - Build profitable acquisition channels

Senior Operations & Growth Strategist
On this page
- The Metrics Myth: Why Most KPI Dashboards Destroy Profitability
- Tier 1 Metrics: Revenue and Unit Economics
- Gross Merchandise Value (GMV) vs Net Revenue
- Average Order Value (AOV) and Order Growth
- Gross Margin and Contribution Margin by Channel
- Customer Acquisition Cost (CAC) and CAC Payback Period
- Tier 2 Metrics: Conversion and Traffic Performance
- Conversion Rate (Overall and by Channel)
- Traffic Sources and Attribution Complexity
- Click-Through Rate (CTR), Cost Per Click (CPC), and Cost Per Acquisition (CPA)
- Customer Lifetime Value and Retention Metrics
- Customer Lifetime Value (LTV) Calculation Methodologies
- LTV:CAC Ratio and Profitability Thresholds
- Repeat Purchase Rate and Customer Retention Cohorts
- Churn Rate and Customer Payback Periods
- Traffic and Acquisition Channel Metrics
- Organic Search Traffic and SEO Performance
- Paid Advertising Efficiency Across Channels
- Email Marketing and SMS Metrics
- Product Performance and AOV Metrics
- Product-Level Conversion Rates and Revenue Contribution
- Cross-Sell and Upsell Attachment Rates
- Bundle Penetration and Category Performance
- Operational and Fulfillment Metrics
- Order Fulfillment Time and Shipping Costs
- Return Rate and Return Logistics Costs
- Inventory Turnover and Stockout Impact
- Customer Experience and Engagement Metrics
- Cart Abandonment Rate and Recovery Performance
- Net Promoter Score (NPS) and Customer Satisfaction
- Website Speed and Core Web Vitals Impact on Conversion
- Dashboard and Reporting Best Practices
- Real-Time KPI Tracking and Alert Thresholds
- Cohort Analysis and Customer Segmentation
- Metric Prioritization and Strategic Alignment
- The Bottom Line: Metrics That Matter
- Learn More