Unit Economics for E-commerce: Master the Numbers Behind Profitability
Turn this article into takeaways for your work.
Each assistant summarizes the article only for you and suggests best practices for your work.
The harsh reality: 82% of e-commerce businesses fail because they run out of cash, and most of them never saw it coming. Why? Because they focused on revenue growth while ignoring the unit economics that determine whether each sale actually makes money.
You can have a million dollars in monthly revenue and still be on the fast track to bankruptcy if your unit economics don't work. And if you're an e-commerce leader trying to build sustainable growth, understanding unit economics isn't optional. It's the difference between scaling profitably and burning cash until you shut down.
Unit economics answers the only question that really matters: does acquiring and serving each customer make you money or cost you money? Everything else is just vanity metrics.
What are Unit Economics?
Unit economics is the analysis of revenue and costs at the individual customer or transaction level. It tells you whether your business model works before you scale it. In e-commerce, your "unit" is typically a customer, though it can also be measured per order or per product.
The fundamental equation is simple:
Customer Lifetime Value (LTV) - Customer Acquisition Cost (CAC) = Unit Profitability
If this number is positive and substantial, you have a business. If it's negative or barely positive, you have a problem, no matter how impressive your top-line revenue looks.
Why Unit Economics Matter More Than Revenue
Revenue is seductive. It grows, you celebrate, investors get excited, and everyone feels successful. But revenue without profit is just buying customers with your own money (or worse, someone else's).
Companies with poor unit economics often display these patterns:
- Growing revenue but shrinking bank accounts
- Need constant fundraising to maintain operations
- Can't afford to slow down marketing spend without collapse
- Celebrate growth metrics but avoid profitability conversations
Meanwhile, companies with strong unit economics:
- Generate cash with each customer acquired
- Can self-fund growth from operations
- Have pricing power and margin flexibility
- Weather market downturns without existential crisis
Understanding your e-commerce business model fundamentals starts with getting these unit economics right.
Customer Acquisition Cost (CAC): The True Cost of Growth
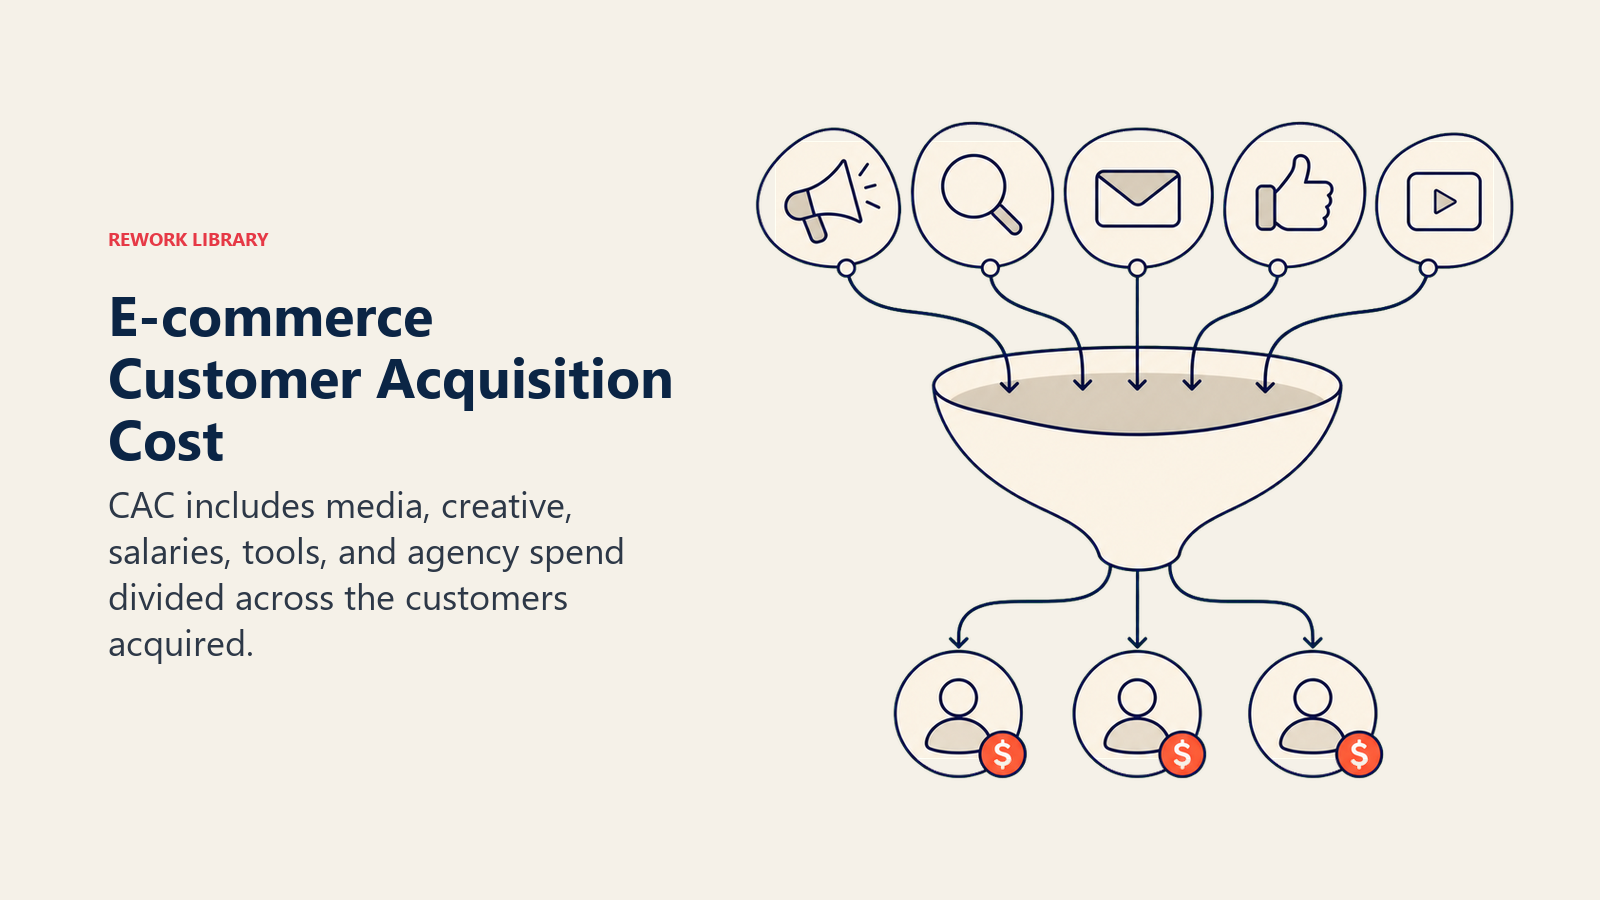
CAC is every dollar you spend to acquire a customer. Not just the ad click cost, everything that goes into turning a stranger into a buyer.
Calculating Your True CAC
Most e-commerce companies calculate CAC wrong. They look at ad spend divided by customers acquired. That's not even close to complete.
Full CAC Formula:
CAC = (Marketing Spend + Sales Expenses + Marketing Salaries + Tools/Software + Creative Production) / New Customers Acquired
Example:
- Total marketing spend: $50,000
- Marketing team salaries: $15,000
- Tools and software: $5,000
- Creative production: $5,000
- New customers acquired: 500
CAC = ($50,000 + $15,000 + $5,000 + $5,000) / 500 = $150 per customer
If you were only looking at ad spend ($50,000 / 500 = $100), you'd underestimate your true CAC by 50%.
CAC by Channel: Why It Varies Wildly
Not all customers cost the same to acquire. Channel economics differ significantly:
Typical CAC Ranges by Channel:
- Organic Search (SEO): $20-$80 (after content investment amortization)
- Paid Search (Google Ads): $50-$200
- Facebook/Instagram Ads: $30-$150
- TikTok Ads: $25-$100
- Influencer Marketing: $40-$180
- Affiliate Marketing: 10-30% of first order value
- Email Marketing: $5-$25 (existing list)
- Referrals: $15-$60
Your traffic acquisition strategy should optimize the channel mix based on CAC and customer quality, not just volume. Understanding the economics of Google Shopping ads and Facebook and Instagram ads becomes critical for managing acquisition costs.
CAC Payback Period: When Do You Break Even?
CAC payback period is how long it takes to recover the cost of acquiring a customer. This determines your cash flow dynamics and growth sustainability.
CAC Payback Formula:
CAC Payback Period (months) = CAC / (Average Monthly Revenue per Customer × Gross Margin %)
Example:
- CAC: $150
- Average monthly revenue per customer: $75
- Gross margin: 60%
Payback Period = $150 / ($75 × 0.60) = 3.3 months
Acceptable Payback Benchmarks:
- Subscription e-commerce: 6-12 months
- One-time purchase businesses: 3-6 months
- High-ticket items: 1-3 months
- Marketplace businesses: 12-18 months
If your payback period exceeds these ranges, you're burning cash faster than you're generating it. This is the death spiral most failing e-commerce businesses find themselves in.
Customer Lifetime Value (LTV): The Revenue Side of the Equation
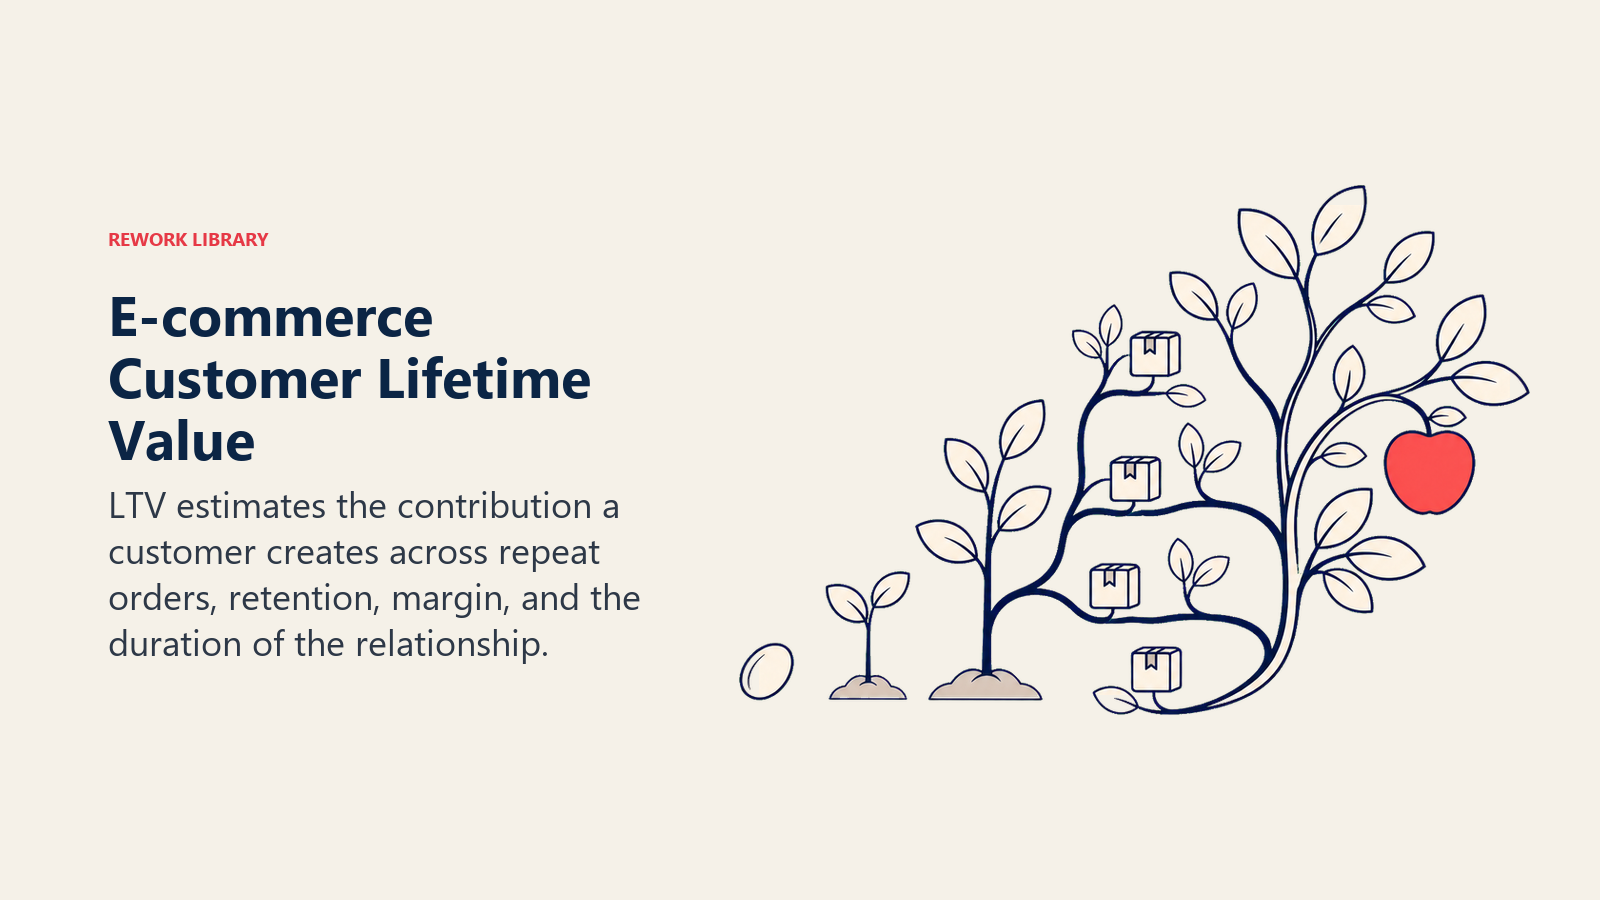
LTV is the total profit you expect to generate from a customer over their entire relationship with your business. Get this right, and you know exactly how much you can afford to spend acquiring customers.
Calculating LTV: The Complete Formula
Basic LTV Formula:
LTV = (Average Order Value × Purchase Frequency × Gross Margin) × Average Customer Lifespan
Example:
- Average order value: $120
- Purchase frequency: 4 orders per year
- Gross margin: 60%
- Average customer lifespan: 3 years
LTV = ($120 × 4 × 0.60) × 3 = $288 × 3 = $864
But this is simplified. More sophisticated LTV calculations account for retention curves and discount future cash flows.
Advanced LTV Formula:
LTV = (ARPU × Gross Margin × Retention Rate) / (1 + Discount Rate - Retention Rate)
Where:
- ARPU = Average Revenue Per User (monthly or annually)
- Retention Rate = Percentage of customers retained each period
- Discount Rate = Time value of money (typically 8-12% annually)
Understanding customer lifetime value in depth is crucial for making strategic decisions about acquisition spending.
Components That Drive LTV
LTV isn't a single lever, it's the product of multiple factors you can optimize:
1. Average Order Value (AOV) The more customers spend per purchase, the higher your LTV. Increase AOV through:
- Product bundling
- Upsells and cross-sells
- Volume discounts
- Free shipping thresholds
Learn specific tactics in our guide to AOV optimization strategy.
2. Purchase Frequency How often customers buy from you directly impacts LTV. Increase frequency through:
- Email marketing sequences
- Subscription models
- Loyalty programs
- Replenishment reminders
3. Gross Margin Your profit per transaction determines how much revenue converts to actual value. Improve margins by:
- Negotiating better supplier terms
- Optimizing shipping strategy and pricing
- Reducing returns management costs
- Premium product positioning
4. Customer Retention Keeping customers longer multiplies LTV exponentially. Retain customers through:
- Excellent customer experience
- Loyalty rewards
- Personalized recommendations
- Proactive support
Your repeat purchase strategy is one of the highest-leverage LTV drivers.
The Critical LTV:CAC Ratio
The relationship between LTV and CAC determines business viability:
LTV:CAC Benchmarks:
- Less than 1:1 - You lose money on every customer (death spiral)
- 1:1 to 2:1 - Barely sustainable, little margin for error
- 3:1 - Healthy benchmark for most e-commerce
- 4:1+ - Excellent, indicates pricing power and efficiency
- 10:1+ - Either you have incredible margins or you're underinvesting in growth
Example Analysis:
- Company A: LTV = $300, CAC = $150, Ratio = 2:1 (concerning)
- Company B: LTV = $900, CAC = $150, Ratio = 6:1 (excellent)
Company B can outspend Company A on acquisition while remaining more profitable. This compounding advantage is why strong unit economics create competitive moats that are almost impossible to overcome.
Contribution Margin: The Per-Unit Profitability Picture
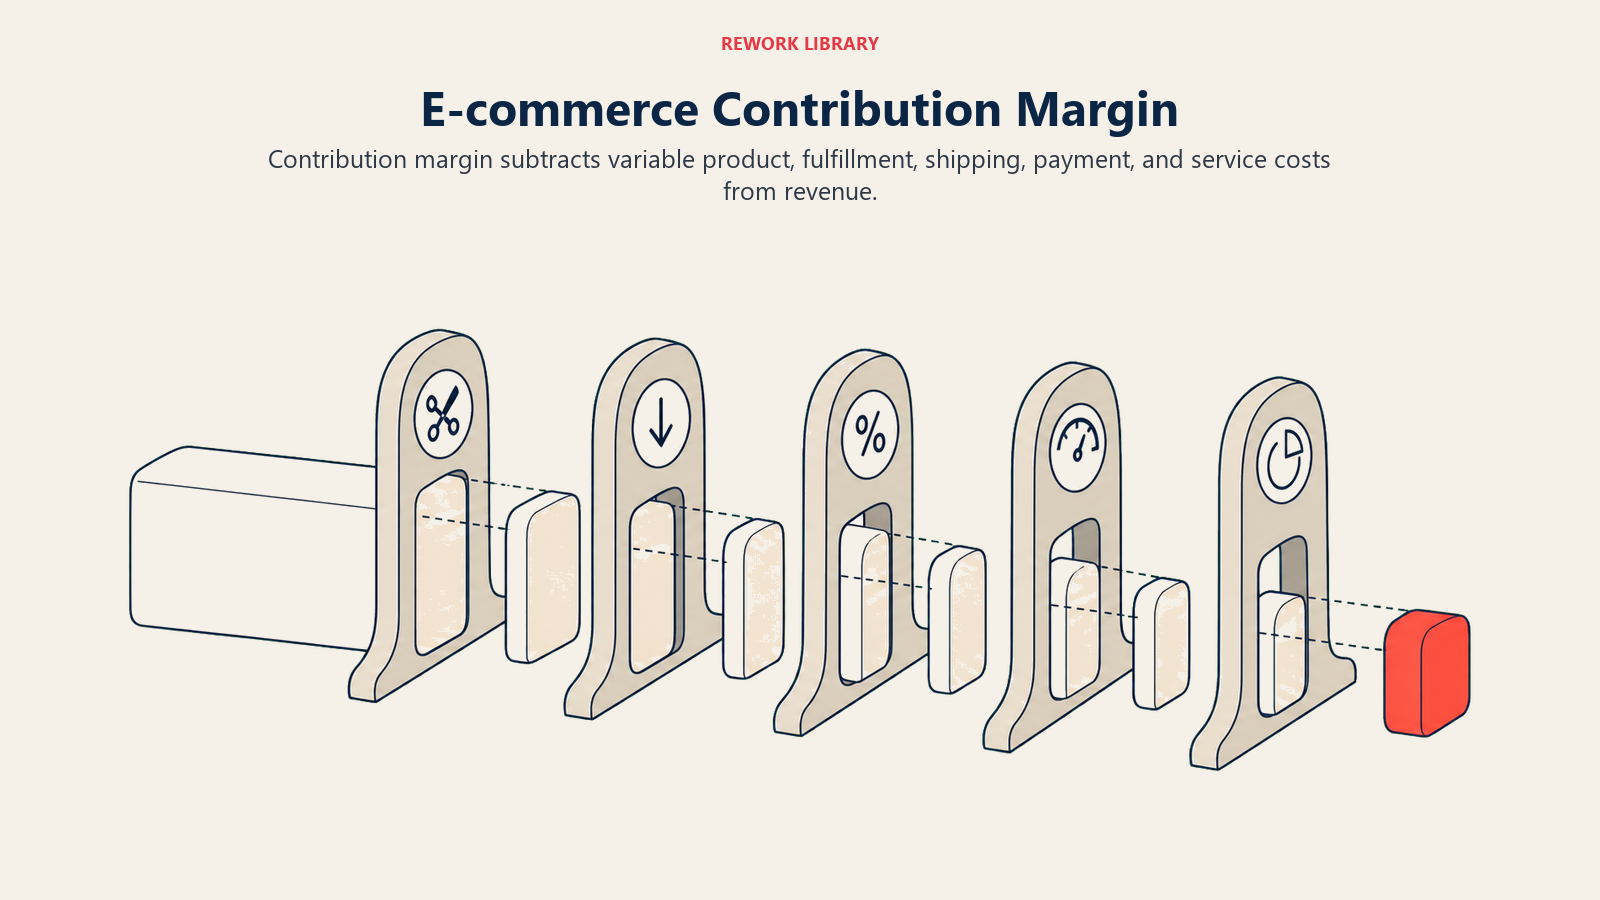
Contribution margin tells you how much profit each transaction contributes to covering fixed costs and generating profit after variable costs.
Contribution Margin vs Gross Margin
Many e-commerce operators confuse these metrics:
Gross Margin = (Revenue - COGS) / Revenue
- Only subtracts Cost of Goods Sold
- Ignores fulfillment, shipping, payment processing
Contribution Margin = (Revenue - COGS - Variable Costs) / Revenue
- Subtracts all variable costs per order
- Shows true profitability per transaction
Example:
- Order value: $100
- COGS: $35
- Shipping cost: $8
- Payment processing: $3
- Packaging: $2
- Customer service (allocated): $2
Gross Margin: ($100 - $35) / $100 = 65% Contribution Margin: ($100 - $35 - $8 - $3 - $2 - $2) / $100 = 50%
That 15-point difference is significant. A business that thinks it has 65% margins but actually has 50% will make catastrophic errors in CAC spending limits.
Using Contribution Margin for Decision-Making
Contribution margin per order tells you:
How much you can spend on CAC: If your first-order contribution margin is $50, and you need a 3:1 LTV:CAC ratio, you can't spend more than $50 CAC even if your full LTV is $150.
Which products to promote: Products with higher contribution margins should get more marketing investment, even if they have lower revenue.
Whether discounts make sense: A 20% discount on a product with 30% contribution margin makes you unprofitable on first purchase. You're betting entirely on repeat purchases.
Which channels to scale: Channels with high CAC only work if you have high contribution margins to support them.
Effective pricing strategy for e-commerce must account for contribution margin reality, not just gross margin theory.
Product-Level Unit Economics: SKU Profitability Analysis
Your blended metrics hide the truth. Some products make money, others lose it. You need to know which is which.
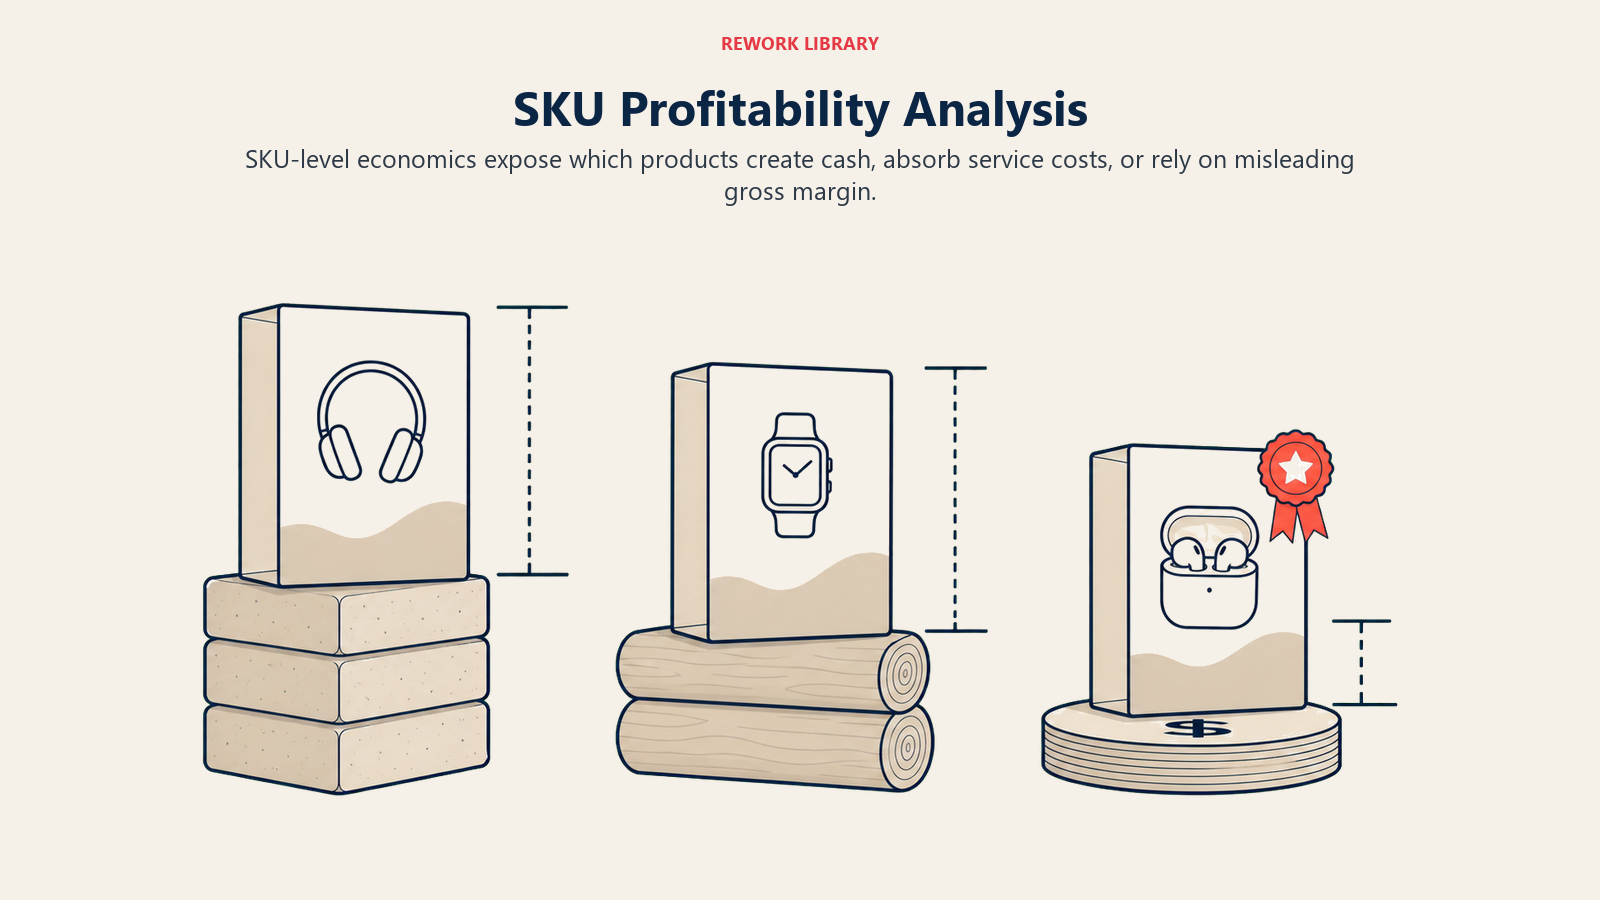
Calculating SKU-Level Profitability
Per-Product Unit Economics:
Product Contribution = Selling Price - COGS - Fulfillment Cost - Payment Processing - Allocated Marketing
Example Product Analysis:
| Product | Price | COGS | Fulfillment | Processing | Contribution | Margin % |
|---|---|---|---|---|---|---|
| Premium Widget | $89 | $28 | $6 | $3 | $52 | 58% |
| Standard Widget | $49 | $22 | $6 | $2 | $19 | 39% |
| Budget Widget | $29 | $19 | $6 | $1 | $3 | 10% |
The budget widget barely makes money and might actually lose money once you factor in returns and customer service.
Product Mix Optimization Strategy
Once you know product-level economics:
1. Push High-Contribution Products
- Feature them prominently on site
- Allocate more ad spend
- Include in bundles as lead products
- Train support team to recommend them
2. Fix or Kill Low-Contribution Products
- Increase prices
- Reduce COGS through better sourcing
- Bundle with high-margin products
- Discontinue if unfixable
3. Use Loss Leaders Strategically
- Low-margin products can work if they:
- Drive high repeat purchase rates
- Naturally bundle with high-margin items
- Attract customers who buy other products
- Never acceptable if customers only buy the loss leader
4. Analyze Return Rates by Product High-return products destroy unit economics. A product with 30% returns and 40% margin actually has 28% effective margin after returns processing costs. Effective inventory management helps you identify and address products with poor return economics.
Cohort Analysis: How Unit Economics Evolve Over Time
Your customers' value changes over time. Cohort analysis reveals these patterns.
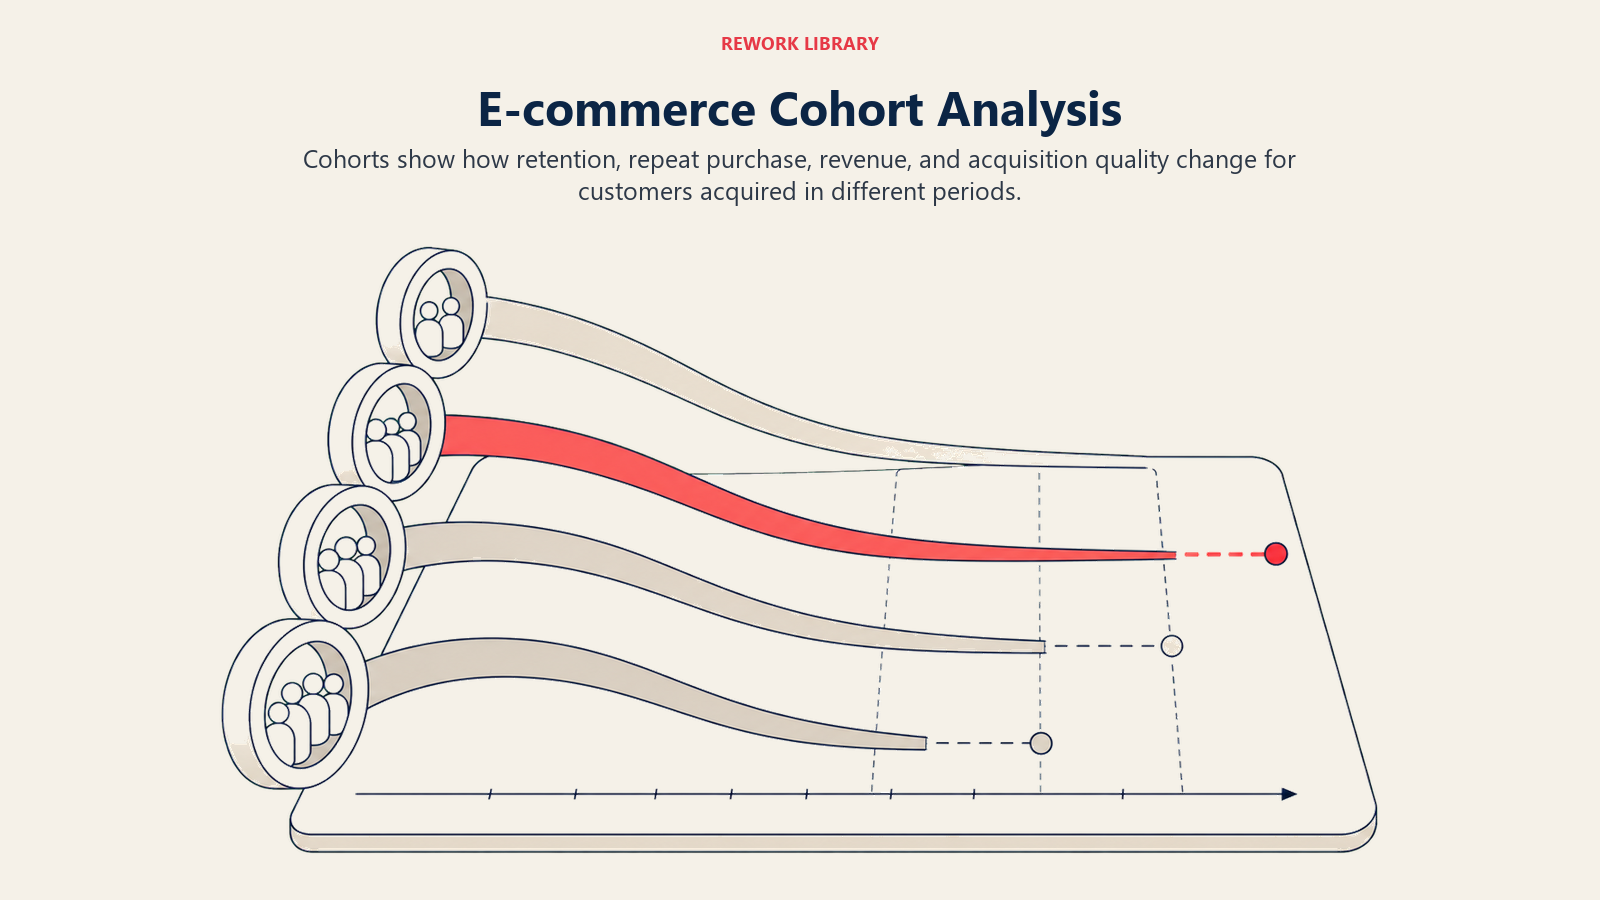
Building Cohort Retention Tables
Track customers by acquisition month and measure their purchase behavior over time:
Example Cohort Analysis:
| Acquisition Month | Month 0 | Month 1 | Month 2 | Month 3 | Month 6 | Month 12 |
|---|---|---|---|---|---|---|
| January 2024 | 100% | 22% | 18% | 14% | 10% | 6% |
| February 2024 | 100% | 28% | 23% | 18% | 12% | 8% |
| March 2024 | 100% | 31% | 26% | 21% | 15% | - |
This shows February cohort is retaining better than January. Investigate what changed, different acquisition channels, better onboarding, improved product quality?
Calculating Cohort LTV
True LTV comes from cohort analysis, not averaged formulas:
Month-by-Month LTV Buildup:
Cohort LTV = Σ (Retention Rate × Average Order Value × Gross Margin)
Example:
- Month 0: 100% × $100 × 0.6 = $60
- Month 1: 25% × $110 × 0.6 = $16.50
- Month 2: 20% × $110 × 0.6 = $13.20
- Month 3: 15% × $110 × 0.6 = $9.90
- Month 6: 10% × $115 × 0.6 = $6.90
- Month 12: 6% × $115 × 0.6 = $4.14
12-Month LTV = $110.64
This cohort-based calculation is more accurate than simplified formulas because it reflects actual customer behavior patterns.
Repeat Purchase Rates: The LTV Multiplier
First-time customer contribution margin is usually lower than repeat customer margin:
First Purchase:
- Order value: $100
- COGS + Variable costs: $50
- Contribution margin: $50
- But CAC: $75
- Net first purchase: -$25 (loss)
Repeat Purchase:
- Order value: $120 (higher AOV)
- COGS + Variable costs: $55
- Contribution margin: $65
- CAC: $0 (already acquired)
- Net repeat purchase: $65 (pure profit)
This is why retention and repeat purchase rates matter so much. Most e-commerce businesses operate at a first-purchase loss and rely entirely on repeat purchases for profitability.
Scaling Economics: How Unit Economics Change with Growth
Unit economics aren't static. They improve (or worsen) as you scale.
Economies of Scale: The Positive Effects
COGS Improvements:
- Larger orders = better supplier pricing
- Volume discounts from manufacturers
- Ability to order direct vs. through distributors
Example:
- Initial COGS at 100 units/month: $35 per unit
- COGS at 1,000 units/month: $29 per unit
- COGS at 10,000 units/month: $24 per unit
Fulfillment Efficiencies:
- Negotiated shipping rates with carriers
- Better warehouse efficiency
- Automated picking and packing
- Zone skipping for regional distribution
Fixed Cost Dilution:
- Software costs spread over more orders
- Marketing infrastructure costs spread wider
- Team costs as percentage of revenue decrease
Diseconomies of Scale: The Negative Effects
Not everything improves with scale:
CAC Inflation:
- Best channels get saturated first
- Need to expand to more expensive channels
- Market becomes aware of your category (more competition)
- Ad costs increase industry-wide
Example CAC Evolution:
- Year 1 CAC (Facebook ads only): $45
- Year 2 CAC (Facebook + Google): $62
- Year 3 CAC (Multi-channel): $89
Market Saturation:
- Addressable market isn't infinite
- Later customers are lower quality
- Geographic expansion enters worse-performing markets
Discounting Pressure:
- Aggressive competitors discount to gain share
- Customers expect promotions
- Margin compression to maintain growth
Organizational Costs:
- More management layers
- Process complexity
- Slower decision-making
- Higher salaries for talent
The key is ensuring positive scale effects outweigh negative ones. Track your unit economics quarterly to detect inflection points.
Channel-Specific Unit Economics: Why Owned vs. Paid Matters
Different acquisition channels have radically different economics:
Owned Channel Economics (Email, Organic, Direct)
Characteristics:
- Low marginal CAC (mostly fixed costs)
- Higher LTV (stronger brand connection)
- Longer payback periods to build
- Defensible competitive moat
Example:
- Email marketing to 50,000 subscribers
- Monthly software cost: $500
- Monthly revenue generated: $35,000
- Effective CAC: Almost zero on marginal customer
Investing in e-commerce SEO strategy has high upfront costs but dramatically improves long-term unit economics.
Paid Channel Economics (Ads, Affiliates, Influencers)
Characteristics:
- High marginal CAC (pay for each customer)
- Immediate scale potential
- No compounding benefits
- Vulnerable to competition
Example:
- Facebook ad campaign
- Spend: $10,000
- Revenue: $25,000
- CAC: $125
- Contribution margin: $60
- First-order ROI: Negative
Effective conversion rate optimization (CRO) becomes critical for paid channels because small improvements in conversion directly reduce CAC.
Marketplace Economics (Amazon, Walmart, Etsy)
Characteristics:
- Built-in traffic (low CAC)
- High commission costs (25-35% typically)
- Low customer loyalty (they're marketplace customers, not yours)
- Limited brand building
Example Marketplace Unit Economics:
- Selling price: $100
- Marketplace commission: $15
- Fulfillment fees: $8
- COGS: $35
- Net margin: $42 (42%)
Versus Own Site:
- Selling price: $100
- Payment processing: $3
- COGS: $35
- Fulfillment: $6
- Net margin: $56 (56%)
The 14-point margin difference matters enormously at scale. But marketplace provides volume you might not achieve alone.
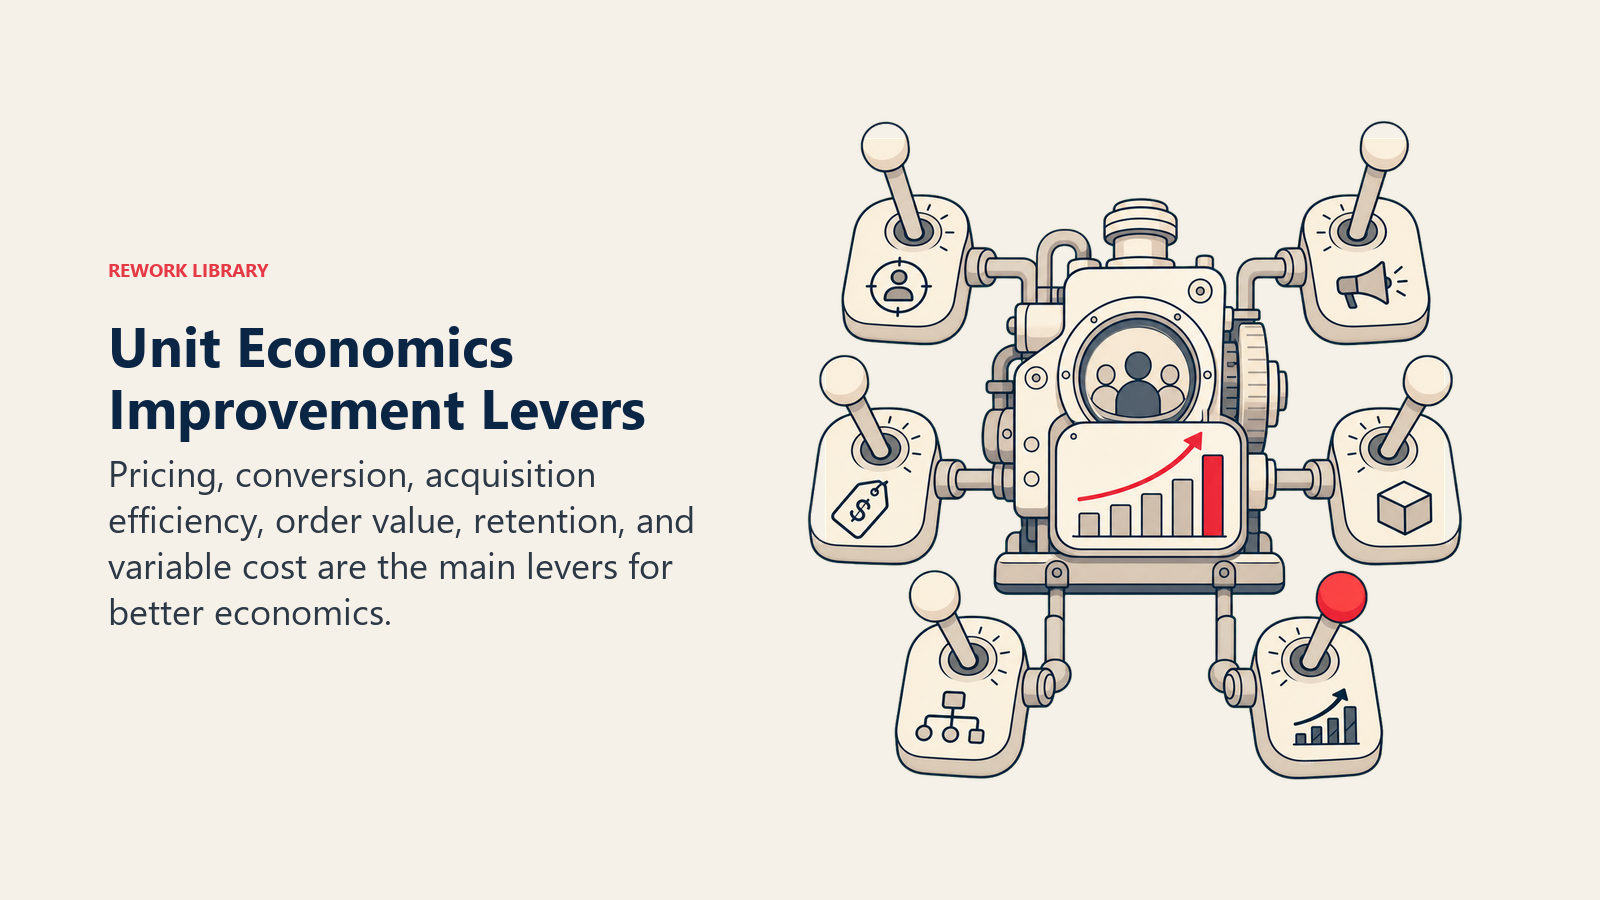
Unit Economics Optimization: Practical Levers to Pull
Now that you understand the framework, here's how to actually improve your unit economics:
Reducing CAC: Efficiency and Channel Mix
Improve Conversion Rates:
- Better product page optimization
- Streamlined checkout flow optimization
- Trust signals and social proof
- Mobile optimization
A 20% conversion rate improvement = 20% CAC reduction with same traffic quality. Implementing cart abandonment recovery strategies also reduces effective CAC by converting more of your existing traffic.
Optimize Channel Mix:
- Calculate CAC by channel monthly
- Shift budget from high-CAC to low-CAC channels
- Build owned assets (SEO, email list) to reduce paid dependence
Improve Targeting:
- Tighter audience definitions
- Lookalike modeling from best customers
- Exclude low-LTV customer profiles
- Geographic filtering to best-performing regions
Increasing LTV: Retention, AOV, Frequency
Boost Average Order Value:
- Product bundling
- Volume discounts
- Free shipping thresholds
- Strategic upsells
See our comprehensive guide on upsell and cross-sell tactics.
Increase Purchase Frequency:
- Post-purchase email sequences
- Replenishment reminders
- Loyalty programs
- Subscription options
Improve Retention:
- Better customer experience
- Proactive support
- Surprise and delight moments
- Community building
Reduce Churn:
- Identify at-risk customers
- Win-back campaigns
- Address product quality issues
- Competitive monitoring
Improving Margins: Pricing, Sourcing, Operations
Optimize Pricing:
- Test higher prices (many e-commerce businesses underprice)
- Premium positioning
- Dynamic pricing by segment
- Psychological pricing tactics
Reduce COGS:
- Negotiate with suppliers
- Order larger quantities
- Source direct from manufacturers
- Consider private label vs. reselling branded products
- Explore fulfillment strategy options to optimize costs
Operational Efficiency:
- Reduce returns through better product content
- Optimize shipping zone distribution
- Automate customer service for common issues
- Reduce packaging costs
Building Your Unit Economics Dashboard
Track these metrics monthly (or weekly if you're scaling fast):
Core Metrics to Monitor
Acquisition Metrics:
- Overall CAC
- CAC by channel
- CAC by cohort
- CAC trend over time
Retention Metrics:
- Cohort retention curves
- Repeat purchase rate by cohort
- Average time between purchases
- Churn rate
Value Metrics:
- LTV by cohort
- LTV by acquisition channel
- AOV trends
- Purchase frequency trends
Profitability Metrics:
- Contribution margin per order
- Contribution margin by product
- LTV:CAC ratio by cohort and channel
- CAC payback period
Red Flags to Watch For:
- CAC increasing faster than LTV
- Payback period extending beyond 12 months
- Declining repeat purchase rates in recent cohorts
- Contribution margins compressing
- LTV:CAC ratio falling below 3:1
Forecasting with Unit Economics
Once you have solid unit economics data, you can forecast with confidence:
Growth Scenario Planning:
If we spend $X on acquisition:
- We'll acquire Y customers (X / CAC)
- They'll generate Z revenue in Year 1 (Y × First Year Revenue per Customer)
- They'll generate W profit over lifetime (Y × LTV)
- Our payback will occur in M months (CAC / Monthly Contribution)
This transforms growth from guessing to calculating. You know exactly what returns to expect from acquisition investment.
Common Unit Economics Mistakes to Avoid
Mistake #1: Using Blended Metrics Only Your average CAC and LTV hide critical channel and cohort differences. Some channels might be wildly profitable while others lose money. Blended metrics mask this.
Mistake #2: Ignoring Time Value of Money A dollar today is worth more than a dollar in three years. If your payback period is 24 months, you need to discount future cash flows. Otherwise you're overstating LTV.
Mistake #3: Forgetting Variable Costs in Contribution Margin Shipping, payment processing, packaging, customer service, and returns all eat into margin. Many businesses only subtract COGS and wonder why they're not profitable.
Mistake #4: Assuming Linear Scaling Your CAC at $10K/month spend won't be the same at $100K/month. As you scale, costs typically increase and efficiency often decreases in paid channels.
Mistake #5: Overestimating Retention New cohorts often retain differently than old cohorts. Market conditions change, competition intensifies, product quality varies. Don't assume retention rates from 2022 cohorts will apply to 2026 cohorts.
Mistake #6: No Attribution Model If you can't track which channel actually drove each customer acquisition, you can't calculate accurate channel-level CAC. Multi-touch attribution gets complex but is necessary.
Putting It All Together: The Unit Economics Health Check
Use this framework to assess your current unit economics health:
Healthy E-commerce Unit Economics:
- LTV:CAC ratio above 3:1
- CAC payback period under 12 months
- Contribution margin above 40%
- Repeat purchase rate above 30% (in first 90 days)
- CAC trend stable or declining over past 6 months
- LTV trend stable or increasing over past 6 months
Warning Signs:
- LTV:CAC ratio between 2:1 and 3:1
- CAC payback period 12-18 months
- Contribution margin 25-40%
- Repeat purchase rate 15-30%
- CAC increasing moderately
- LTV flat or slightly declining
Critical Issues:
- LTV:CAC ratio below 2:1
- CAC payback period above 18 months
- Contribution margin below 25%
- Repeat purchase rate below 15%
- CAC rapidly increasing
- LTV declining
If you're in the critical zone, you need immediate action, raise prices, cut CAC spending to only profitable channels, or fix retention before scaling further.
Conclusion: Unit Economics as Your North Star
Revenue growth without unit economics is a mirage. It feels like progress until you run out of cash.
Every scaling decision should start with unit economics:
- Can we afford to acquire customers in this channel?
- Does this product mix improve overall profitability?
- Should we raise prices even if it reduces volume?
- Which customer segments should we target?
- How much can we invest in retention programs?
The businesses that master unit economics build sustainable competitive edges. They outspend competitors on acquisition while remaining more profitable. They weather downturns because their fundamentals are solid. They scale confidently because the math works.
Start measuring your unit economics today. Calculate your true CAC, understand your actual LTV, and know your contribution margins by product and channel. Then optimize relentlessly.
Because in e-commerce, the numbers don't lie. Your unit economics will tell you the truth about your business long before your revenue does.
Ready to master e-commerce profitability? Start by implementing a comprehensive e-commerce metrics and KPIs dashboard to track unit economics in real-time.
Learn more:

Senior Operations & Growth Strategist
On this page
- What are Unit Economics?
- Why Unit Economics Matter More Than Revenue
- Customer Acquisition Cost (CAC): The True Cost of Growth
- Calculating Your True CAC
- CAC by Channel: Why It Varies Wildly
- CAC Payback Period: When Do You Break Even?
- Customer Lifetime Value (LTV): The Revenue Side of the Equation
- Calculating LTV: The Complete Formula
- Components That Drive LTV
- The Critical LTV:CAC Ratio
- Contribution Margin: The Per-Unit Profitability Picture
- Contribution Margin vs Gross Margin
- Using Contribution Margin for Decision-Making
- Product-Level Unit Economics: SKU Profitability Analysis
- Calculating SKU-Level Profitability
- Product Mix Optimization Strategy
- Cohort Analysis: How Unit Economics Evolve Over Time
- Building Cohort Retention Tables
- Calculating Cohort LTV
- Repeat Purchase Rates: The LTV Multiplier
- Scaling Economics: How Unit Economics Change with Growth
- Economies of Scale: The Positive Effects
- Diseconomies of Scale: The Negative Effects
- Channel-Specific Unit Economics: Why Owned vs. Paid Matters
- Owned Channel Economics (Email, Organic, Direct)
- Paid Channel Economics (Ads, Affiliates, Influencers)
- Marketplace Economics (Amazon, Walmart, Etsy)
- Unit Economics Optimization: Practical Levers to Pull
- Reducing CAC: Efficiency and Channel Mix
- Increasing LTV: Retention, AOV, Frequency
- Improving Margins: Pricing, Sourcing, Operations
- Building Your Unit Economics Dashboard
- Core Metrics to Monitor
- Forecasting with Unit Economics
- Common Unit Economics Mistakes to Avoid
- Putting It All Together: The Unit Economics Health Check
- Conclusion: Unit Economics as Your North Star