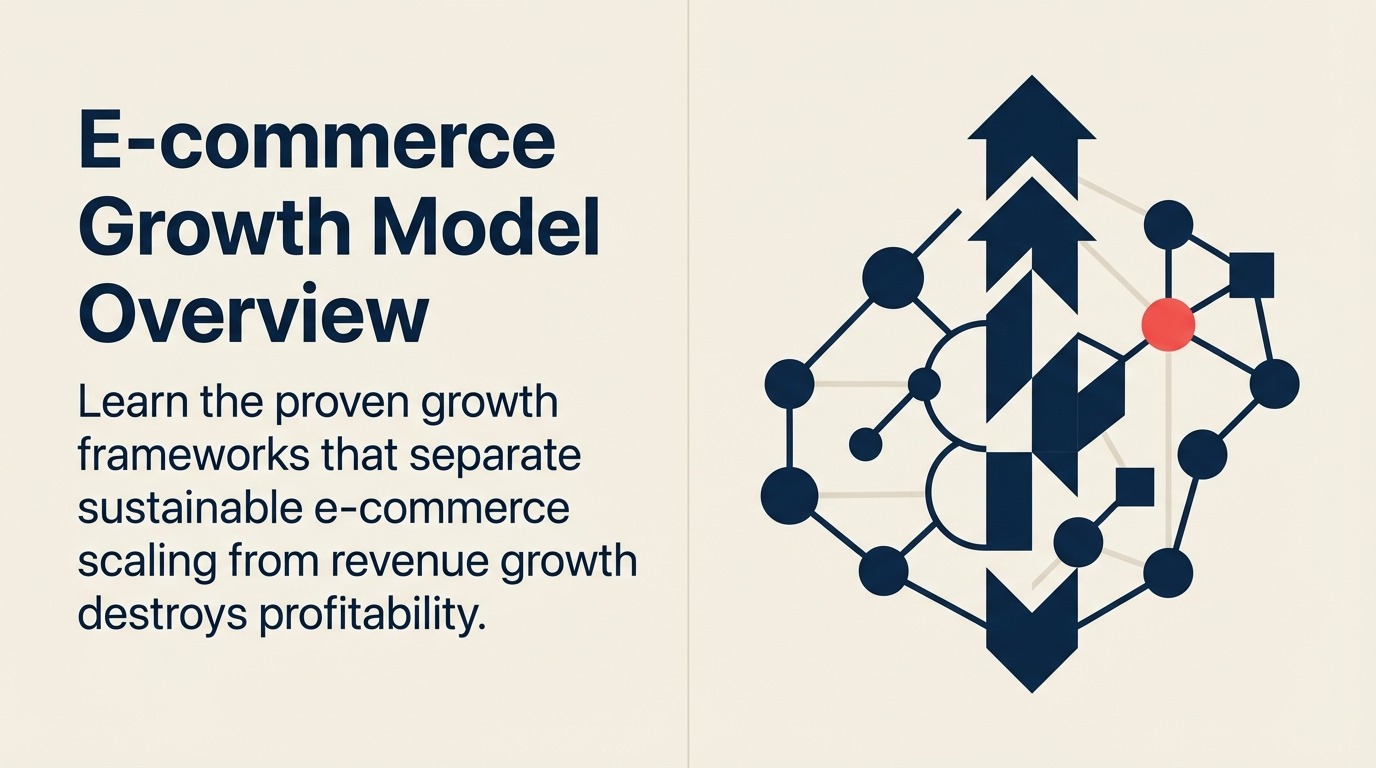
E-commerce Growth Model Overview: Frameworks for Scaling Online Revenue
Turn this article into takeaways for your work.
Each assistant summarizes the article only for you and suggests best practices for your work.
Ecommerce growth is the systematic, profitable expansion of online revenue across three engines: selling more to existing customers, acquiring new customers, and entering new markets. Sustainable growth optimizes unit economics, not just top-line revenue. Brands that hit a 3:1 customer lifetime value to acquisition cost ratio scale; those that ignore it fund growth with cash they never recover.
Most e-commerce growth initiatives die because they chase revenue instead of profitability.
A direct-to-consumer brand scaled from $5M to $25M in annual revenue in 18 months. Their investors celebrated. Their executive team got promotions. Then the CFO ran the numbers: every dollar of that new revenue cost $1.40 to generate. They weren't scaling a business. They were funding customer acquisition with venture capital.
If you're leading e-commerce operations, you've seen this pattern. Top-line growth looks impressive in board decks, but unit economics tell the real story. The difference between sustainable scaling and expensive theater comes down to understanding growth models. Not just what drives revenue, but what drives profitable, repeatable revenue.
What is an E-commerce Growth Model?
An e-commerce growth model is the systematic framework for how your business acquires customers, generates revenue, and expands market share while maintaining profitable unit economics. It's not a revenue target or a marketing plan. It's the operational and financial logic that determines whether growth creates or destroys value.
All e-commerce revenue isn't created equal. A $100 order from a first-time customer acquired through paid ads has completely different economics than a $100 reorder from an existing customer. A marketplace sale carries different margin implications than a direct-to-consumer transaction. International expansion involves different cost structures than domestic growth.
A good growth model accounts for these differences and optimizes for sustainable, profitable scaling, not just top-line growth.
The Foundation: Unit Economics You Can't Ignore
Before exploring growth engines and expansion strategies, you need to understand the financial fundamentals that determine whether growth is viable. Every e-commerce leader should know these numbers cold.
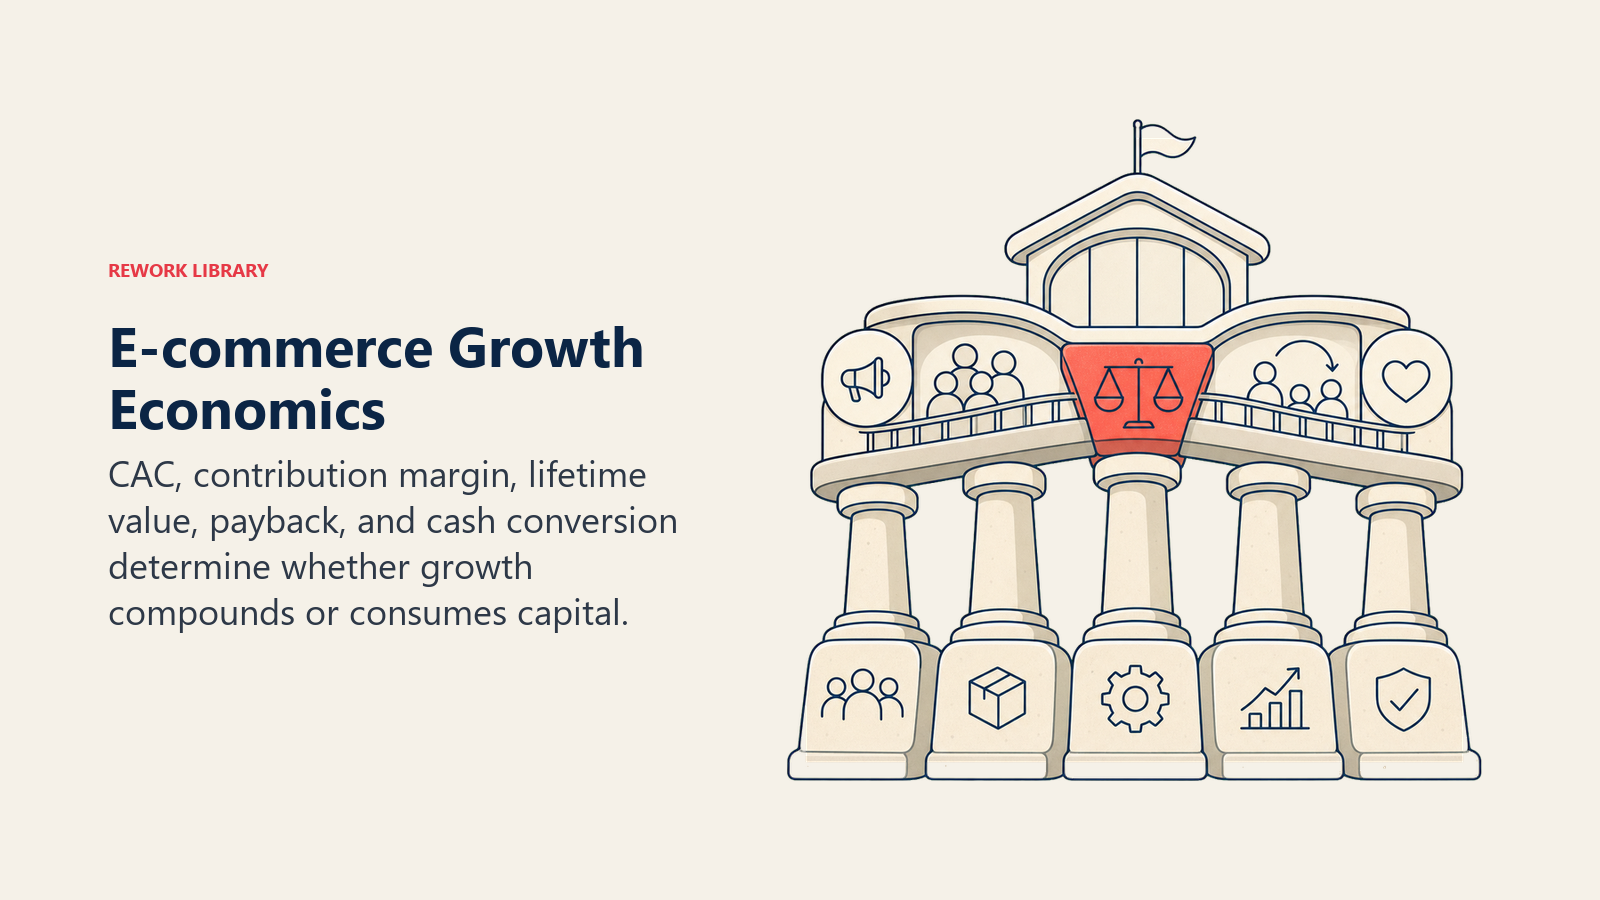
Customer Acquisition Cost (CAC)
The fully loaded cost of acquiring a new customer, including all marketing spend, attribution across channels, sales team costs, and platform fees. Understanding traffic acquisition strategy is key for managing these costs effectively.
The question you need to answer: How much does it actually cost to acquire a customer who completes their first purchase?
High-performing DTC brands typically see CAC between $30-$80. Marketplace sellers benefit from platform traffic and see $10-$25 CAC. B2B e-commerce often faces $200-$500 CAC due to longer sales cycles.
Customer Lifetime Value (CLV)
The total gross profit expected from a customer over their relationship with your brand. Not revenue, but gross profit. This matters because different product categories, price points, and customer segments deliver wildly different CLV. Mastering customer lifetime value calculation is critical for sustainable growth.
The calculation most companies get wrong: They use average order value instead of gross profit per order, and they assume repeat purchase rates that never materialize.
Sustainable e-commerce requires CLV:CAC ratios of at least 3:1. Best-in-class brands achieve 5:1 or better. Anything below 2:1 means you're burning cash to grow.
Payback Period
How long it takes to recover CAC from gross profit. This determines cash flow dynamics and capital requirements for scaling.
Why it matters: A brand with $50 CAC and $25 gross profit per order needs two purchases to break even. If those purchases happen within 90 days, growth is capital-efficient. If they take 18 months, you're financing growth with working capital or investor funds.
High-growth DTC brands target 6-12 month payback periods. Subscription models can achieve 3-6 months. Single-purchase luxury goods may accept 18-24 months if CLV justifies it.
Contribution Margin by Channel
The gross profit after subtracting variable costs including product costs, fulfillment, payment processing, and channel-specific fees.
The reality check: A $100 sale on Amazon with 15% referral fees, 3% payment processing, $15 fulfillment costs, and $40 product costs delivers $27 contribution margin. The same product sold DTC at $110 with $5 shipping costs delivers $50 contribution margin. Nearly double.
Channel economics fundamentally alter growth models. Understanding unit economics for ecommerce across different channels determines where to invest for profitable growth.
The Three Growth Engines: Where Revenue Actually Comes From
E-commerce growth doesn't come from one universal lever. It comes from three distinct engines that require different strategies, deliver different returns, and scale at different rates.
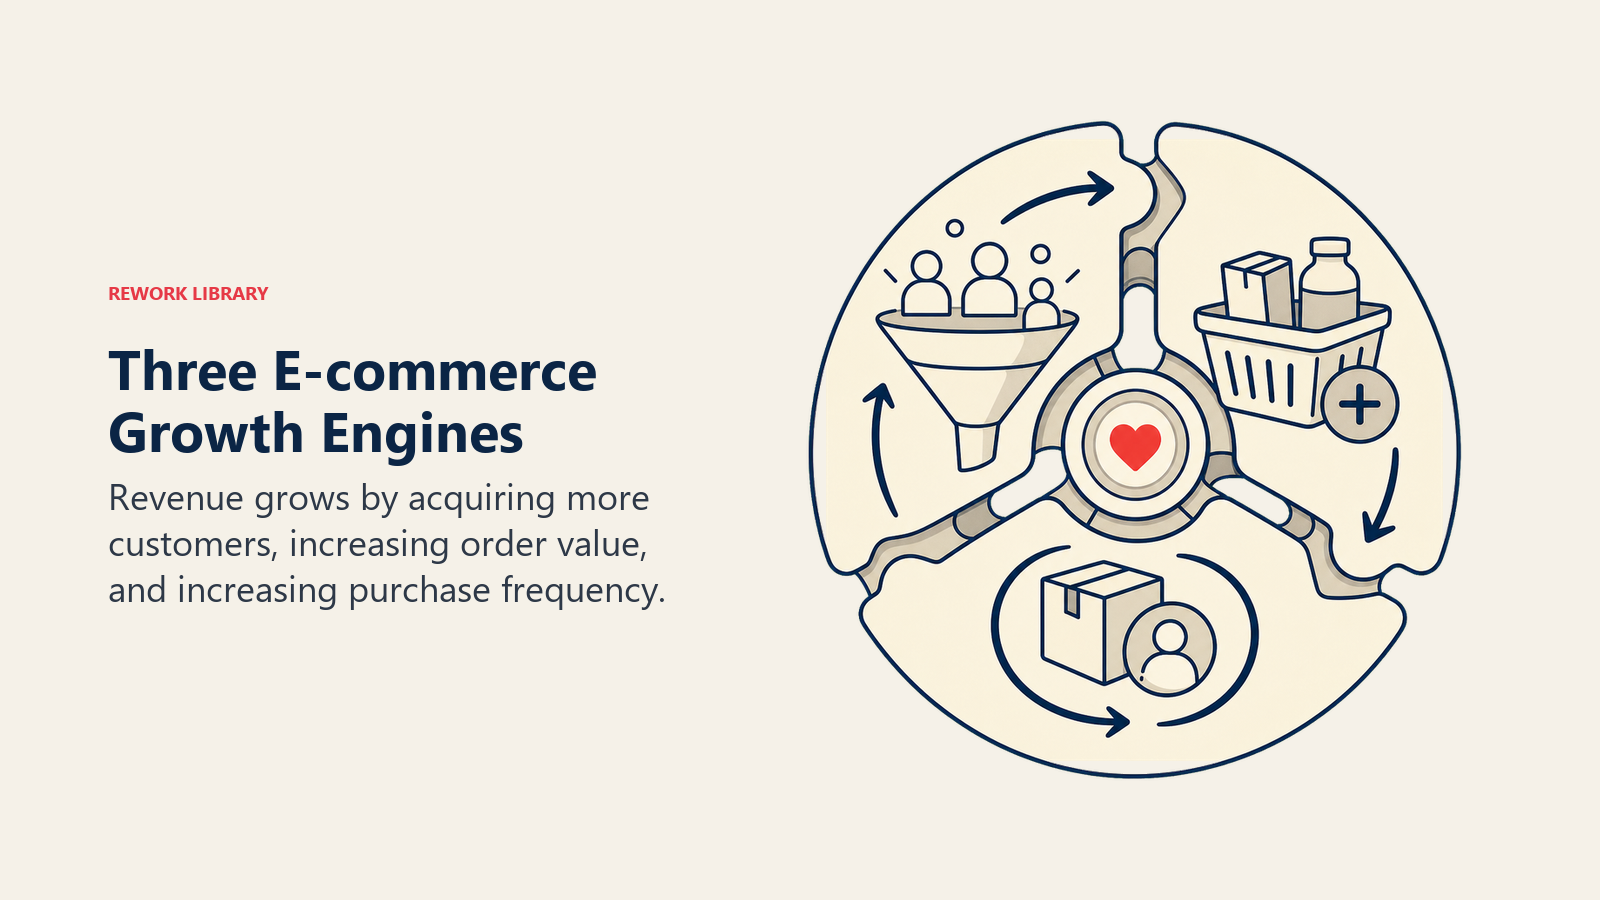
Growth Engine #1: Existing Customer Expansion (30-50% of Growth)
This is the most profitable growth engine: selling more to customers who already bought from you. The economics are fundamentally different because you've already paid CAC. Every subsequent purchase delivers pure contribution margin.
Why this engine matters:
Increasing average order value by 10% across existing customers requires no additional acquisition spend. Improving repeat purchase rates from 25% to 35% delivers 40% more revenue from the same customer base. And these improvements flow directly to profitability.
The strategic levers:
- Replenishment and subscription models: Consumables that customers reorder create predictable revenue streams
- Cross-sell and bundle optimization: Recommending complementary products during checkout or post-purchase through upsell cross-sell strategies
- Personalization engines: Targeted product recommendations based on purchase history and browsing behavior
- Loyalty programs: Rewarding repeat purchases to increase frequency and retention through loyalty programs
Brands that master repeat purchase strategy economics see 30-50% of annual revenue growth come from existing customers, at gross margins 20-30 percentage points higher than new customer acquisition.
Growth Engine #2: New Customer Acquisition (40-60% of Growth)
This engine drives market penetration and top-line expansion, but it's the most expensive. Every new customer requires upfront CAC investment before delivering any profit.
The fundamental tension:
Customer acquisition costs rise as you expand beyond your core audience. Your first 10,000 customers come from highly targeted, efficient channels. Your next 50,000 require broader targeting, more competitive bidding, and higher cost-per-acquisition.
The strategic approach:
- Paid advertising optimization: Balancing bid strategies, audience targeting, and creative testing across platforms like Google Shopping ads and Facebook Instagram ads
- Organic search and SEO: Building long-term traffic sources with lower marginal costs through ecommerce SEO strategy
- Influencer and partnership marketing: Leveraging third-party audiences for awareness and conversion
- Retention-driven acquisition: Acquiring customers with high predicted CLV, not just low CAC
The mistake: optimizing for cost-per-acquisition without considering customer quality. A $30 CAC customer who never repurchases is worse than a $60 CAC customer who generates $300 CLV.
Growth Engine #3: Market Expansion (10-20% of Growth)
This engine drives growth through new channels, geographies, customer segments, or product categories. It's the riskiest and most capital-intensive, but it unlocks entirely new revenue pools.
The expansion vectors:
- Channel expansion: Moving from DTC to marketplaces like Amazon FBA, retail partnerships, or wholesale
- Geographic expansion: Entering new countries or regions
- Segment expansion: Targeting new customer demographics or psychographics
- Product category expansion: Adding complementary product lines or verticals
Each expansion carries different risk and return profiles. Consider multi-channel marketplace strategy for diversified growth.
The strategic discipline required:
Market expansion failures stem from treating new markets like existing ones. International customers have different preferences, payment methods, shipping expectations, and price sensitivity. B2B buyers require different sales approaches than B2C consumers. Each expansion needs its own unit economics model and go-to-market strategy.
Marketplace vs Direct-to-Consumer: The Model That Changes Everything
One of the most consequential decisions in e-commerce growth is channel strategy: whether to sell primarily through marketplaces (Amazon, eBay, Walmart.com) or build direct-to-consumer channels.
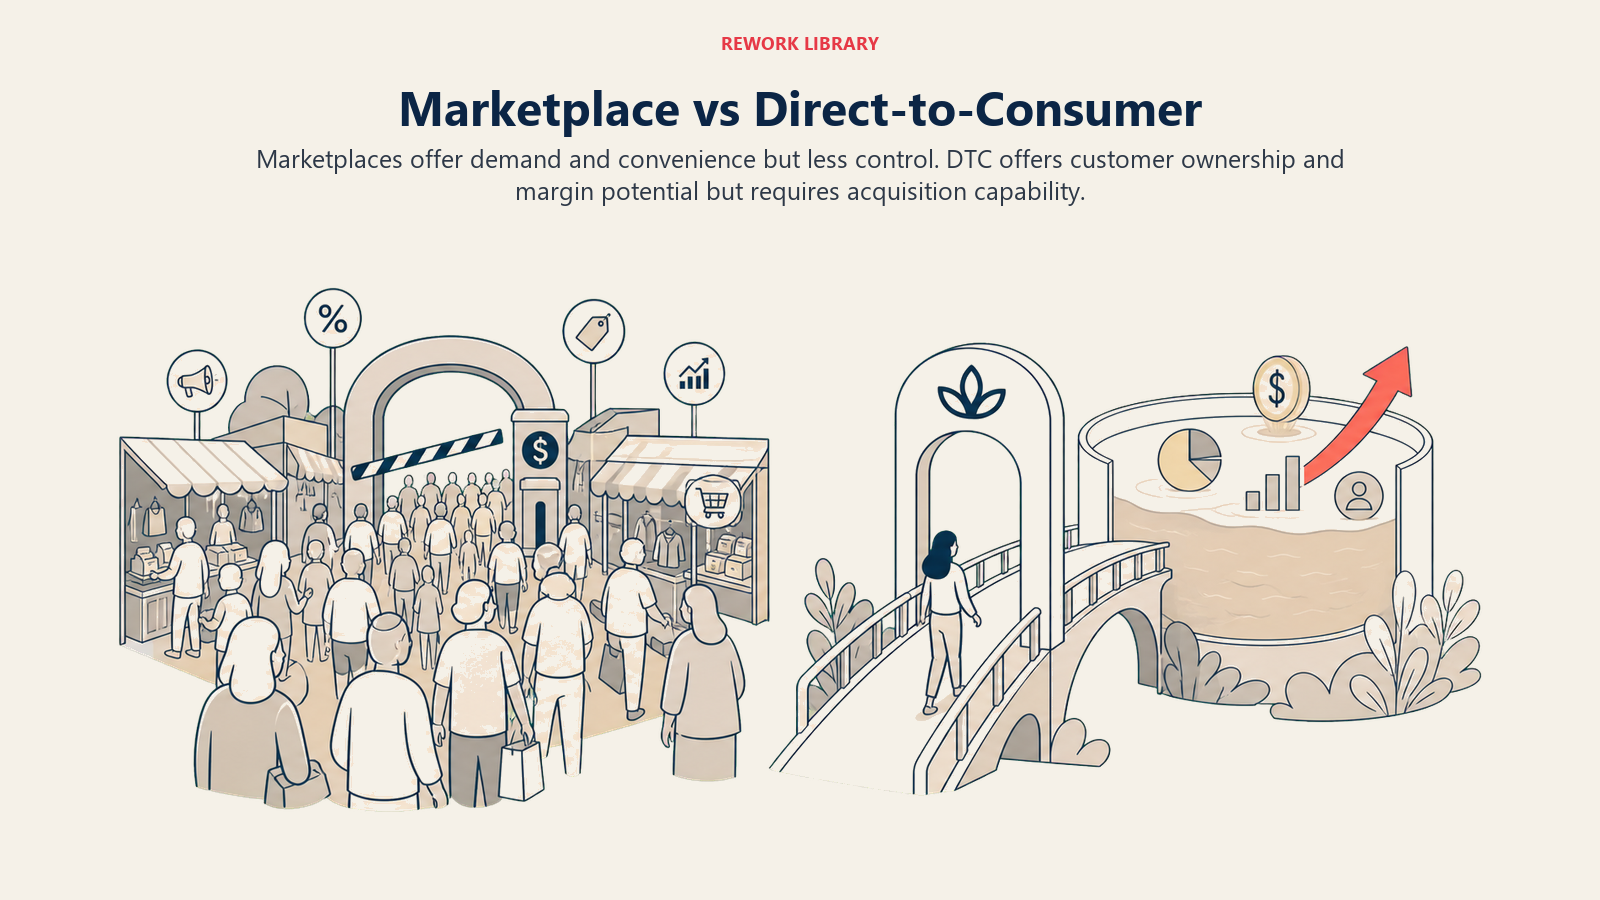
Marketplace Model Economics
The trade-off: Marketplaces provide instant traffic and conversion infrastructure, but they extract 10-20% of revenue in fees and limit customer data access.
Profitability dynamics:
- Referral fees: 8-15% of GMV on Amazon, 6-12% on eBay
- Fulfillment fees: $3-$8 per unit via FBA
- Advertising costs: 15-30% of sales to maintain visibility through Amazon advertising
- Net contribution margin: 10-25% after all fees
Growth rate characteristics:
- Fast initial scaling due to existing customer base
- High competition drives continuous ad spend
- Limited brand equity and customer relationships
- Difficult to expand CLV beyond first purchase
Direct-to-Consumer Model Economics
The trade-off: DTC requires building traffic and conversion from scratch, but it offers higher margins, customer data ownership, and relationship control.
Profitability dynamics:
- Platform fees: 2-3% payment processing
- Fulfillment costs: $4-$10 per order via 3PL
- Marketing costs: 20-40% of revenue (higher upfront, decreasing over time)
- Net contribution margin: 30-50% with optimized operations
Growth rate characteristics:
- Slower initial growth due to audience building
- Decreasing CAC over time as brand awareness compounds
- Strong repeat purchase economics and CLV expansion
- Full control over customer experience and data
The hybrid strategy:
Most successful e-commerce brands operate both models. They use marketplaces for customer acquisition and brand awareness while building DTC channels for margin expansion and retention. Optimizing your conversion rate optimization strategy across all channels is essential for maximizing returns.
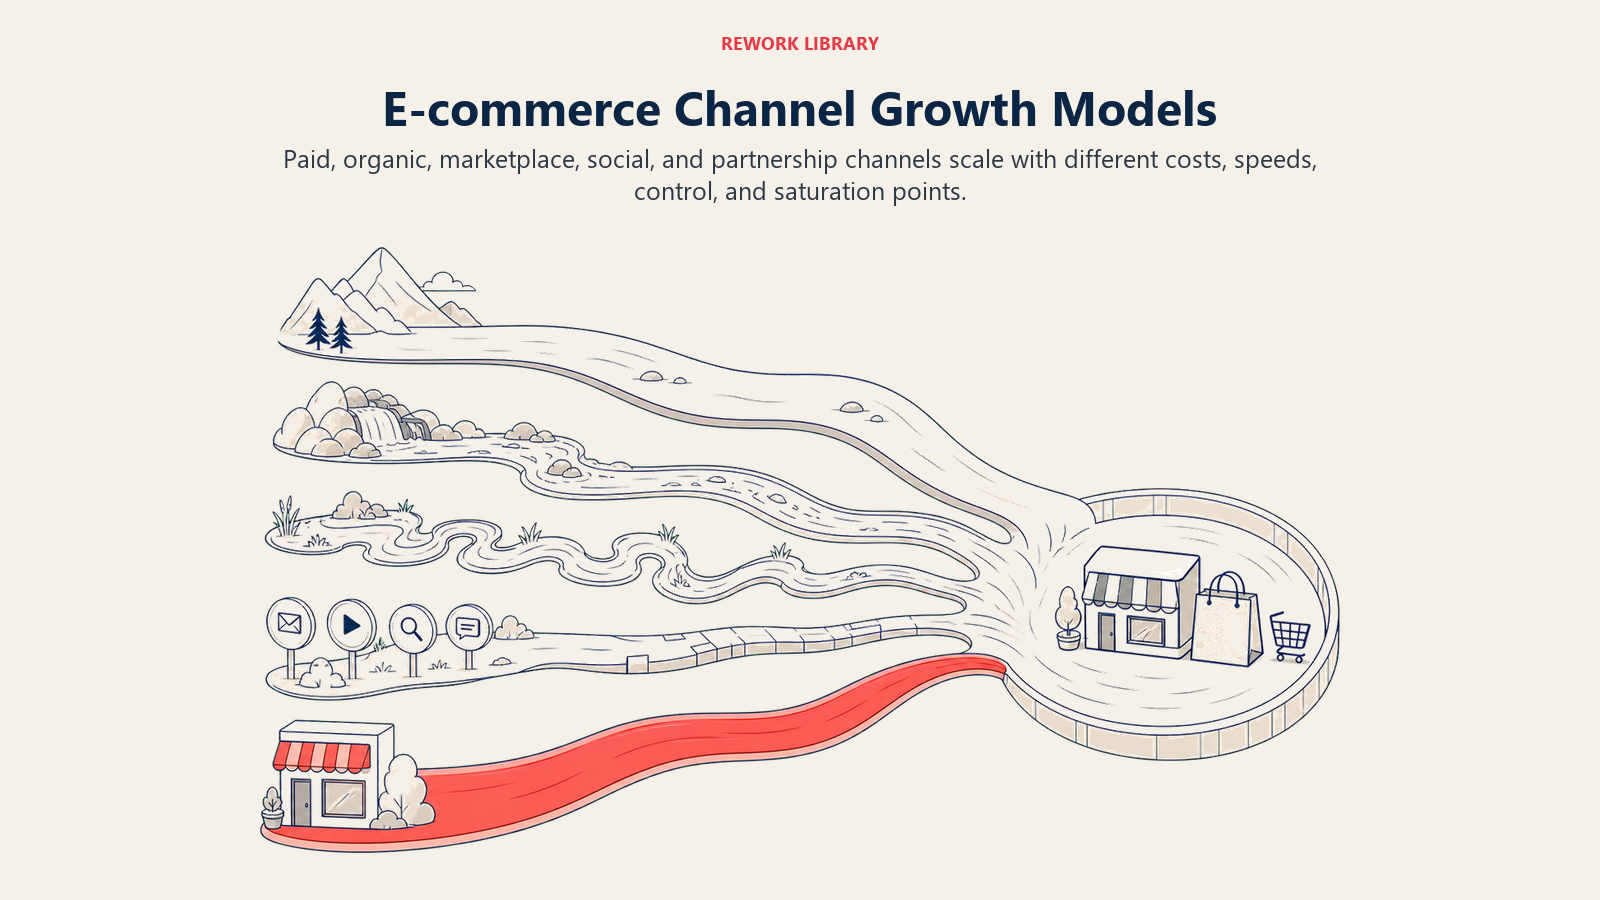
Channel-Specific Growth Models: Not All Traffic Sources Are Equal
Different acquisition channels exhibit fundamentally different scaling patterns and economic profiles. Understanding these dynamics prevents the common mistake of treating all marketing spend as interchangeable.
Organic Search and SEO Growth Trajectory
The pattern: Slow initial growth, compounding long-term returns, declining marginal cost.
SEO investments in content, technical optimization, and link building deliver minimal short-term revenue. But over 18-24 months, organic traffic compounds as rankings improve, content accumulates, and domain authority builds.
The economics:
- Upfront investment: $50,000-$200,000 in content, technical work, and backlinks
- Traffic growth: 10-30% month-over-month in months 12-24
- Marginal cost: Near-zero for incremental traffic once ranking is established
- Conversion rates: 2-5% for transactional queries
The strategic implication: SEO delivers the best ROI over 3-year timeframes but requires patience and upfront capital. It's a long-term growth engine, not a quarterly revenue tactic.
Paid Advertising Scaling Patterns and Diminishing Returns
The pattern: Fast initial growth, plateauing returns, rising CAC with scale.
Paid channels (Google Ads, Facebook Ads, Instagram, TikTok) deliver immediate traffic and revenue but face inevitable scaling challenges as you exhaust high-intent audiences.
The scaling curve:
- Phase 1 (Months 1-6): Low CAC, high ROAS as you target bottom-funnel, high-intent audiences
- Phase 2 (Months 6-18): Increasing CAC as you expand targeting to mid-funnel and cold audiences
- Phase 3 (Months 18+): Diminishing returns as market saturation and competitive pressure drive CAC up 30-100%
The strategic response:
Recognize paid advertising as an acquisition tool, not a sustainable growth engine. Use it to acquire customers, then shift focus to retention and CLV expansion to offset rising CAC.
Social Commerce and Influencer Partnerships
The pattern: Highly variable based on audience alignment, creative quality, and platform trends.
Social commerce (selling directly through Instagram, TikTok, Pinterest, or via influencer partnerships) delivers inconsistent but occasionally exceptional returns.
The economics:
- Influencer costs: $100-$10,000 per post depending on audience size
- Conversion rates: 0.5-3% for cold audiences, 3-10% for highly aligned audiences
- Attribution challenges: Difficult to isolate social impact from other channels
The strategic approach:
Treat social commerce as brand building and audience expansion, not performance marketing. Measure incrementality and brand lift, not just last-click attribution.
Subscription and Recurring Revenue Models
The pattern: Predictable growth, high customer retention, superior CLV economics.
Subscription models (monthly product shipments, membership programs, auto-replenishment) fundamentally change growth economics by creating recurring revenue and reducing dependence on acquisition. Developing a strong subscription model design can transform your business economics.
The economics:
- Higher initial CAC tolerance (3-6 month payback acceptable)
- Monthly recurring revenue (MRR) compounds over time
- Churn rates of 5-10% monthly typical for consumables
- CLV 3-5x higher than single-purchase models
Subscription models transform unit economics, enabling higher acquisition spending while maintaining profitability through retention.
Product Mix Strategies: Growing Through Assortment Optimization
Revenue growth doesn't only come from customer acquisition. It comes from selling more products to the same customers through strategic approaches like product bundling and AOV optimization strategy.
Horizontal Expansion: Categories and SKUs
The approach: Adding new product categories or expanding SKU count within existing categories to increase average order value and purchase frequency.
Example: A skincare brand selling cleansers and moisturizers expands into serums, toners, and sunscreens. Each new category creates cross-sell opportunities and increases basket size.
The economics:
- Inventory costs increase with SKU proliferation
- Margin optimization through bundling and kitting
- Complexity in forecasting and supply chain management
When it works: When new products have high attachment rates to existing purchases and when operational complexity doesn't erode margins faster than revenue grows.
Vertical Penetration: Price Tiers and Segments
The approach: Introducing multiple price tiers (premium, mid-tier, value) to capture different customer segments and maximize willingness to pay.
Example: A furniture brand offers basic, premium, and luxury versions of the same product line at $299, $599, and $1,299 price points.
The economics:
- Higher gross profit dollars from premium tiers
- Larger addressable market from value tiers
- Risk of cannibalization if tiers aren't properly differentiated
When it works: When customer segments have distinct price sensitivity and when premium tiers deliver genuine value differentiation.
Bundle and Cross-Sell Optimization
The approach: Systematically pairing complementary products to increase average order value without additional acquisition costs.
Example: A coffee brand bundles beans, grinder, and filters at a 15% discount versus individual purchases.
The economics:
- 10-20% increase in AOV from optimized bundling
- Improved inventory turnover for slower-moving SKUs
- Enhanced customer satisfaction through curated experiences
The strategic lever: Use purchase data and analytics to identify natural product affinities, then systematically surface bundles at checkout and in post-purchase emails.
International Growth Framework: Expanding Beyond Domestic Markets
Geographic expansion offers massive revenue potential but introduces operational complexity, margin pressure, and execution risk. Developing a comprehensive international shipping strategy is crucial for success.
Market Selection Criteria and Sequencing
The framework: Not all international markets offer equal opportunity. Prioritize based on:
- Market size and growth rate: Total addressable market and e-commerce penetration
- Competitive intensity: Existing players and barriers to entry
- Logistics feasibility: Shipping costs, delivery times, customs complexity
- Payment infrastructure: Preferred payment methods and currency dynamics
- Regulatory environment: Tax, data privacy, and compliance requirements
The sequencing strategy:
Start with English-speaking markets with similar consumer preferences (UK, Canada, Australia) before tackling higher-complexity markets (Japan, Germany, Brazil). Each expansion should be profitable before adding the next.
Localization vs Standardization
The tension: Localization (adapting products, messaging, pricing, and operations to local markets) increases relevance but reduces efficiency. Standardization maintains operational simplicity but may limit market penetration.
The strategic choices:
- Product localization: Adjusting formulations, sizes, or features for local preferences
- Content localization: Translating and culturally adapting product descriptions, marketing, and support
- Pricing localization: Adjusting for purchasing power and competitive dynamics
- Operational localization: In-country fulfillment, local payment methods, regional customer service
The principle: Localize where it drives measurable conversion lift. Standardize where local adaptation provides minimal value.
Currency and Payment Complexity
The operational reality: International expansion introduces currency risk, payment method diversity, and transaction cost complexity.
The considerations:
- Currency volatility can erode margins by 5-15% if not hedged
- Payment preferences vary dramatically (credit cards in US, bank transfers in Germany, digital wallets in Asia)
- Cross-border payment processing costs 3-5% versus 2-3% domestic
- Tax and VAT compliance requires specialized expertise
Successful international growth requires finance and operations teams to build currency hedging strategies, multi-currency pricing logic, and region-specific payment processing.
Retention and Loyalty Economics: The Growth Multiplier
While acquisition drives new revenue, retention determines whether that revenue compounds or evaporates. The most overlooked growth lever in e-commerce is improving retention by just 5-10%.
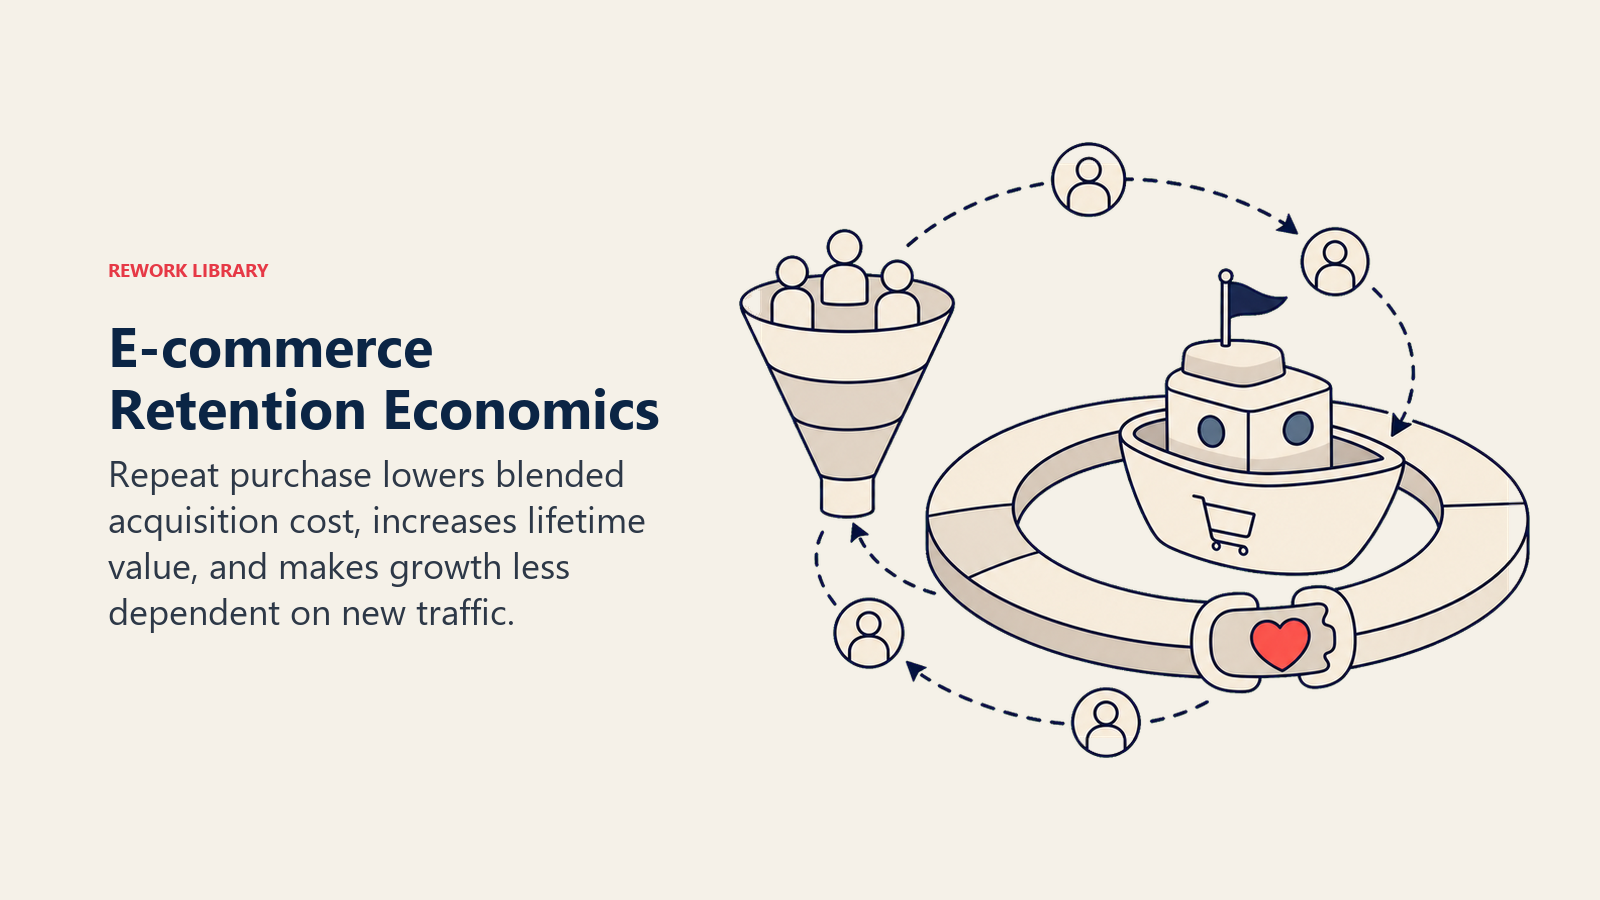
Repeat Purchase Rate Impact on Growth
The math: A brand with 25% annual repeat purchase rate sees each 100 new customers generate 25 additional orders the following year. Improving that to 35% generates 40% more revenue from the same cohort, with zero additional acquisition spend.
The economics:
- Repeat customers deliver 2-5x higher gross profit per order (no CAC)
- Repeat purchase rates vary by category: consumables 40-60%, apparel 20-35%, electronics 10-20%
- Each percentage point improvement in retention compounds over customer lifetime
The strategic priority: Retention improvements deliver superior ROI compared to acquisition optimization. A 10% increase in retention typically outperforms a 10% decrease in CAC.
Cohort Analysis and Churn Patterns
The discipline: Tracking customer cohorts over time reveals retention patterns, identifies churn triggers, and measures the impact of retention initiatives. Using ecommerce metrics KPIs effectively guides these insights.
What to measure:
- Month 1, 3, 6, 12 repurchase rates by acquisition cohort
- Revenue per cohort over time (expanding or contracting?)
- Churn triggers (failed payments, stockouts, poor experience)
- Cohort-level CLV and payback dynamics
The insight: Cohorts acquired from different sources or at different price points exhibit dramatically different retention curves. Optimize acquisition for cohorts with the best long-term retention, not just lowest CAC.
Personalization ROI Thresholds
The question: When does personalization investment pay off?
The answer: When the lift in conversion rate or AOV exceeds the cost of personalization technology and operational complexity.
The thresholds:
- Email personalization: Minimum 10,000 customers to justify dedicated tools
- On-site recommendation engines: Minimum $5M annual revenue to achieve positive ROI
- 1:1 dynamic pricing: Minimum $25M annual revenue and sophisticated analytics
Personalization works at scale. Pre-scale, focus on segmentation: grouping customers into 5-10 segments and tailoring messaging accordingly.
Technology: How Systems Drive Margin Expansion
Growth doesn't only come from more revenue. It comes from improving margins while scaling. Technology enables margin expansion through automation, targeting efficiency, and conversion optimization.
Automation for Margin Expansion
The principle: Automate repetitive, high-volume tasks to reduce labor costs and improve speed.
The applications:
- Order fulfillment automation: Warehouse robotics and pick-pack-ship systems reduce per-unit labor costs by 30-50%
- Customer service automation: Chatbots and self-service portals handle 40-60% of support inquiries
- Marketing automation: Email sequences, abandoned cart recovery, and post-purchase nurture run without manual intervention
- Inventory management automation: Demand forecasting and reorder point systems prevent stockouts and overstock
The ROI threshold: Automation pays off when labor savings exceed technology costs plus implementation effort, typically at $10M+ annual revenue.
Data Analytics for Targeting Efficiency
The capability: Using customer data, behavior analytics, and predictive models to improve acquisition targeting, reduce wasted ad spend, and increase conversion rates.
The applications:
- Lookalike modeling: Identifying prospects similar to best customers for paid social targeting
- Predictive CLV scoring: Prioritizing acquisition channels and campaigns that deliver high-LTV customers
- Channel attribution: Understanding true ROI by source, not just last-click attribution
- Cohort-based performance tracking: Measuring long-term value by acquisition source and campaign
Better analytics doesn't just improve decision-making. It reduces cost of acquisition by 15-30% through more precise targeting.
Personalization Engines and Conversion
The mechanism: Dynamically tailoring product recommendations, content, offers, and messaging based on individual customer behavior and preferences.
The impact:
- 10-30% increase in conversion rate from personalized product recommendations
- 15-25% increase in email open and click rates from personalized subject lines and content
- 5-15% increase in AOV from personalized bundles and upsells
The caveat: Personalization requires data scale, technical sophistication, and ongoing optimization. Pre-scale brands should focus on segmentation and basic behavioral triggers before investing in advanced personalization platforms.
The Bottom Line: Growth Models That Create Value vs Destroy It
The difference between sustainable e-commerce scaling and expensive revenue theater comes down to this: profitable growth models optimize for unit economics and customer lifetime value, not just top-line revenue.
The mistakes are predictable:
- Scaling customer acquisition without understanding cohort retention and CLV
- Expanding into new channels without modeling margin implications
- Growing SKU count without analyzing inventory costs and sell-through rates
- Entering international markets without accounting for logistics and compliance complexity
- Prioritizing revenue growth over contribution margin and cash flow
The high-performing approach:
- Start with unit economics: know your CAC, CLV, payback period, and contribution margin by channel
- Build growth models around the three engines: existing customer expansion, new acquisition, and market expansion
- Understand channel-specific dynamics: SEO compounds, paid ads plateau, subscriptions deliver recurring revenue
- Optimize product mix for cross-sell, AOV expansion, and margin improvement
- Expand internationally with disciplined market selection, localization strategy, and operational readiness
- Invest in retention because improving repeat purchase rates delivers superior ROI to lowering CAC
- Use technology for automation, targeting efficiency, and personalization, but only when scale justifies it
E-commerce growth is a marathon, not a sprint. The brands that build for 5-year profitability and cash flow outperform those optimizing for quarterly revenue targets every time.
Ready to build a sustainable e-commerce growth model? Start with understanding your unit economics for ecommerce to identify profitability drivers, then develop your traffic acquisition strategy and repeat purchase strategy to optimize your growth engines.
Frequently Asked Questions
What is an ecommerce growth model? It's the operational and financial logic that determines how your business acquires customers, generates revenue, and expands while keeping unit economics profitable. It's not a revenue target or a marketing plan. A good model accounts for the different economics of new versus repeat customers and each sales channel.
What are the three engines of ecommerce growth? Existing customer expansion (usually 30-50% of growth and the most profitable), new customer acquisition (40-60% but the most expensive), and market expansion into new channels, geographies, or categories (10-20% and the riskiest). Healthy brands invest across all three rather than relying on paid acquisition alone.
What is a good CLV to CAC ratio for ecommerce? Sustainable ecommerce needs a customer lifetime value to acquisition cost ratio of at least 3:1, with best-in-class brands hitting 5:1 or better. Anything below 2:1 means you are burning cash to grow. Use gross profit, not revenue, when calculating lifetime value.
Should I sell on a marketplace or direct-to-consumer? Marketplaces give instant traffic but take 10-20% in fees and limit customer data. Direct-to-consumer offers 30-50% contribution margins and full data ownership but requires building traffic from scratch. Most successful brands run both: marketplaces for acquisition, DTC for margin and retention.
Learn More
Explore these related guides to deepen your e-commerce growth expertise:
- Unit Economics for E-commerce - Master the financial fundamentals of profitable scaling
- Customer Lifetime Value - Calculate and optimize the most critical metric
- E-commerce Metrics & KPIs - Track the numbers that matter for growth
- Traffic Acquisition Strategy - Build efficient customer acquisition engines
- Conversion Rate Optimization - Turn more visitors into customers
- Repeat Purchase Strategy - Maximize customer lifetime value through retention
- Amazon FBA Strategy - Scale through marketplace channels
- Subscription Model Design - Create predictable recurring revenue

Senior Operations & Growth Strategist
On this page
- What is an E-commerce Growth Model?
- The Foundation: Unit Economics You Can't Ignore
- Customer Acquisition Cost (CAC)
- Customer Lifetime Value (CLV)
- Payback Period
- Contribution Margin by Channel
- The Three Growth Engines: Where Revenue Actually Comes From
- Growth Engine #1: Existing Customer Expansion (30-50% of Growth)
- Growth Engine #2: New Customer Acquisition (40-60% of Growth)
- Growth Engine #3: Market Expansion (10-20% of Growth)
- Marketplace vs Direct-to-Consumer: The Model That Changes Everything
- Marketplace Model Economics
- Direct-to-Consumer Model Economics
- Channel-Specific Growth Models: Not All Traffic Sources Are Equal
- Organic Search and SEO Growth Trajectory
- Paid Advertising Scaling Patterns and Diminishing Returns
- Social Commerce and Influencer Partnerships
- Subscription and Recurring Revenue Models
- Product Mix Strategies: Growing Through Assortment Optimization
- Horizontal Expansion: Categories and SKUs
- Vertical Penetration: Price Tiers and Segments
- Bundle and Cross-Sell Optimization
- International Growth Framework: Expanding Beyond Domestic Markets
- Market Selection Criteria and Sequencing
- Localization vs Standardization
- Currency and Payment Complexity
- Retention and Loyalty Economics: The Growth Multiplier
- Repeat Purchase Rate Impact on Growth
- Cohort Analysis and Churn Patterns
- Personalization ROI Thresholds
- Technology: How Systems Drive Margin Expansion
- Automation for Margin Expansion
- Data Analytics for Targeting Efficiency
- Personalization Engines and Conversion
- The Bottom Line: Growth Models That Create Value vs Destroy It
- Frequently Asked Questions
- Learn More