Fulfillment Strategy: In-House vs 3PL Models for E-commerce Profitability
Turn this article into takeaways for your work.
Each assistant summarizes the article only for you and suggests best practices for your work.
Your fulfillment operation is both a massive cost center and a hidden profit driver. Get it wrong, and you're burning 20-30% of revenue on logistics while customers still complain about slow shipping. Get it right, and you've built a competitive moat that compounds margin improvement with customer satisfaction.
The decision between in-house fulfillment, third-party logistics (3PL), or hybrid models isn't just operational. It shapes your unit economics, capital requirements, and scalability. A $2M/year brand might thrive with in-house fulfillment, while a $10M brand using the same model could be bleeding cash on inefficiency.
This guide breaks down fulfillment economics, model selection criteria, and scaling strategies to help you build profitable operations that support growth rather than constrain it.
Fulfillment Economics Foundation
Before evaluating models, understand the actual cost structure. Fulfillment costs typically break down into five components: Labor costs (30-45% of total): Receiving, picking, packing, quality control, returns processing. In-house operations pay $15-25/hour plus benefits. 3PLs bundle this into per-order fees but achieve efficiency through scale.
Warehousing costs (20-30%): Storage rent, utilities, insurance, equipment. Measured in cost per square foot per month or storage fees per cubic foot. Varies wildly by location, $8/sq ft in rural areas, $25/sq ft in urban markets.
Packaging materials (10-15%): Boxes, mailers, void fill, tape, labels, branded inserts. Bulk purchasing reduces costs significantly. A small operation might pay $1.50 per package, while high-volume operations achieve $0.40-0.60.
Shipping costs (25-35%): Carrier rates, dimensional weight charges, fuel surcharges, zone-based pricing. Volume discounts create massive gaps, small shippers pay 2-3x what large operations pay for identical shipments.
Returns processing (5-10%): Reverse logistics, inspection, restocking, disposal. Often overlooked but critical for categories with high return rates (apparel averages 20-30% returns).
Unit economics by model create stark differences:
In-house fulfillment at 1,000 orders/month might cost $8-12 per order all-in. The same volume through a 3PL runs $6-9 per order. But at 10,000 orders/month, optimized in-house operations hit $4-6 per order, while 3PLs maintain $5-8.
The crossover point typically falls around 2,500-5,000 orders per month, depending on product characteristics. Lightweight, simple products favor 3PLs longer. Heavy, fragile, or customized products justify in-house operations sooner.
Hidden costs destroy profitability if ignored.
Inventory errors create stockouts (lost sales) or overstock (carrying costs, markdowns). In-house operations average 97-99% accuracy with proper systems. Poorly managed 3PLs run 92-95%, which sounds acceptable until you calculate the revenue impact of phantom inventory.
Damage rates compound shipping costs. Products damaged in fulfillment generate customer service costs, replacement shipments, and brand damage. In-house operations provide more control but require investment in proper training and processes.
Lost shipments create the worst customer experience. The customer doesn't receive the product AND you've absorbed all fulfillment costs. Carrier partnerships and tracking systems reduce this, but model choice affects your leverage with carriers.
Understanding these economics frames every subsequent decision about model selection and optimization.
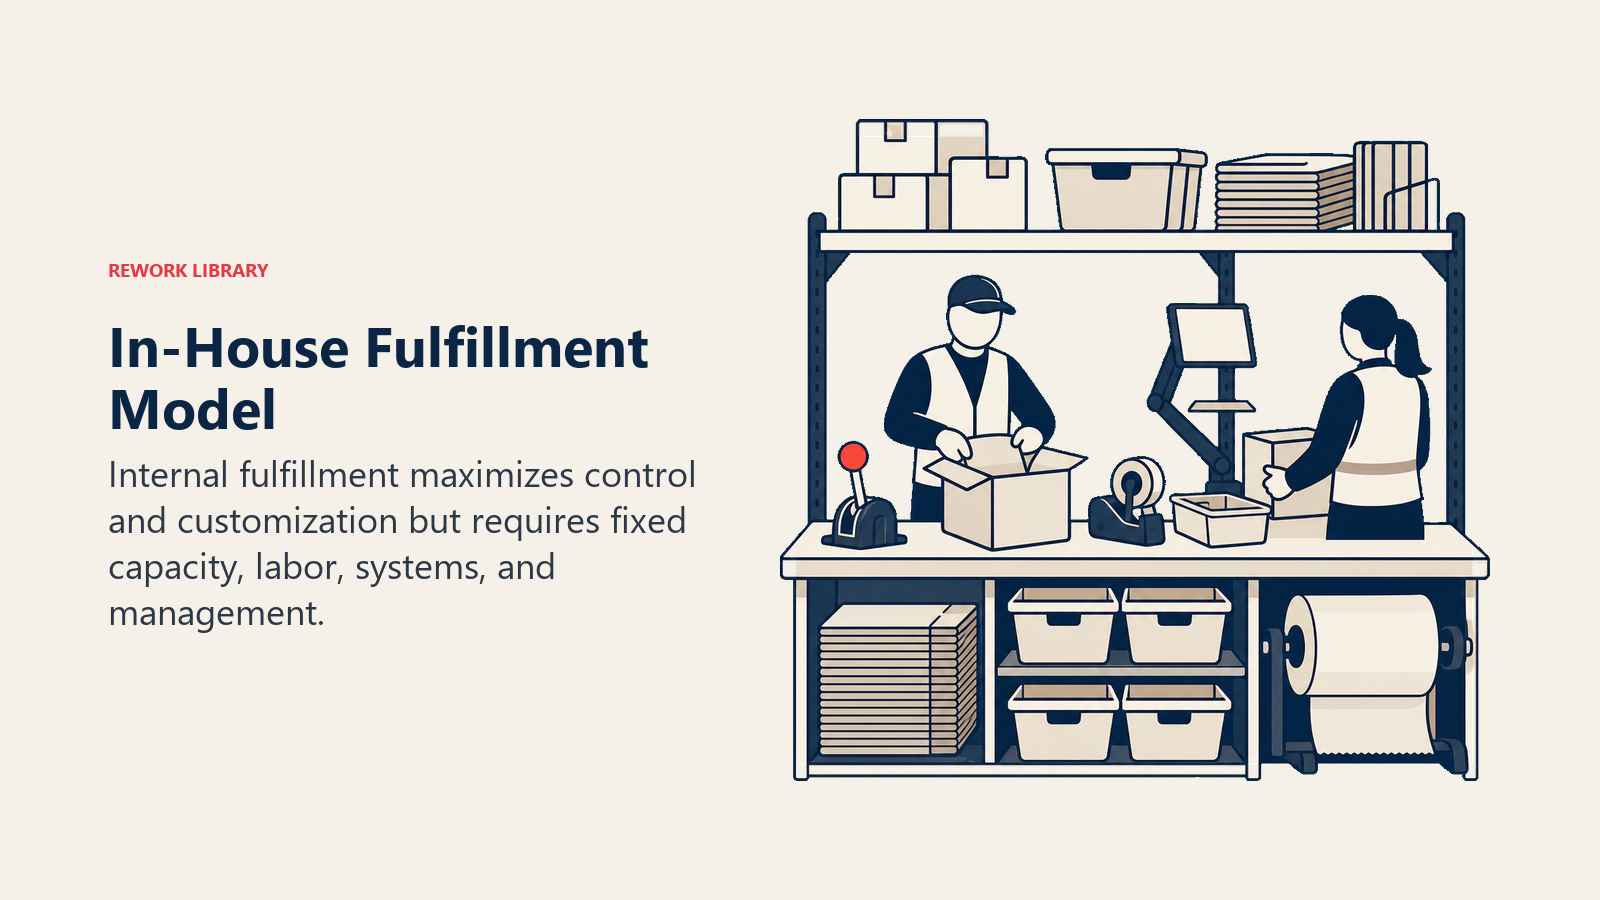
In-House Fulfillment Model
Running your own warehouse provides maximum control at the cost of capital intensity and operational complexity. Advantages that justify the investment. Complete control over quality, speed, and customer experience. You determine packing standards, inspection protocols, and special handling. This matters for brands where unboxing experience drives retention or products requiring careful handling. Speed and flexibility for customization. Same-day processing becomes possible. Gift wrapping, personalized notes, sample inclusion, or custom kitting happens without negotiating 3PL fees or minimums. Your operation adapts to promotional needs in hours, not weeks.
Direct customer touchpoint. Your team handles the last physical interaction before product delivery. This creates feedback loops for product quality, packaging issues, and customer preferences that 3PLs can't provide.
Cost efficiency at scale. Beyond 5,000-10,000 orders per month, well-run in-house operations typically beat 3PL pricing. The gap widens with volume and product complexity.
Data ownership and integration. Your systems, your data, your analytics. No waiting for 3PL reports or working around their technology limitations. Critical for brands building sophisticated inventory management or customer experience strategies.
Disadvantages that sink underprepared brands.
Massive upfront capital. Lease deposits, racking, packing stations, equipment, technology systems. Budget $50K-150K minimum for even a modest operation. Then add working capital for increased inventory (you're now paying for storage in advance).
Fixed cost structure creates risk. Lease commitments, equipment payments, and base staffing costs continue whether you ship 100 or 10,000 orders per month. Seasonal businesses face brutal efficiency swings.
Operational complexity compounds quickly. You're now managing real estate, equipment, inventory, labor, carrier relationships, returns, and technology. Each area requires expertise or expensive mistakes.
Scaling challenges hit hard. Doubling volume doesn't simply require twice the space, you need better systems, management layers, and process optimization. Many brands hit a wall at 15,000-20,000 orders per month without significant investment.
Geographic limitations. Single warehouse locations create shipping cost disadvantages for customers far from your facility. Expanding to multiple locations multiplies all the complexity above.
When in-house makes sense:
Your unit economics support the fixed cost structure. Run scenarios assuming 50% volume drops, can you still cover base costs?
Product characteristics demand control. Fragile goods, customization requirements, strict quality standards, or products requiring special handling justify the investment.
Volume consistently exceeds 5,000 orders per month with predictable growth trajectory. Seasonal spikes are manageable with temporary labor. Sustained low volume creates disaster.
Capital is available and opportunity cost is acceptable. That $100K invested in fulfillment infrastructure isn't going to product development, marketing, or inventory expansion.
You have operational expertise or can hire it. Running a warehouse isn't intuitive. Underestimating this requirement creates expensive chaos.
For many growing brands, in-house fulfillment works brilliantly from months 18-36, then becomes a constraint that requires either massive investment or strategic shift to hybrid models.
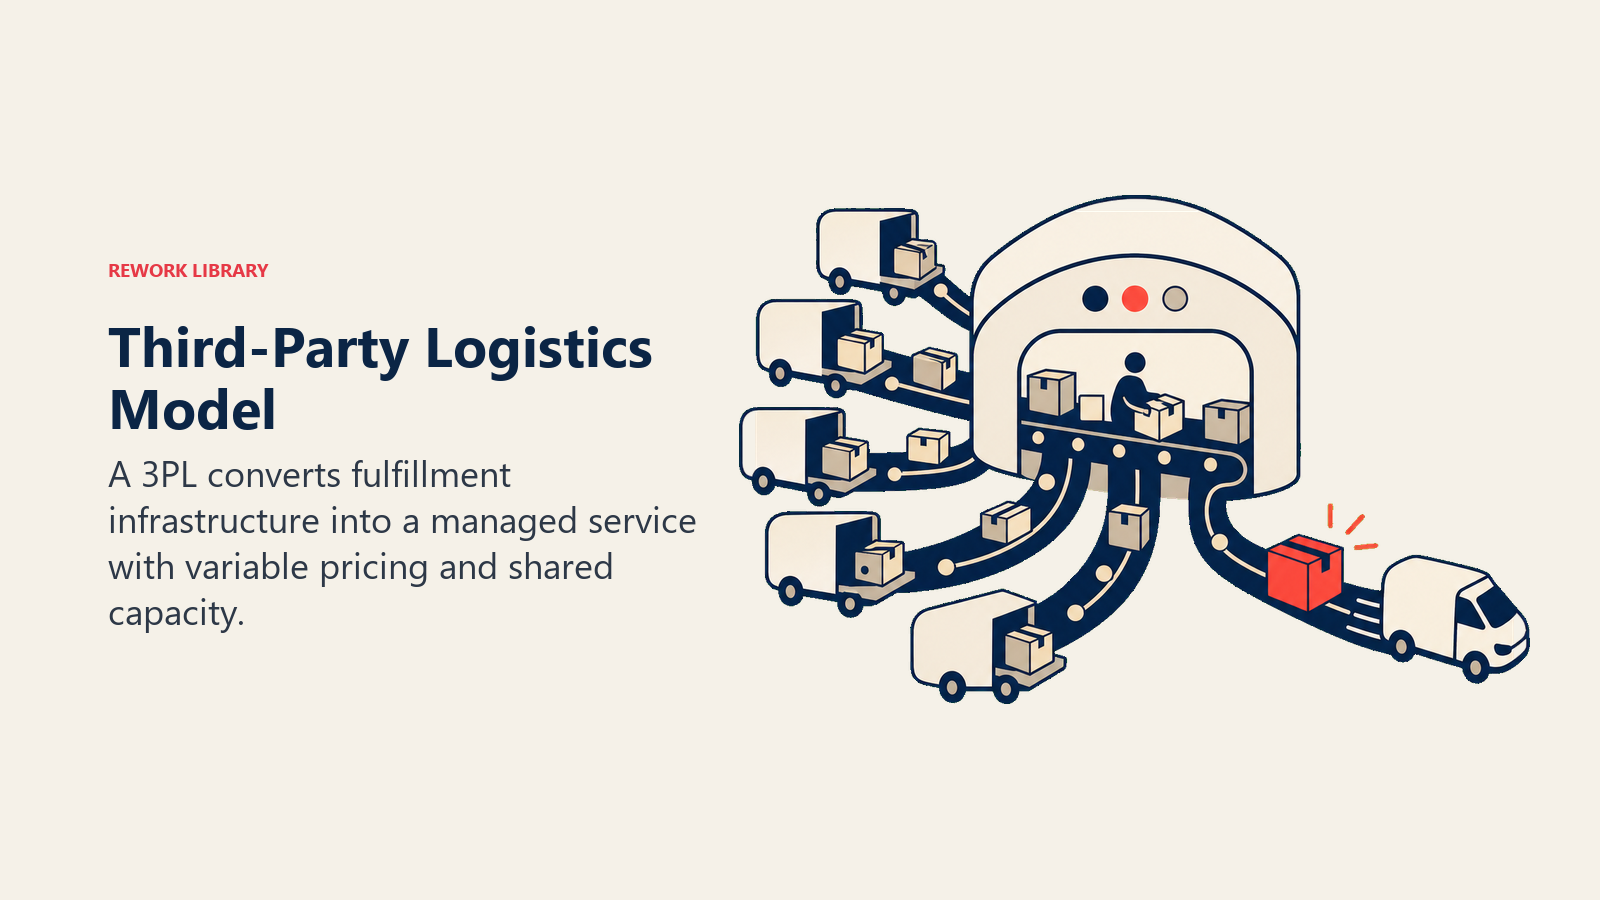
Third-Party Logistics (3PL) Model
Outsourcing fulfillment to specialized providers trades control for flexibility and transfers operational risk. Advantages that make 3PLs attractive: Variable cost structure aligns with revenue. Pay per order, per unit stored, and per service used. Revenue drops? Costs drop proportionally. No lease obligations or equipment payments. Instant scalability without capital. Need to handle 100 orders this month and 10,000 next month? The 3PL adjusts staffing and space. You're not scrambling to hire, train, and manage seasonal labor.
Geographic distribution becomes accessible. Quality 3PLs operate multiple warehouses nationwide. Distribute inventory strategically to reduce shipping times and costs without managing multiple facilities yourself.
Professional operations and technology. Established 3PLs have invested millions in warehouse management systems, automation, carrier relationships, and process optimization. You benefit without the investment.
Focus preservation. Your team concentrates on product, marketing, and customer experience rather than warehouse operations. Particularly valuable for early-stage brands with limited resources.
Disadvantages that create problems:
Less control over quality and speed. You're dependent on their standards, training, and priorities. Peak season might mean your orders wait while bigger clients get processed first.
Margin compression at scale. 3PL pricing that works beautifully at $2M in revenue becomes a profit drag at $10M. Per-order fees that seemed reasonable at 2,000 units monthly become significant line items at 20,000.
Technology integration challenges. Many 3PLs run on legacy systems with limited real-time visibility. API integrations exist but might not provide the data granularity you need for sophisticated operations.
Limited customization options. Gift wrapping, custom inserts, or special kitting incur premium charges and minimum volumes. Your ability to create unique customer experiences faces constraints.
Partner dependency creates risk. Changing 3PLs is operationally disruptive, transferring inventory, integrating new systems, retraining teams. This limits negotiating leverage and creates switching costs.
Cost models vary significantly:
Storage fees: $0.40-0.85 per cubic foot per month for standard storage. Pallet storage runs $10-20 per pallet monthly. Watch for additional fees during peak season (November-December often includes surcharges).
Receiving fees: $0.30-0.50 per unit received, plus $35-75 per pallet or shipment. Frequent small shipments cost more per unit than consolidated receipts.
Pick and pack fees: $2.50-4.50 per order for standard items. Additional charges for multi-item orders ($0.30-0.75 per additional item), oversized products, or special handling.
Shipping: Either pass-through at their negotiated rates (typically better than your rates, worse than in-house at scale) or marked up 5-15%. Negotiate transparency here.
Returns processing: $2.50-4.50 per return, plus restocking fees if units go back to inventory. Disposal fees for damaged goods. This adds up fast in high-return categories.
Partner selection determines success:
Evaluate their client mix. 3PLs serving brands similar in size and category to yours perform better than those stretching to serve you. A 3PL focused on large enterprise clients treats 2,000 orders monthly as a rounding error.
Technology capabilities matter enormously. Real-time inventory visibility, API integrations, reporting quality, and system uptime separate professional operations from mediocre ones. Request trial access before committing.
Geographic footprint should match your customer base. Check where they store inventory and whether their locations optimize shipping costs for your primary markets.
Service level agreements (SLAs) protect your customer experience. Guarantee same-day processing for orders received by cutoff times. Set accuracy requirements (98%+). Define response times for issues. SLAs without penalties are suggestions.
References reveal reality. Talk to 3-5 current clients similar to your profile. Ask about accuracy, responsiveness, technology integration, and how they handle problems.
For a comprehensive evaluation framework, see our guide on 3PL partner selection.
Starting with a 3PL makes sense for most brands under $3M in revenue, but build switching costs into your financial models. The best operators plan their eventual transition while maximizing 3PL benefits during high-growth phases.
Hybrid Fulfillment Models
Combining in-house and outsourced fulfillment creates flexibility but multiplies complexity. Common hybrid strategies:
Product-based split: Fulfill standard products through 3PLs, keep custom or high-touch items in-house. Works well when product lines have distinct handling requirements or margin profiles.
Geography-based split: In-house warehouse serves your core market (typically 40-60% of orders), 3PL locations handle outlying regions. Optimizes shipping costs while maintaining control over primary customer base.
Channel-based split: Direct-to-consumer orders fulfilled in-house for maximum control and brand experience. Wholesale or marketplace orders through 3PLs for efficiency at scale. Aligns operational model with customer value.
Volume-based flex: In-house operation handles base load, 3PL provides overflow capacity during peak seasons. Maintains cost efficiency during normal periods while avoiding capital investment for peak capacity.
Distributed fulfillment across multiple in-house or 3PL locations:
Splitting inventory across East and West Coast facilities reduces average shipping distance from 2,200 miles to 1,100 miles. For a brand shipping 50,000 packages yearly, this typically saves $35K-60K in shipping costs while improving delivery speeds.
The trade-off comes in inventory allocation complexity. You're now managing stock levels across multiple locations, dealing with stockouts at one facility while another has excess, and coordinating transfers between locations.
Brands typically benefit from distributed fulfillment around $5M in annual revenue when shipping costs and speed advantages outweigh inventory management complexity.
Marketplace fulfillment alongside direct channels:
Many brands operate FBA for Amazon sales while maintaining separate fulfillment for Shopify/direct sales. This maximizes Amazon visibility through Prime eligibility while preserving control and margins on direct sales.
The complexity hits inventory planning, you're splitting SKUs across fulfillment networks with different lead times, storage costs, and economics. Strong inventory management systems become critical.
Evaluate whether Amazon represents 30%+ of revenue. Below that threshold, the operational complexity of split fulfillment often exceeds the benefits. Above it, the dedicated approach typically improves overall profitability.
For detailed strategies on leveraging Amazon's fulfillment network, see Amazon FBA Strategy.
Managing complexity in hybrid models:
Centralized inventory visibility across all fulfillment points becomes non-negotiable. Customers don't care that inventory exists, they care whether it's available for their location. Your systems must route orders to optimal fulfillment points automatically.
Clear routing logic prevents chaos: Define rules for order assignment based on product type, destination, inventory levels, and shipping method. Document and test these rules thoroughly.
Unified reporting consolidates performance metrics across fulfillment operations. Track accuracy, speed, cost per order, and customer satisfaction by channel but also in aggregate.
The best hybrid strategies start simple (one in-house, one 3PL) and add complexity only when financial analysis clearly justifies it. Each additional fulfillment point increases operational overhead by roughly 15-20%.
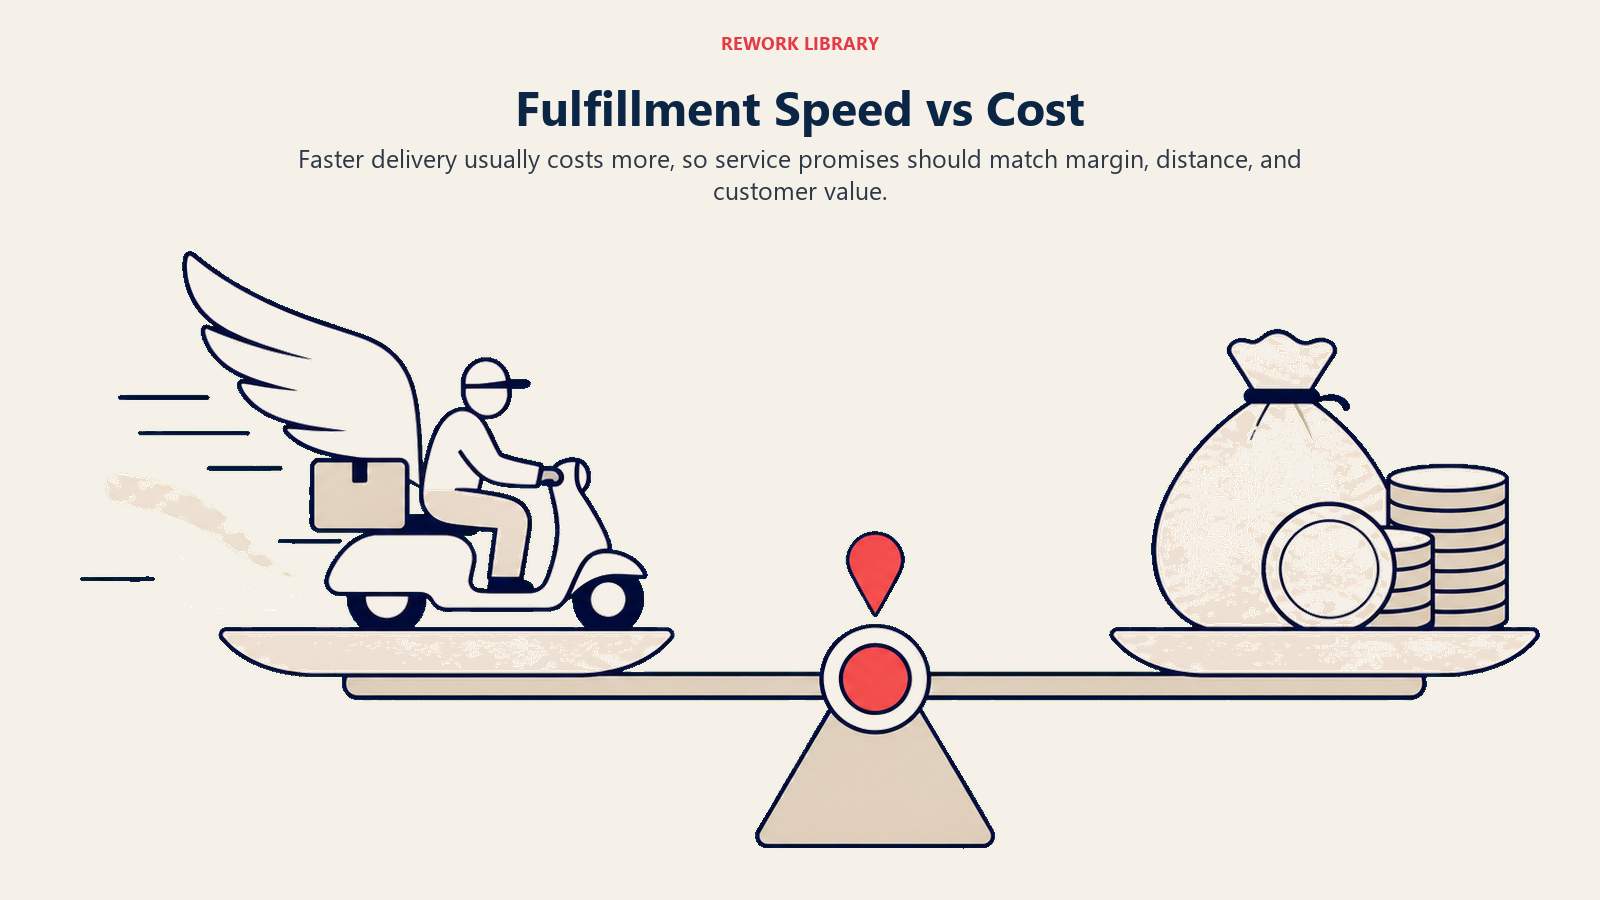
Speed vs Cost Trade-Offs
Shipping speed has become a competitive battleground, but faster fulfillment directly impacts profitability. Delivery speed economics create clear trade-offs: Standard shipping (5-7 business days) costs the base rate. This is your starting point for comparison. 2-day shipping typically costs 40-60% more per package. For a $10 base shipping cost, 2-day runs $14-16. Across 50,000 annual shipments, this adds $200K-300K to fulfillment costs.
Next-day shipping costs 2-3x standard rates. That $10 package becomes $20-30. Few brands can absorb this cost without passing it to customers or destroying margins.
Customer willingness to pay varies by category and price point:
Low-AOV purchases (under $30): Customers rarely pay extra for speed. Free shipping matters more than fast shipping. Premium speed options see 2-5% take rates.
Mid-AOV purchases ($30-150): Speed becomes a meaningful differentiator. Customers will pay $5-10 for 2-day delivery on purchases they care about. Take rates hit 10-20% when priced reasonably.
High-AOV purchases (over $150): Fast shipping is expected, often provided free. Customers purchasing expensive items assign high implicit value to quick delivery. Not offering it creates competitive disadvantage.
Speed as competitive advantage works in specific contexts:
Perishable or time-sensitive products (flowers, groceries, gifts) make speed the primary purchase driver. Customers will pay premiums, and competitors face structural disadvantages without fast fulfillment.
High-frequency replenishment items (supplements, pet food, personal care) benefit from predictable fast delivery. This creates habitual ordering behavior and reduces churn.
Last-minute purchases reward speed. Gift items near holidays, replacement products, or event-related purchases carry urgency that justifies premium fulfillment costs.
Geographic distribution requirements determine achievable speeds:
Single-warehouse brands reach 50-60% of US customers in 2 days via ground shipping, 85-90% in 3 days. Remaining customers require air service for 2-day delivery.
Two-warehouse operations (East and West Coast) achieve 2-day ground delivery to 80-85% of customers, 3-day to 95%+. This becomes the sweet spot for many brands.
Three+ warehouses push 2-day ground coverage to 90-95% but multiply operational complexity. Justifiable only for brands doing $15M+ with strong operational foundations.
Optimizing the speed/cost balance:
Offer tiered shipping options rather than free fast shipping. Let customers reveal their preferences. Price tiers to recover actual cost differences, don't subsidize speed for all customers.
Use geographic routing to maximize ground shipping. When customers in California order from your LA warehouse and East Coast customers from your NJ facility, both receive 2-day delivery at ground shipping costs.
Communicate realistic expectations. Customers tolerate 5-7 day delivery when you're transparent. They hate 3-5 day promises that take 7 days. Underpromise, overdeliver.
Consider shipping strategy and pricing decisions in context of overall customer acquisition costs and customer lifetime value. Sometimes subsidizing fast shipping improves retention enough to justify the cost.
The brands winning on fulfillment speed without destroying margins have built geographic distribution, negotiated volume carrier discounts, and set customer expectations aligned with their operational capabilities.
Inventory Placement & Warehouse Strategy
Where you store inventory determines shipping costs, delivery speeds, and capital efficiency.
Centralized vs distributed inventory:
Single-location centralized inventory minimizes operational complexity. One lease, one team, one set of systems. Inventory management stays simple, no stock splits, transfers, or coordination across facilities.
The downside shows up in shipping costs and speed. Average shipping distance increases, pushing more shipments into higher-cost zones. A centralized warehouse in Kansas serves the geographic center well but creates 4-5 day ground transit to coasts.
For brands under $3M in revenue shipping under 5,000 packages monthly, centralized inventory almost always wins. The operational complexity and inventory carrying costs of distribution exceed the shipping savings.
Regional warehouse decisions depend on customer concentration:
Analyze your order density by state/region. If 60% of orders come from California, Texas, New York, and Florida, two warehouses (West and East) serve most customers efficiently.
Calculate the shipping cost delta. Run reports on current shipping costs by zone. Model how costs would change with inventory split East/West. Factor in increased inventory carrying costs (you need more safety stock across locations).
The break-even typically hits around $5M-7M in revenue when shipping cost savings exceed the carrying cost of split inventory. Earlier for heavy/bulky products with high shipping costs. Later for lightweight items with minimal zone-based shipping variance.
Safety stock multiplication hurts distributed models:
Centralized inventory with $100K in stock might need 15% safety stock ($15K) to maintain 98% in-stock rates.
Split that same demand across two locations, and each needs safety stock calculated on its demand variance. You often end up carrying $20K-25K in total safety stock for the same service level.
This inventory carrying cost (typically 20-30% annually) must be less than shipping cost savings for distribution to make financial sense.
Dropshipping trade-offs offer another alternative:
Direct manufacturer/supplier shipping eliminates your warehousing and fulfillment costs entirely. Margins might be 5-10 points lower, but you've eliminated massive operational complexity and capital requirements.
The catches: Zero control over fulfillment quality or speed. Limited branding opportunities. Inventory visibility depends on supplier systems. Returns management becomes complicated.
Works best for: Wide product assortments where carrying all inventory is capital-prohibitive. Low-volume SKUs that don't justify warehouse space. Testing new products before committing to inventory.
Avoid for: Core products where customer experience is critical. Items with high return rates requiring inspection. Products where fulfillment speed drives competitive advantage.
For a detailed analysis of dropshipping economics and supplier management, see our guide on the dropshipping model.
Warehouse location selection criteria:
Labor availability and cost: Rural areas offer cheaper labor but limited hiring pools. Urban areas provide abundant workers but higher wages and rent.
Proximity to major carrier hubs: Facilities near UPS/FedEx hubs get later cutoff times and faster initial transit. Sometimes this matters more than customer proximity.
Rent and operating costs: Varies 3-5x across markets. Industrial space in Memphis or Indianapolis runs $5-8/sq ft annually. Los Angeles or New Jersey costs $15-25/sq ft.
Regulatory environment: Some states impose sales tax collection requirements or other compliance costs when you establish physical presence. Factor this into location analysis. For brands considering expansion beyond domestic markets, review international shipping considerations as well.
The optimal strategy evolves with your business. Start centralized, add strategic distribution when shipping costs clearly justify it, and continuously model whether your current approach still makes sense as volume and geography shift.
Packaging, Labeling & Branding
Packaging decisions create a three-way trade-off between cost, protection, and brand experience.
Cost vs perceived value optimization:
Generic corrugated boxes cost $0.40-0.70 depending on size. Custom printed boxes run $0.90-2.50. That $1.50 difference across 50,000 annual shipments is $75K, enough to fund significant marketing initiatives.
The question becomes whether branded unboxing drives measurable retention or word-of-mouth. For commodity products in competitive categories, probably not. For premium brands where unboxing videos drive social proof, absolutely.
Test this systematically: Run cohorts with generic vs branded packaging and measure repeat purchase rates. The data often surprises, branded packaging sometimes shows no statistically significant impact on retention.
Protective packaging requirements vary by product:
Fragile items need proper void fill, corner protection, and potentially double-boxing. Damage rates above 2-3% destroy profitability through replacement costs, return shipping, and customer service time.
Right-size packaging reduces dimensional weight charges. A small item in an oversized box might get charged for 10 lbs when actual weight is 1 lb. This single mistake can double shipping costs.
Packaging optimization often saves more money than supplier negotiations. Conduct a packaging audit, measure actual damage rates by packaging type, calculate dimensional weight impacts, and optimize the entire system.
Branded unboxing experience components:
Custom boxes signal quality before opening. Tissue paper, branded tape, and thank-you cards create moments worth photographing. Samples or promotional inserts drive next purchase.
Calculate cost per element. Tissue paper: $0.08-0.15. Branded stickers: $0.05-0.12. Thank you cards: $0.10-0.25. Sample products: $0.50-2.00. A "premium" unboxing might add $0.75-2.50 per order.
For a brand doing $5M in revenue at $75 AOV (roughly 66,000 orders), adding $1.50 to packaging costs $100K annually. That better drive tangible retention lift or justify itself through brand-building.
The brands getting this right target premium unboxing at high-value customers (first-time buyers, high-AOV orders, subscription customers) while using efficient packaging for repeat buyers who've already experienced the brand.
Sustainability considerations increasingly matter:
Recyclable, minimal packaging appeals to conscious consumers and reduces material costs. Excessive packaging creates negative brand perception and actual disposal problems.
Right-sized boxes reduce waste, lower shipping costs via dimensional weight savings, and improve environmental impact. This is the rare win-win-win.
Compostable mailers and packaging materials cost 20-40% more but provide marketing value in certain categories. Calculate whether your customer base assigns enough value to justify the premium.
Returns packaging integration:
Include return labels and instructions with initial shipments when return rates exceed 10% (common in apparel, footwear, accessories). This reduces customer service contacts and streamlines returns.
Pre-packaged return mailers work well for high-return categories. Customer satisfaction with the return process directly impacts whether they'll purchase again.
Some brands include resealable bags or reusable boxes that facilitate returns while also improving unboxing experience. Costs are higher but operational efficiency often improves.
The optimal packaging strategy aligns with your product, price point, and customer expectations. Test, measure, and optimize rather than assuming more expensive equals better.
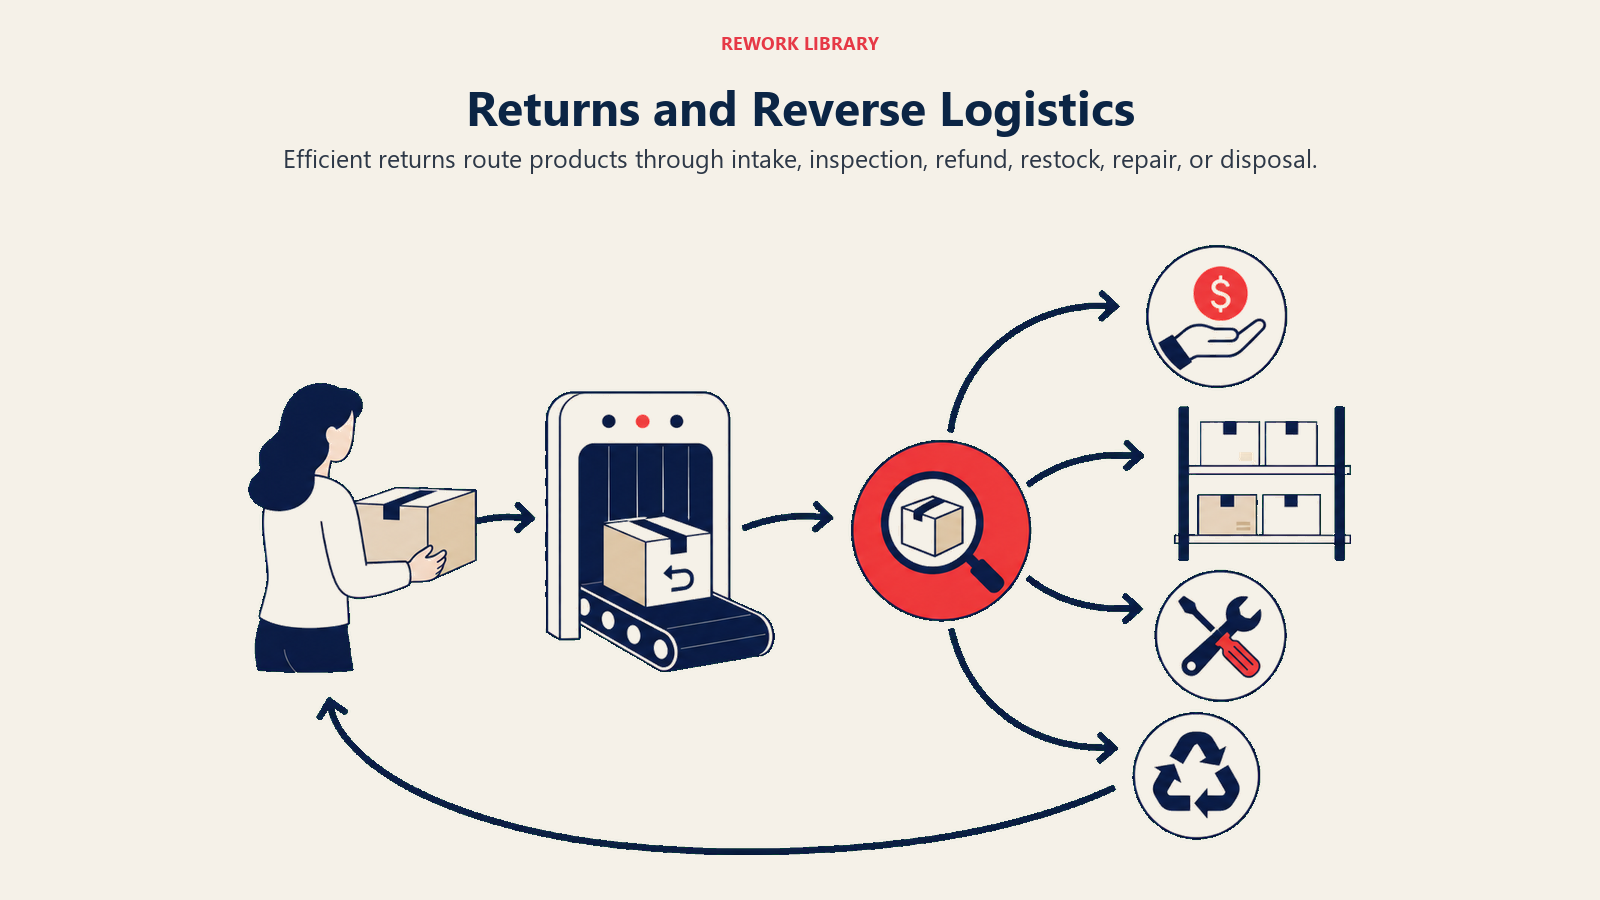
Returns Management & Reverse Logistics
Returns represent the most expensive fulfillment operations while creating critical customer experience touchpoints. Return rates by category set baseline expectations: Apparel and accessories: 20-30% return rates are normal. Online-only apparel brands often hit 35-40% as customers order multiple sizes/colors. Electronics and tech: 5-15% returns, often driven by defects or customer confusion rather than sizing issues.
Home goods and furniture: 8-15% returns, heavily weighted toward damage-in-transit and doesn't-fit-space issues.
Beauty and personal care: 5-10% returns, lower due to hygiene concerns limiting returnability.
Understanding your category baseline helps set realistic targets and budget accordingly. A 25% return rate isn't a crisis if you're in apparel, it's table stakes.
In-house vs 3PL returns handling:
In-house returns processing provides quality control. Your team inspects items, makes restocking decisions, and identifies product quality issues. This feedback loop drives product improvements.
Cost runs $2.50-4.00 per return for receiving, inspection, and restocking. Add disposal costs for damaged items and customer service time for return processing.
3PL returns processing costs similar amounts ($2.50-4.50 per return) but often lacks the quality feedback loop. Returns get processed, but learning opportunities get lost.
The hybrid approach: 3PL handles standard returns processing while flagging exceptions to you. Damaged items, quality concerns, or unusual return reasons trigger review by your team.
Reverse logistics cost structure:
Return shipping: Customer-paid returns transfer costs to customers but reduce satisfaction and repurchase intent. Free return shipping costs you $5-12 per return depending on distance and carrier.
Inspection and processing: Labor costs for receiving, inspecting, making decisions (restock, refurbish, dispose), and updating inventory.
Restocking costs: Even items that go back to inventory incur handling fees with 3PLs ($0.50-1.50 per unit). In-house operations face labor costs.
Disposal or liquidation: Items that can't be restocked get donated, recycled, or sent to liquidators. Liquidation typically recovers 5-15% of COGS. Disposal costs money.
Customer service time: Processing return requests, generating labels, handling exceptions, and managing customer communication represents hidden costs often overlooked.
Reducing return rates improves profitability more than optimizing return processing:
Better product descriptions, sizing information, and imagery reduce apparel returns by 5-10 percentage points. Invest in content quality.
Virtual try-on tools and size recommendation engines cut return rates. Technology investment pays off quickly at scale, a brand doing $10M in apparel with 30% returns saves roughly $150K-250K for each 5-point reduction in return rate.
Product quality improvements reduce defect-driven returns. Monitor return reasons systematically. If "doesn't match photos" or "quality below expectations" shows up frequently, you have a product problem, not a returns problem.
Post-purchase engagement reduces buyer's remorse returns. Email sequences with styling tips, usage ideas, or complementary product suggestions can reduce return likelihood.
Return fraud prevention becomes necessary at scale:
Serial returners who abuse policies need identification and management. Track return rates by customer. Anyone above 40-50% return rate deserves scrutiny.
Bracketing (ordering multiple sizes/colors intending to return most) is common in apparel. Some brands limit maximum order quantities or flag accounts with suspicious patterns.
Wardrobing (wearing items then returning) requires inspection protocols. Train teams to check for wear, odor, tag removal, and other signs of use.
Return policy abuse (claiming items as damaged when they aren't) requires evidence collection. Photos, inspection notes, and pattern tracking protect you while maintaining customer service.
The key is balancing fraud prevention with customer experience. Overly restrictive policies hurt legitimate customers and reduce repurchase intent.
For brands where returns represent a significant portion of operations, investing in specialized reverse logistics solutions and systematic return rate reduction pays enormous dividends. A 5-point reduction in return rate for a $10M apparel brand typically adds $200K-350K to bottom line.
For comprehensive strategies on optimizing your reverse logistics operation, see our dedicated guide on returns management.
Technology Integration for Fulfillment
Fulfillment technology determines whether you're operating efficiently or fighting fires daily.
Order Management Systems (OMS) serve as the central nervous system:
An OMS receives orders from all sales channels (Shopify, Amazon, eBay, wholesale), consolidates them, routes to appropriate fulfillment locations, and tracks through delivery.
Without an OMS, you're manually downloading orders from each channel, uploading to fulfillment systems, and reconciling inventory across platforms. This breaks down around 50-100 orders daily.
Quality OMS platforms (ShipStation, ShipBob, Ordoro, or enterprise solutions like NetSuite) cost $100-500 monthly for small operations, $500-2,000+ at scale. The ROI becomes positive almost immediately through labor savings and error reduction.
Real-time inventory visibility prevents stockouts and overselling:
Your e-commerce platform, OMS, and fulfillment system must sync inventory constantly. A customer shouldn't be able to purchase an item that just shipped to another customer.
Multi-channel operations require inventory allocation rules. If you have 10 units and sell on Shopify, Amazon, and wholesale, how do you allocate? FIFO (first-in-first-out)? Channel priority? Manual allocation?
Inventory sync frequency matters, real-time is ideal, but 15-minute intervals often suffice. Hourly syncs create overselling problems during peak periods.
Automated picking and packing systems improve efficiency:
Barcode scanning eliminates picking errors. Pickers scan item barcodes and order barcodes to verify accuracy. Error rates drop from 5-8% to under 1%.
Batch picking for multiple orders improves efficiency. Pick all units needed for 20 orders in one pass through the warehouse rather than completing orders sequentially.
Automated packing stations suggest optimal box sizes, print shipping labels automatically, and validate weights. This reduces dimensional weight charges and speeds throughput.
The investment threshold: Manual operations work until roughly 100-150 orders daily. Beyond that, automation starts paying for itself through labor efficiency and error reduction.
Barcode and RFID technology:
Basic barcode systems cost $2K-5K for scanners, printers, and software. Implementation takes 2-4 weeks. ROI typically hits within 6-12 months through error reduction.
RFID (Radio Frequency Identification) enables scanning multiple items simultaneously without line-of-sight. Powerful for high-volume operations but costs 10-20x more than barcodes. Justifiable above 10,000 units shipped daily.
Analytics and reporting dashboards:
Track operational metrics: Orders processed per labor hour, error rates, average time from order to ship, picking accuracy, packing efficiency.
Monitor financial metrics: Cost per order, cost per unit shipped, labor cost as percentage of revenue, shipping cost per order.
Identify trends: Weekly/monthly order volumes, seasonal patterns, SKU velocity, slow-moving inventory, return rates by product.
The best fulfillment operations review dashboards daily (operational metrics) and weekly (financial/trend analysis). Data-driven optimization compounds over time.
For a complete framework on which metrics to track and how to act on them, see our guide on e-commerce metrics and KPIs.
Integration requirements when selecting systems:
Your e-commerce platform must integrate seamlessly with your OMS. Native integrations work better than third-party middleware.
Your OMS must integrate with your fulfillment system (whether your WMS for in-house or your 3PL's system). API quality matters enormously here.
Accounting integration closes the loop. Order data should flow to QuickBooks, Xero, or your ERP automatically for financial reporting.
Brands that nail technology integration operate with 2-3 full-time employees handling 10,000 orders monthly. Those with poor integration need 8-10 people for the same volume.
Scaling Fulfillment Operations
Growth creates different fulfillment challenges at each stage. What works at $1M breaks at $5M, and $5M systems constrain you at $15M.
Growth trajectory patterns:
$0-1M revenue (roughly 0-1,500 orders/month): Founder fulfillment or micro-3PL. Focus on customer experience and learning your operational requirements. Perfection isn't the goal, learning is.
$1M-3M revenue (1,500-5,000 orders/month): Professional 3PL or first in-house operation. This transition point determines your next 2-3 years. Choose based on product characteristics, capital availability, and operational capabilities.
$3M-10M revenue (5,000-15,000 orders/month): Optimize your model. If you're in-house, this means better systems, process documentation, and management layers. If you're using a 3PL, negotiate better rates and consider hybrid models.
$10M-25M revenue (15,000-40,000 orders/month): Most brands implement hybrid fulfillment or distributed operations. Single-location models create meaningful cost and speed disadvantages.
$25M+ revenue: Multi-location in-house operations or sophisticated 3PL partnerships with geographic distribution. Technology and process optimization become primary competitive advantages.
Capacity planning prevents disasters:
Calculate your fulfillment capacity in orders per day, then compare to peak demand. If you can process 500 orders daily but Black Friday generates 2,000, you have a problem.
Plan capacity at 60-70% utilization for normal periods. This provides buffer for demand spikes without constant overcapacity costs.
Seasonal businesses need different strategies: Temporary labor for in-house operations (hire in September for holiday season). 3PL partners with overflow capacity. Some brands literally run two different models, in-house base load, 3PL for November-December.
Adding locations strategically:
Your second location should serve a customer concentration that represents 25-35% of orders. Adding a facility for 10% of orders rarely justifies the complexity.
Location decisions balance rent costs, labor availability, proximity to customers, and carrier hub access. Run detailed financial models comparing options.
Inventory splits require sophisticated allocation logic. You need systems that automatically route orders to optimal fulfillment points and manage inter-facility transfers for stockouts.
Team structure evolution:
Solo operation → First warehouse employee (0-100 orders/day) Small team with lead (100-300 orders/day) Warehouse manager + team (300-800 orders/day) Operations manager overseeing warehouse manager + specialists (800-2,000 orders/day) Director of operations with multi-site management (2,000+ orders/day)
Hire ahead of breaking points. By the time you desperately need a warehouse manager, you're already in crisis mode. Add leadership when operations are working but showing strain.
Outsourcing vs building capabilities:
Outsource when: Capabilities are far from your core competency, capital requirements are prohibitive, or flexibility matters more than control.
Build when: Operations create competitive advantage, you have capital and expertise, or scale economics justify the investment.
The best operators ruthlessly evaluate this at each stage. Being "all in-house" or "all outsourced" is rarely optimal. Hybrid strategies aligned with your strengths typically win.
Common scaling mistakes:
Underinvesting in technology. Manual processes that work at 1,000 orders monthly create chaos at 5,000. Budget 2-3% of revenue for fulfillment technology.
Hiring too late. Warehouse managers need 3-6 months to learn your business and implement improvements. Hire before the pain becomes acute.
Ignoring process documentation. What works when the founder does everything breaks when you hire your fifth warehouse employee. Document processes early.
Optimizing the wrong metrics. Cost per order matters, but accuracy and customer experience matter more. Shaving $0.50 per order while driving 5% error rates destroys more value than it creates.
Knowing when to change models:
Monitor your cost per order trends. If in-house costs are increasing while volume grows, you have efficiency problems. If 3PL costs are rising faster than revenue, you're approaching transition points.
Watch quality metrics closely. Accuracy below 98%, damage rates above 3%, or fulfillment speed deteriorating signal your current model is breaking.
Consider switching when financial models show clear advantages. Don't change models to save 5-10%. Change when you can save 25%+ or unlock meaningful capabilities.
The brands that scale fulfillment successfully plan transitions 6-12 months before they're critical. By the time change is urgent, you're making decisions under pressure without adequate evaluation time.
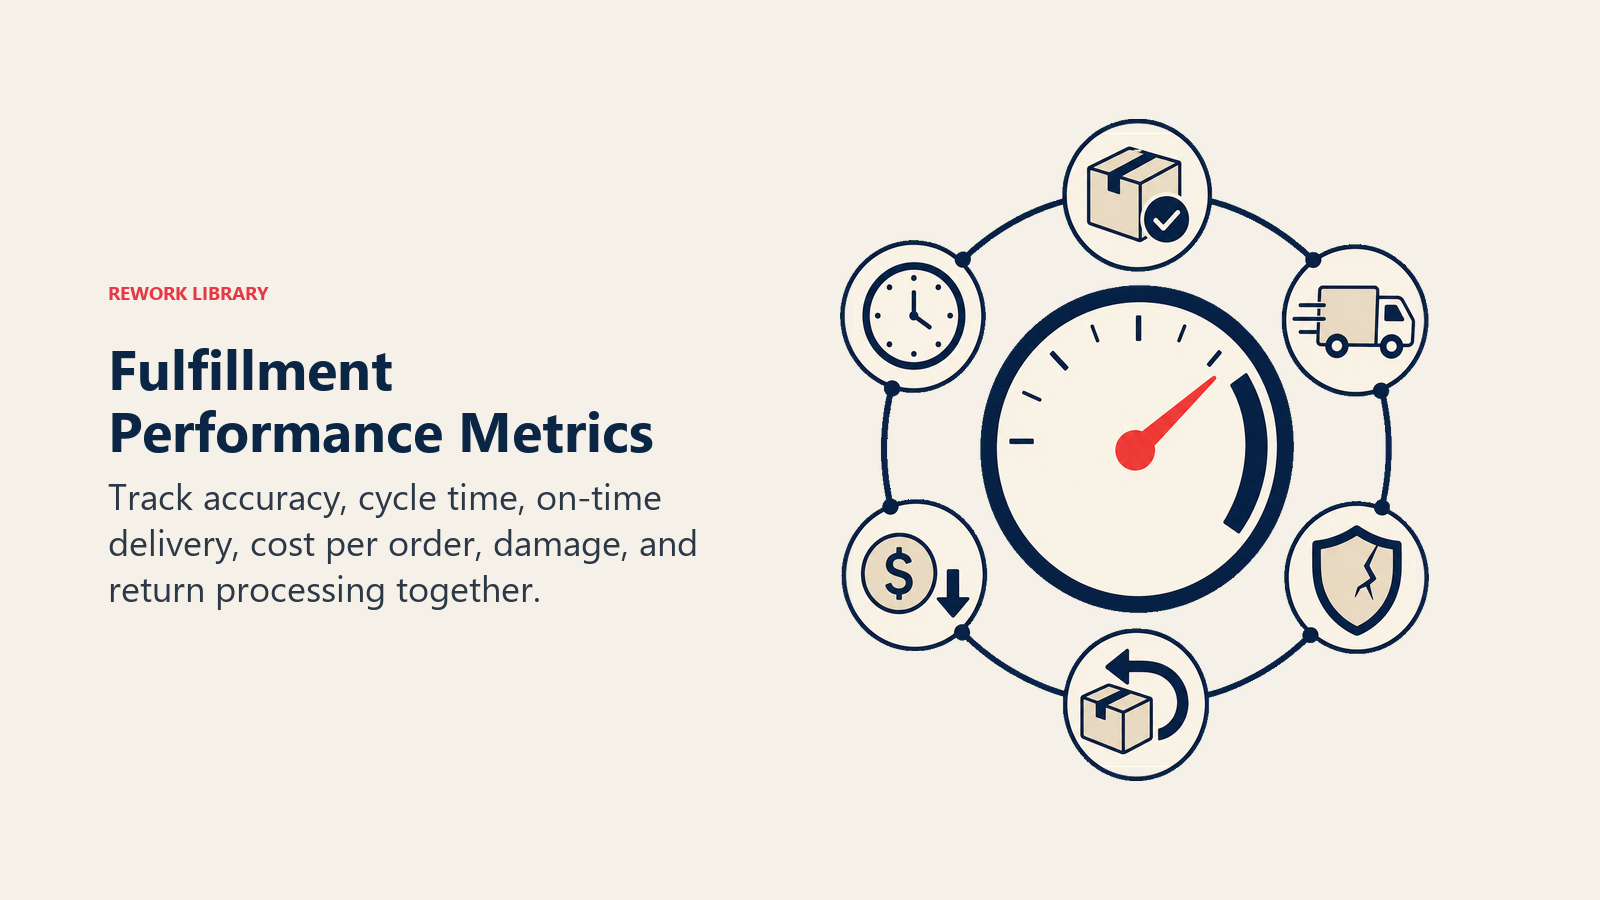
Fulfillment Metrics & Performance Management
What gets measured improves. The right metrics focus attention on what drives profitability and customer experience. Order accuracy is the foundation: Target: 98.5-99.5% accuracy (correct items, correct quantities, correct address) Measurement: Orders shipped correctly / total orders shipped
Impact: Every 1% improvement in accuracy eliminates roughly 1% of customer service contacts and replacement shipments. For a brand shipping 50,000 orders annually, improving from 96% to 99% accuracy saves roughly $30K-50K in customer service and replacement costs.
On-time shipping determines customer satisfaction:
Target: 95%+ of orders shipped within SLA (typically same-day or next-day from order receipt)
Measurement: Orders shipped by commitment time / total orders
Impact: Late shipments drive support contacts, negative reviews, and reduced repeat purchase rates. Missing SLAs by even 1 day on 10% of orders measurably hurts customer lifetime value.
Damage rates reveal packaging and handling quality:
Target: Under 2% for most categories, under 1% for fragile items
Measurement: Damaged items reported / total items shipped
Impact: Damaged items require replacement shipments (doubling fulfillment costs), generate customer service costs, and reduce satisfaction. Each percentage point of damage rate on 50,000 shipments creates roughly $15K-25K in direct costs.
Cost per order captures operational efficiency:
Target: Varies by model and volume, but should decline as volume increases
Measurement: Total fulfillment costs / orders fulfilled
Tracking: Break this down by components (labor, warehousing, packaging, shipping) to identify optimization opportunities.
If your cost per order is increasing while volume grows, you have serious efficiency problems requiring immediate attention.
Days inventory outstanding (DIO) measures inventory efficiency:
Target: 60-90 days for most categories (lower is better, but stockouts are worse than extra inventory)
Measurement: (Average inventory value / COGS) × 365
Impact: Reducing DIO from 90 to 60 days frees working capital equal to one month of COGS. For a brand doing $5M revenue at 40% COGS, that's roughly $167K in freed capital.
Return rate identifies product and customer experience issues:
Target: Category dependent (5-10% for most products, 20-30% accepted in apparel)
Measurement: Units returned / units shipped
Tracking by reason: Size/fit issues, quality problems, damage in transit, buyer's remorse, etc.
Every percentage point reduction in return rate drops straight to bottom line. For a brand doing $10M revenue at 25% return rate, reducing returns to 20% typically adds $150K-250K to profitability.
Pick and pack efficiency drives labor costs:
Target: 20-40 orders per labor hour depending on complexity
Measurement: Orders fulfilled / total labor hours
This metric reveals whether process improvements, better layout, or technology could improve efficiency. Brands that don't track this number usually have 30-50% efficiency opportunities sitting undiscovered.
Inventory accuracy prevents stockouts from phantom inventory:
Target: 98%+ (physical inventory matches system inventory)
Measurement: Cycle count accuracy checks
Impact: Inventory errors create stockouts (lost sales) when system shows stock but warehouse doesn't have it, or excess inventory carrying costs when physical exceeds system.
Carrier performance metrics:
On-time delivery rate: Percentage of shipments delivered by promised date Damage in transit: Items damaged during shipping Lost packages: Shipments that never arrive
Track by carrier to identify performance issues and optimize carrier mix. Sometimes the cheapest carrier creates the most expensive customer experience.
SLA compliance (for 3PL partners):
Orders processed same-day: Percentage meeting cutoff time commitments Inventory accuracy: System vs physical inventory matches Response time: Hours to respond to issues or questions
Don't manage 3PLs with trust, manage with data. Monthly business reviews using these metrics keep performance high and identify problems before they become crises.
Implementing metric tracking:
Start with 3-5 core metrics rather than trying to track everything. Order accuracy, cost per order, and on-time shipping cover most operational performance.
Review daily operationally (Are we hitting targets today?), weekly tactically (What trends are emerging?), and monthly strategically (What needs to change?).
Create simple dashboards. Complicated reporting never gets used. One-page summaries with trend lines and red/yellow/green status indicators drive action.
Benchmark against your own performance over time rather than industry averages. Improving from 95% to 98% accuracy matters more than whether you're "better than average."
The brands that excel at fulfillment obsessively track metrics, investigate variances, and systematically improve. Small optimizations compound, 0.5% efficiency improvement monthly becomes 6% annually, which on a $5M business represents $300K in value creation.
Fulfillment strategy isn't about finding the "perfect" model, it's about aligning operational capabilities with your business stage, product characteristics, and customer expectations while continuously optimizing for profitability.
Start by understanding your true fulfillment economics. Most brands underestimate actual costs by 20-40% when they fail to account for labor inefficiency, inventory carrying costs, or customer service burden from fulfillment failures.
Choose your model based on volume, capital, and capabilities rather than ideology. In-house operations aren't automatically better than 3PLs, they're better when your volume, product, and expertise justify the investment. Hybrid models aren't complicated for the sake of complexity, they're responses to real trade-offs between cost, speed, and control.
Optimize systematically by tracking the metrics that actually drive profitability. Cost per order matters, but accuracy matters more. Speed creates competitive advantage only when economics support it.
Plan transitions before they're critical. Changing fulfillment models under pressure leads to expensive mistakes. Model your economics at 2x and 5x current volume to understand when your current approach will break.
Your fulfillment operation either constrains growth or enables it. The difference comes down to strategic thinking, rigorous financial analysis, and systematic optimization based on data rather than assumptions.
For complementary strategies on related topics, explore:
- Unit Economics for E-commerce for profitability frameworks
- Inventory Management for stock optimization strategies
- Shipping Strategy & Pricing for customer-facing shipping decisions
- Free Shipping Thresholds for promotional economics
- Product Launch Strategy for fulfillment during launches
- Amazon FBA Strategy for marketplace fulfillment approaches
- Customer Lifetime Value for understanding fulfillment's impact on retention

Senior Operations & Growth Strategist
On this page
- Fulfillment Economics Foundation
- In-House Fulfillment Model
- Third-Party Logistics (3PL) Model
- Hybrid Fulfillment Models
- Speed vs Cost Trade-Offs
- Inventory Placement & Warehouse Strategy
- Packaging, Labeling & Branding
- Returns Management & Reverse Logistics
- Technology Integration for Fulfillment
- Scaling Fulfillment Operations
- Fulfillment Metrics & Performance Management