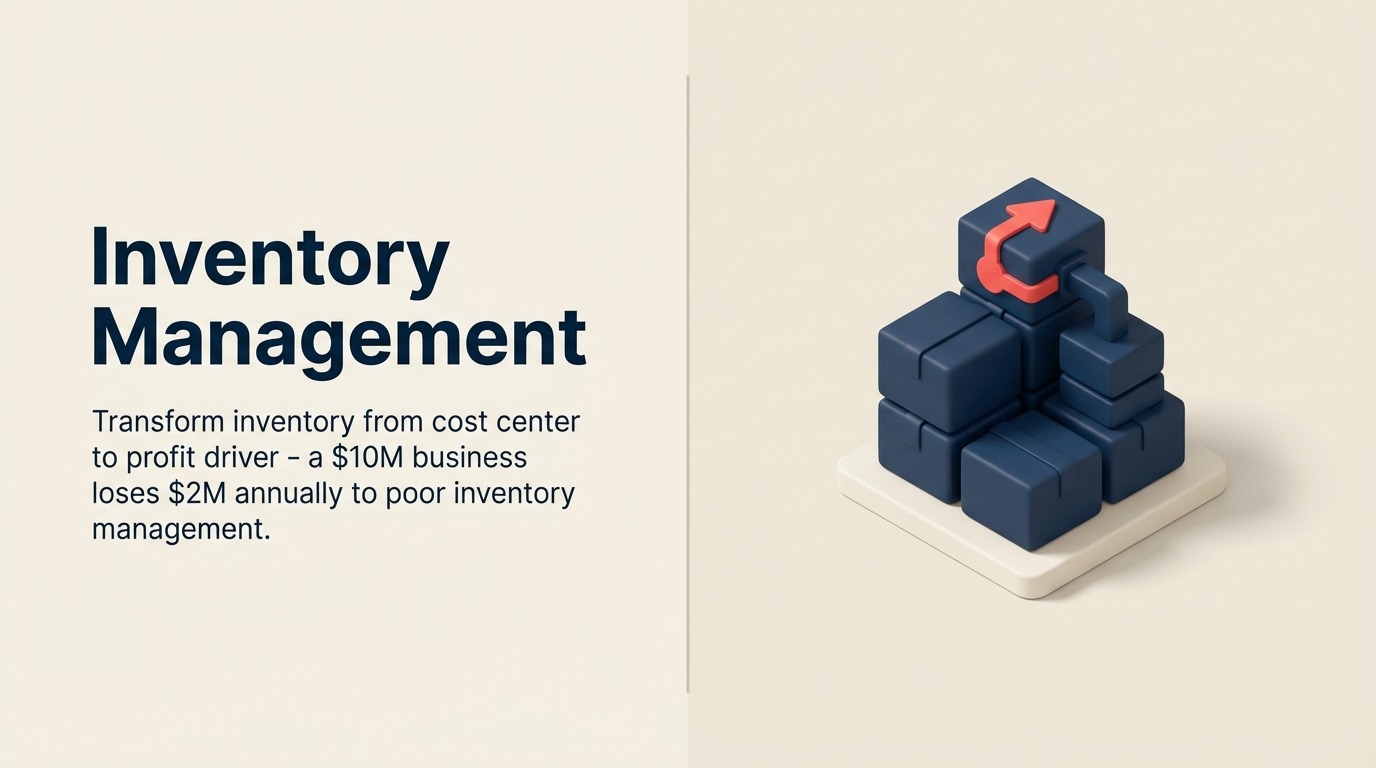
Inventory Management: The Hidden Driver of E-commerce Profitability
 Here's what nobody tells you about running a successful e-commerce business: inventory mistakes will destroy your margins faster than any marketing failure ever could.
Turn this article into takeaways for your work.
Each assistant summarizes the article only for you and suggests best practices for your work.
A $10M annual revenue e-commerce business with poor inventory management typically loses $2M annually. That's $500K in carrying costs, $800K in stockouts and lost sales, $400K in obsolescence and markdowns, and $300K in rush shipping and emergency orders. These aren't theoretical numbers. They're the reality for most growing e-commerce businesses.
The paradox of inventory management: you need enough product to never lose a sale, but not so much that you're drowning in carrying costs and cash flow constraints. Get this balance right, and inventory transforms from your biggest liability into your most strategic asset.
The Inventory Management Challenge
Most e-commerce founders think about inventory in binary terms: in stock or out of stock. The reality is far more nuanced. The true cost of holding inventory extends far beyond the purchase price:
Your cost of capital represents the opportunity cost of money tied up in inventory. If you could earn 15% annual returns investing in growth, every dollar in inventory costs you $0.15 per year in lost opportunity. For a business holding $500K in inventory? That's $75K annually in opportunity cost alone.
Physical carrying costs add 20-30% annually to your inventory investment. This includes warehousing at 8-12% of inventory value, insurance at 2-4%, handling and labor at 4-6%, shrinkage and damage at 2-3%, and obsolescence at 4-10%. A $500K inventory investment costs you $100K-$150K annually just to store.
The obsolescence risk escalates with product lifecycle. Fashion and electronics face 15-25% annual obsolescence rates. Seasonal products risk 30-50% markdowns if unsold. Even stable products face 5-10% annual obsolescence from packaging changes, formula updates, or shifting consumer preferences.
Then there's the stockout cost, the most invisible but often most expensive inventory mistake. Every stockout costs you the immediate lost sale - typically 20-40% of customers who find a product out of stock buy from a competitor instead. You lose customer lifetime value. Customer acquisition costs were wasted on customers who never complete their first purchase. Search ranking and advertising performance decline when conversion rates drop from stockouts. And brand reputation suffers when customers can't rely on product availability.
The inventory management challenge: optimize across all these competing factors simultaneously.
Inventory Forecasting Methods
Accurate demand forecasting separates profitable e-commerce businesses from struggling ones. How to build forecasting capability that actually works: Start with historical sales analysis, but don't stop there:
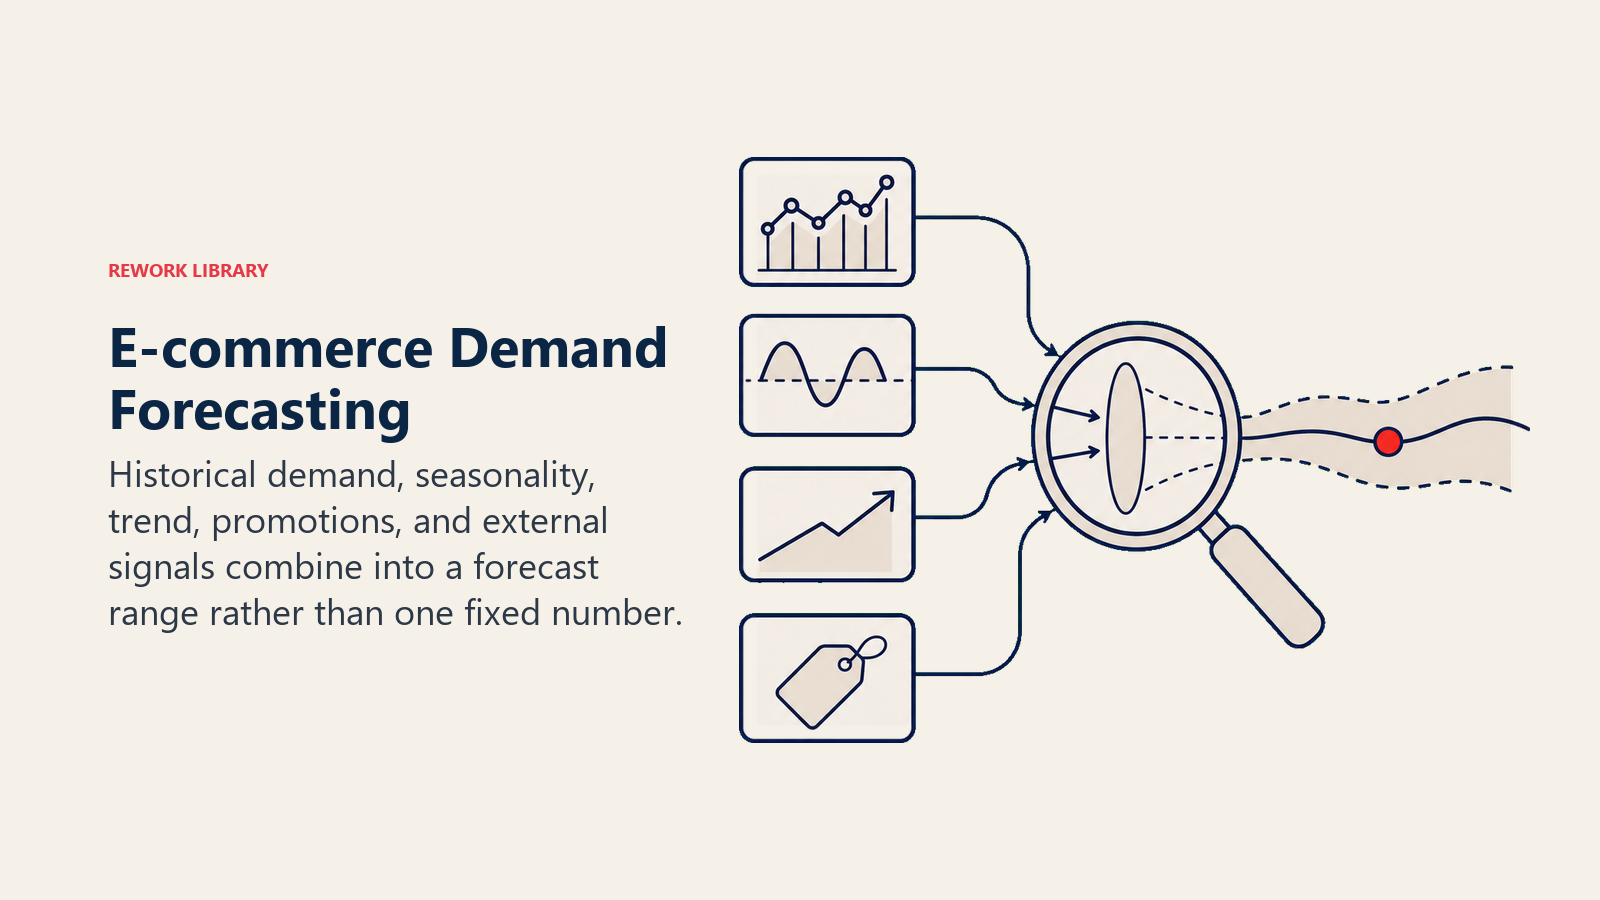
Calculate your baseline demand using rolling averages. A 12-week moving average smooths out weekly volatility while remaining responsive to trends. A 52-week average captures seasonal patterns. Compare current performance against both to identify emerging trends.
Layer in seasonality adjustments using seasonal indices. Calculate average sales for each week or month across multiple years, then divide by overall average to create your seasonal multiplier. Week 48 might have a 2.3x seasonal index for holiday shopping, while August might show a 0.7x index for summer slowdowns.
Trend analysis identifies whether your baseline is rising or falling. Calculate month-over-month growth rates for the past 12 months. A consistent 5% monthly growth rate fundamentally changes your inventory needs compared to flat or declining trends.
ABC analysis segments your inventory by importance:
A-items represent 15-20% of your SKUs but generate 70-80% of revenue. These products deserve daily monitoring, sophisticated forecasting, higher service levels (98-99% in-stock), and priority relationships with suppliers.
B-items comprise 30-35% of SKUs generating 15-20% of revenue. Forecast these weekly, maintain good service levels (95-97% in-stock), and use standard reorder procedures.
C-items make up 45-50% of SKUs but only 5-10% of revenue. These can be forecasted monthly, maintain acceptable service levels (90-95% in-stock), and should be considered for discontinuation if they don't support A-item sales.
The ABC analysis framework in practice:
Product categorization example:
- A-items: Your hero products, bestsellers, high-margin items
- B-items: Solid performers, complementary products, seasonal staples
- C-items: Long-tail products, slow movers, test products

Inventory investment allocation:
- A-items: 60-70% of inventory investment
- B-items: 20-30% of inventory investment
- C-items: 5-10% of inventory investment

Monitoring frequency:
- A-items: Daily review, immediate action on anomalies
- B-items: Weekly review, respond to patterns
- C-items: Monthly review, batch decisions
Statistical forecasting models improve accuracy:
For stable products with consistent sales history, use exponential smoothing. This method gives more weight to recent data while incorporating historical patterns. The formula: Forecast = α × (Recent Sales) + (1-α) × (Previous Forecast), where α typically ranges from 0.1 to 0.3.
For products with clear trends, use linear regression. Plot historical sales against time, fit a trend line, and project forward. This works well for products in growth or decline phases.
For seasonal products, use multiplicative seasonal models. Calculate your seasonal indices, apply them to your trend forecast, and adjust for recent performance deviations.
Most importantly, track your forecast accuracy. Calculate Mean Absolute Percentage Error (MAPE) for each forecasting method and product category. A MAPE below 20% is excellent, 20-30% is good, 30-50% is acceptable, and above 50% means your forecasting method needs refinement.
Stock Level Optimization
Setting optimal stock levels balances service level objectives against inventory carrying costs. Here's the framework that works. Calculate your safety stock requirements:
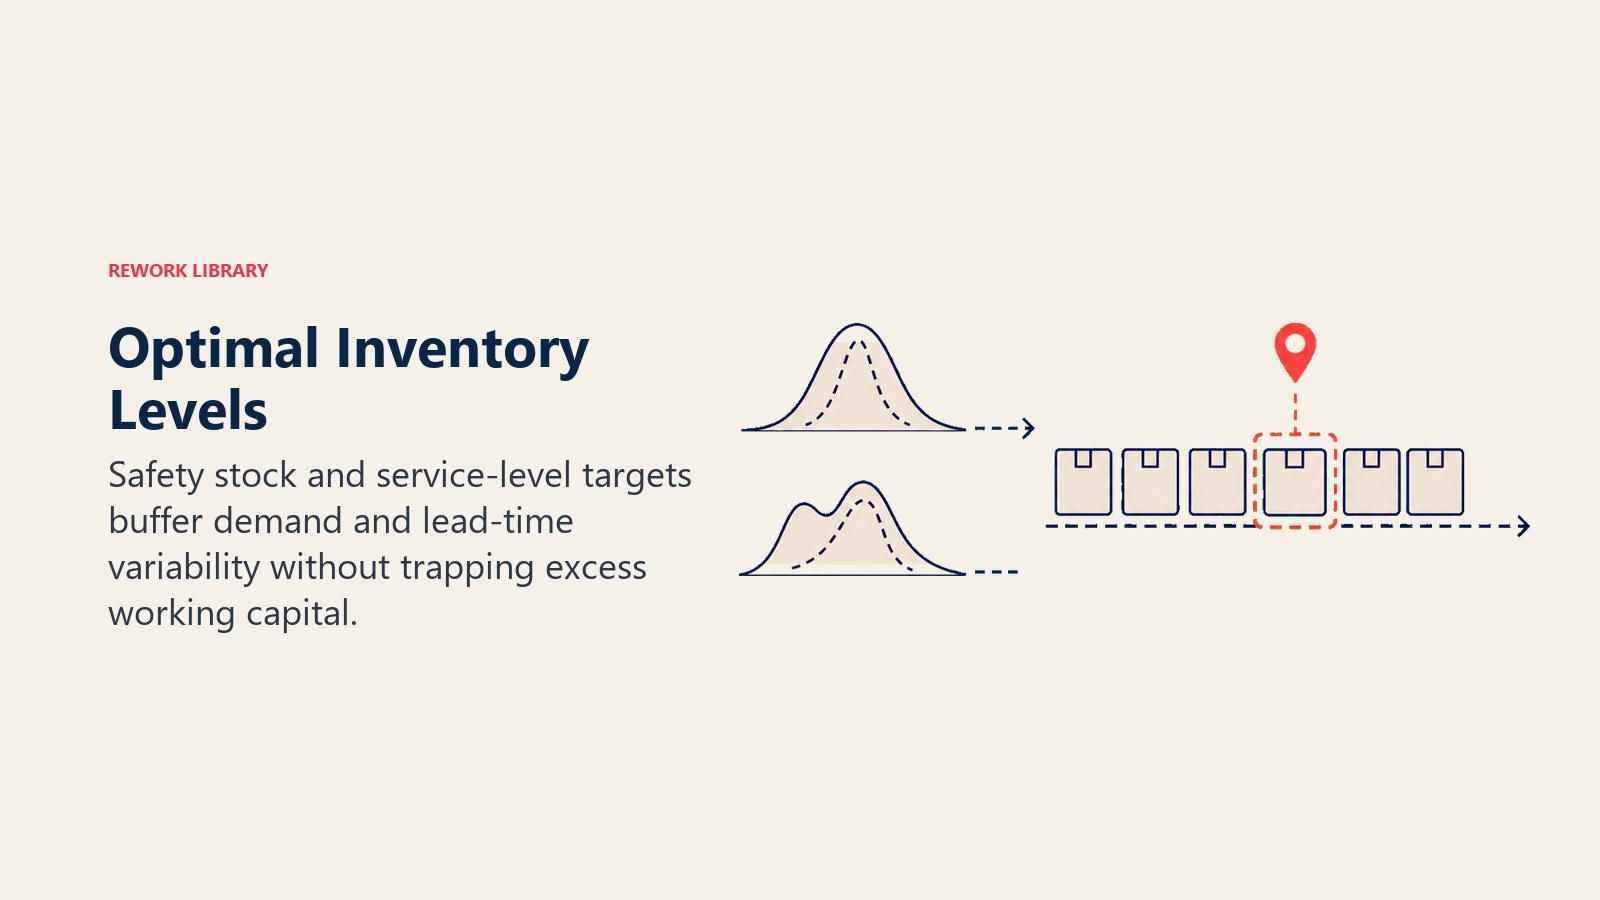
Safety stock protects against demand variability and supply uncertainty. The basic formula: Safety Stock = Z × σ × √Lead Time, where Z represents your desired service level (1.65 for 95%, 2.33 for 99%), and σ is your demand standard deviation.
Walk through a real calculation. Your product sells an average of 50 units per week with a standard deviation of 15 units. Your supplier lead time is 4 weeks. For a 95% service level (Z=1.65), your safety stock calculation is: 1.65 × 15 × √4 = 1.65 × 15 × 2 = 49.5 units (round to 50 units).
This means maintaining 50 units as a buffer against demand spikes and supply delays. Your total inventory target becomes: Average Lead Time Demand + Safety Stock = (50 units/week × 4 weeks) + 50 units = 250 units.
Set your reorder point strategically:
The reorder point triggers new orders before you run out. The formula: Reorder Point = (Average Daily Sales × Lead Time Days) + Safety Stock.
Using our previous example with 50 units weekly average (7.14 units daily), 28-day lead time, and 50-unit safety stock: Reorder Point = (7.14 × 28) + 50 = 200 + 50 = 250 units.
When inventory drops to 250 units, place your next order. This ensures product arrives before you dip into safety stock under normal conditions.
Determine optimal order quantities using Economic Order Quantity (EOQ):
EOQ balances ordering costs against holding costs. The formula: EOQ = √(2 × Annual Demand × Order Cost / Holding Cost per Unit).
If you sell 2,600 units annually, ordering costs are $150 per order, and holding costs are $5 per unit per year: EOQ = √(2 × 2,600 × 150 / 5) = √156,000 = 395 units.
Order 395 units at a time to minimize total inventory costs. This results in about 6-7 orders per year, balancing the frequency of ordering against the cost of holding excess inventory.
Set maximum inventory levels to prevent overstock:
Your maximum level should be: Reorder Point + EOQ - Safety Stock. This prevents inventory from growing indefinitely while maintaining adequate buffer.
For our example: 250 + 395 - 50 = 595 units maximum. When inventory reaches 250 units, order 395 units. Upon arrival, inventory peaks at 645 units, then draws down to reorder point again.
Reorder Points and Automated Replenishment
Manual inventory management fails at scale. Automation transforms inventory from a constant firefighting exercise into a reliable system. Build your automated reorder system around these triggers:
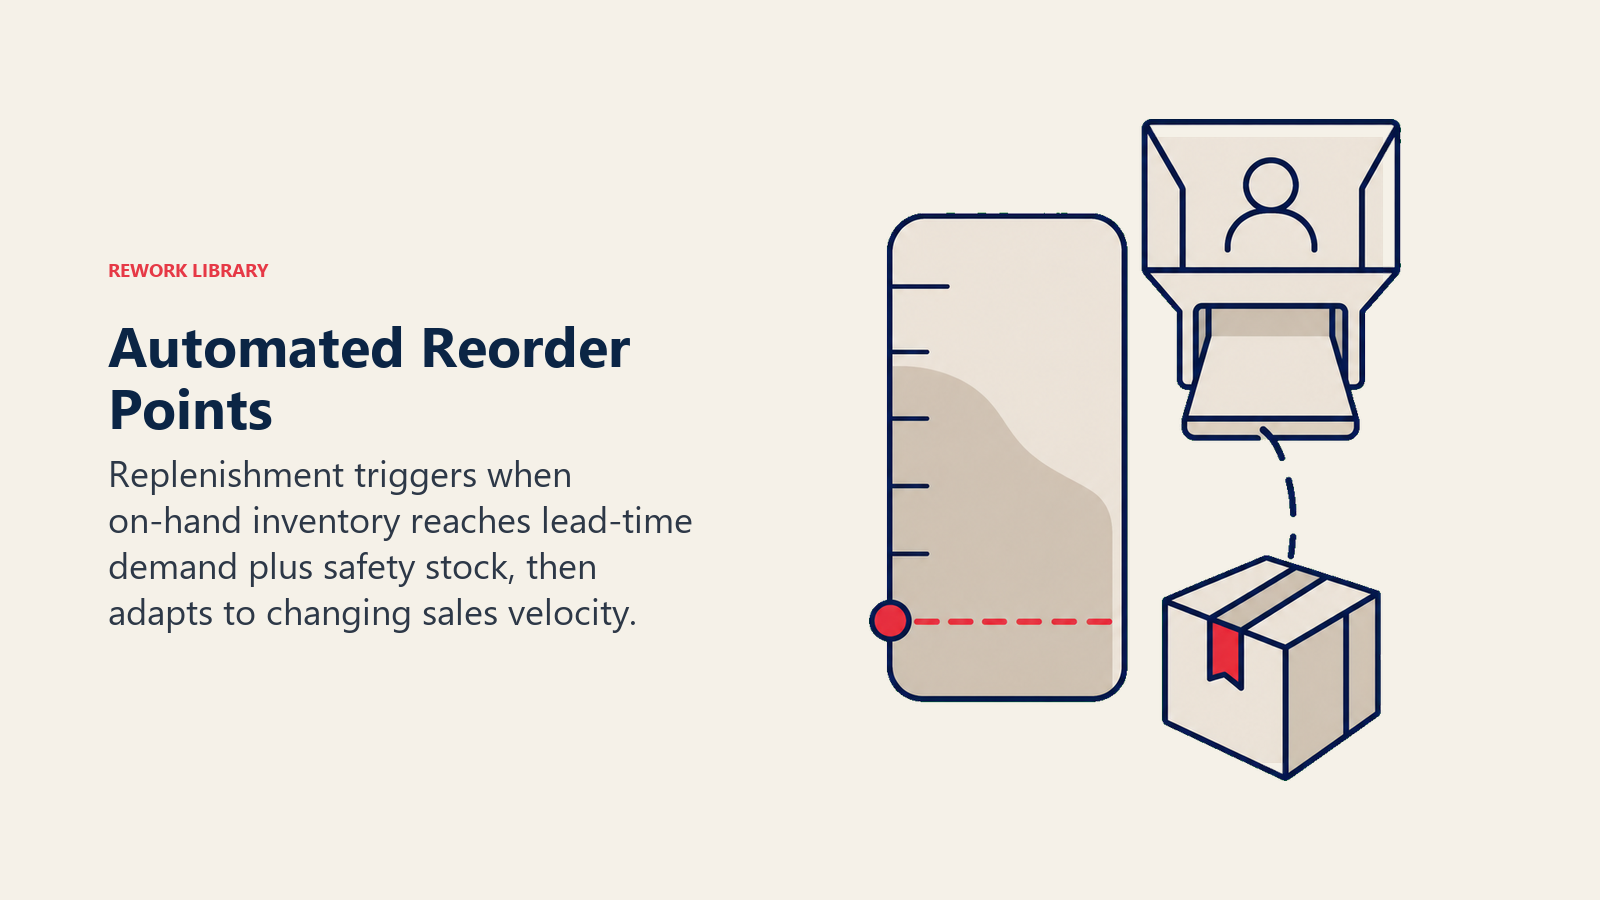
Quantity-based triggers fire when inventory drops below your reorder point. This works well for steady-demand products with reliable suppliers. Set your reorder point at lead time demand plus safety stock, and let the system automatically generate purchase orders.
Time-based triggers place orders on a fixed schedule regardless of current inventory levels. This works for products with predictable seasonal patterns or supplier minimum order schedules. Schedule orders to arrive just before anticipated demand increases.
Velocity-based triggers adjust reorder points based on recent sales rates. If sales velocity increases 50% over the past 2 weeks, the system automatically increases reorder points by 50%. This keeps inventory responsive to demand changes without manual intervention.
Account for supplier lead time variability:
Your safety stock calculation should include supplier reliability. If your supplier delivers in 28 days 70% of the time but occasionally takes 35 days, your safety stock needs to cover that 7-day variance.
Calculate lead time standard deviation alongside demand standard deviation. The combined formula: Safety Stock = Z × √((Average Lead Time × Demand Variance) + (Average Demand² × Lead Time Variance)).
This accounts for both demand uncertainty and supply uncertainty in your buffer calculations.
Implement min-max inventory controls:
Set minimum levels that trigger automatic reorders and maximum levels that prevent over-ordering. Your inventory management system should flag any order that would push inventory above maximum levels for review.
For A-items, maintain tight min-max ranges (90-110% of optimal). For C-items, allow wider ranges (70-130% of optimal) to reduce management overhead.
Create exception alerts for unusual patterns: demand spikes above 2 standard deviations, lead times exceeding expectations, inventory levels approaching stockout, or inventory aging beyond normal turnover periods.
Inventory Turnover and Velocity Analysis
Inventory turnover measures how efficiently you're converting inventory into sales. This ratio directly impacts cash flow and profitability. Calculate your inventory turnover ratio:
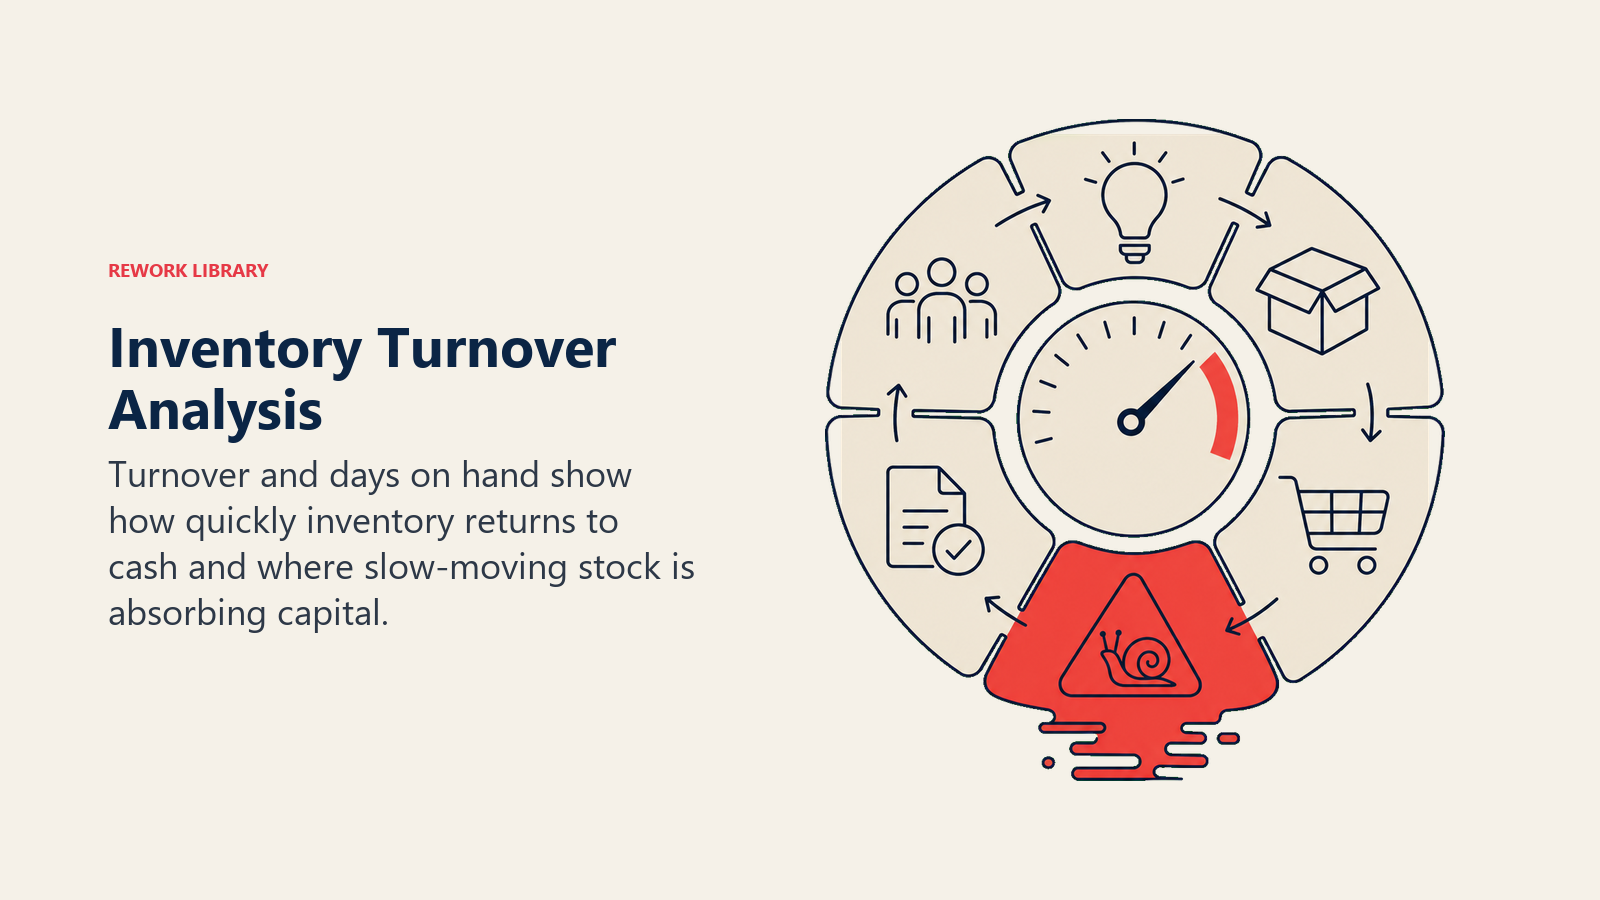
The formula: Inventory Turnover = Cost of Goods Sold / Average Inventory Value. If you have $2M in annual COGS and maintain $400K average inventory, your turnover is 5x annually, or roughly every 73 days.
Days Inventory Outstanding (DIO) inverts this ratio: DIO = 365 / Inventory Turnover. A 5x turnover equals 73 days of inventory. This means the average dollar invested in inventory returns to cash in 73 days.
Industry benchmarks provide context:
Fashion and apparel should turn 4-6x annually (60-90 days). Consumer electronics need 8-12x turnover (30-45 days). Grocery and consumables require 15-20x turnover (18-24 days). Home goods typically turn 4-5x annually (73-90 days).
Compare your turnover against both industry benchmarks and your own historical performance. Declining turnover indicates growing efficiency problems. Improving turnover signals better inventory management.
Velocity analysis identifies your fastest and slowest movers:
Sort your entire catalog by units sold per day. Your top 20% by velocity likely represent 60-70% of your unit volume. These high-velocity items deserve:
Never-out-of-stock targets of 99%+, daily monitoring and rapid replenishment, premium warehouse locations for fast picking, and supplier relationships that guarantee priority fulfillment.
Your bottom 20% by velocity create the obsolescence risk. These slow movers need monthly review for discontinuation consideration, liquidation plans for aging inventory, reduced reorder quantities, or seasonal promotional strategies to accelerate turnover.
Use velocity metrics to optimize cash flow:
Every 1x improvement in inventory turnover frees up significant cash. If you're turning inventory 5x annually with $400K average inventory, improving to 6x turnover reduces inventory investment to $333K. That frees up $67K in working capital.
For a $10M business, improving turnover from 5x to 7x reduces inventory investment from $2M to $1.43M - freeing $570K for growth investments.
Dead Stock and Obsolescence Management
Every e-commerce business accumulates dead stock. The difference between profitable and struggling businesses is how quickly they identify and liquidate it. Identify dead stock before it becomes a crisis:
Flag any SKU with zero sales in the past 90 days for A and B items, or 180 days for C items. These products are consuming warehouse space and capital without generating returns.
Calculate inventory aging by SKU. Products sitting for 6+ months face growing obsolescence risk. By 12 months, most inventory should be considered dead stock unless it's a seasonal item awaiting its season.
Track sell-through rates for new products. If a new product hasn't achieved 30% sell-through within 90 days, you've likely over-ordered. Start liquidation planning immediately rather than hoping demand materializes.
Create a systematic liquidation hierarchy:
Start with bundle strategies. Package slow-moving items with bestsellers as value bundles. This moves inventory while maintaining margin integrity and enhancing perceived value of the bundle.
Implement email and social media promotions targeting your existing customer base. Offer 20-30% discounts to your list before going to broader liquidation channels. Customer acquisition costs are zero, and margins remain reasonable.
Run on-site promotions and flash sales for excess inventory. Time-limited offers create urgency and move inventory without permanently devaluing products. Test different discount levels through dynamic pricing. Sometimes 25% moves inventory as effectively as 50% with double the margin.
Partner with liquidation marketplaces as your next step. Leveraging a multi-channel marketplace strategy, sites like Overstock, Amazon Warehouse Deals, or category-specific liquidation platforms typically purchase at 20-40% of wholesale cost. You'll take a loss, but you'll free capital and warehouse space.
Finally, donate unmovable inventory for tax deductions. The tax benefit often exceeds pennies-on-the-dollar liquidation proceeds, plus you create goodwill and clear warehouse space.
Prevent future obsolescence through better Product Research & Validation:
Test new products with small initial orders, order quantities that sell through in 30-45 days. This limits exposure while proving demand. Only commit to larger orders once you've validated product-market fit.
Build supplier agreements allowing smaller, more frequent orders. Yes, you'll pay slightly higher per-unit costs, but you'll dramatically reduce obsolescence risk. The margin sacrifice pays for itself through reduced dead stock.
Implement product sunset strategies. When introducing new versions, create clear plans for liquidating old inventory. Don't launch version 2.0 while sitting on 6 months of version 1.0 inventory.
Multi-Warehouse and SKU Complexity
Growth creates inventory complexity. Multiple warehouses and expanding SKU counts require different management approaches. Design your multi-warehouse strategy around customer proximity:
Distribute inventory to minimize shipping zones and transit times. When choosing your fulfillment strategy, if 40% of customers are on the West Coast, 35% in the Midwest, and 25% on the East Coast, your inventory distribution should roughly mirror this pattern for fast-moving items.
Maintain centralized inventory for slow-moving items. Don't split C-items across multiple warehouses. Keep them in one location to maintain adequate stock levels and reduce complexity. Consider working with a 3PL partner to manage multi-location inventory. Only duplicate inventory that sells fast enough to justify the carrying cost at each location.
Use demand forecasting by region to optimize distribution. If seasonal patterns differ by geography (winter products sell earlier and longer in northern regions), adjust inventory distribution timing accordingly.
Manage SKU complexity before it manages you:
The 80/20 rule applies ruthlessly to SKU profitability. Typically 20% of SKUs generate 80% of profit, while the bottom 50% of SKUs often generate zero or negative profit after accounting for complexity costs.
Calculate true SKU profitability including product margins, inventory carrying costs, warehouse space allocation, picking and packing labor, photography and listing maintenance, customer service time per order, and returns management processing costs.
Many low-volume SKUs appear profitable until you properly allocate overhead. A $50 product with $20 margin that sells 2 units per month sounds fine, until you realize it consumes $300 annually in true allocated costs.
Implement a SKU rationalization process:
Quarterly, review all SKUs using these criteria: units sold in past 90 days, contribution margin after full cost allocation, inventory turns, return rate, and strategic importance to hero product sales (covered in Hero Product Strategy).
Discontinue SKUs that: haven't sold in 180 days, generate negative contribution margin after full costs, have inventory turns below 2x annually (unless seasonal), or have return rates above 15% without clear resolution path.
This disciplined approach typically identifies 20-30% of SKUs for discontinuation, freeing capital and reducing complexity without meaningful revenue impact.
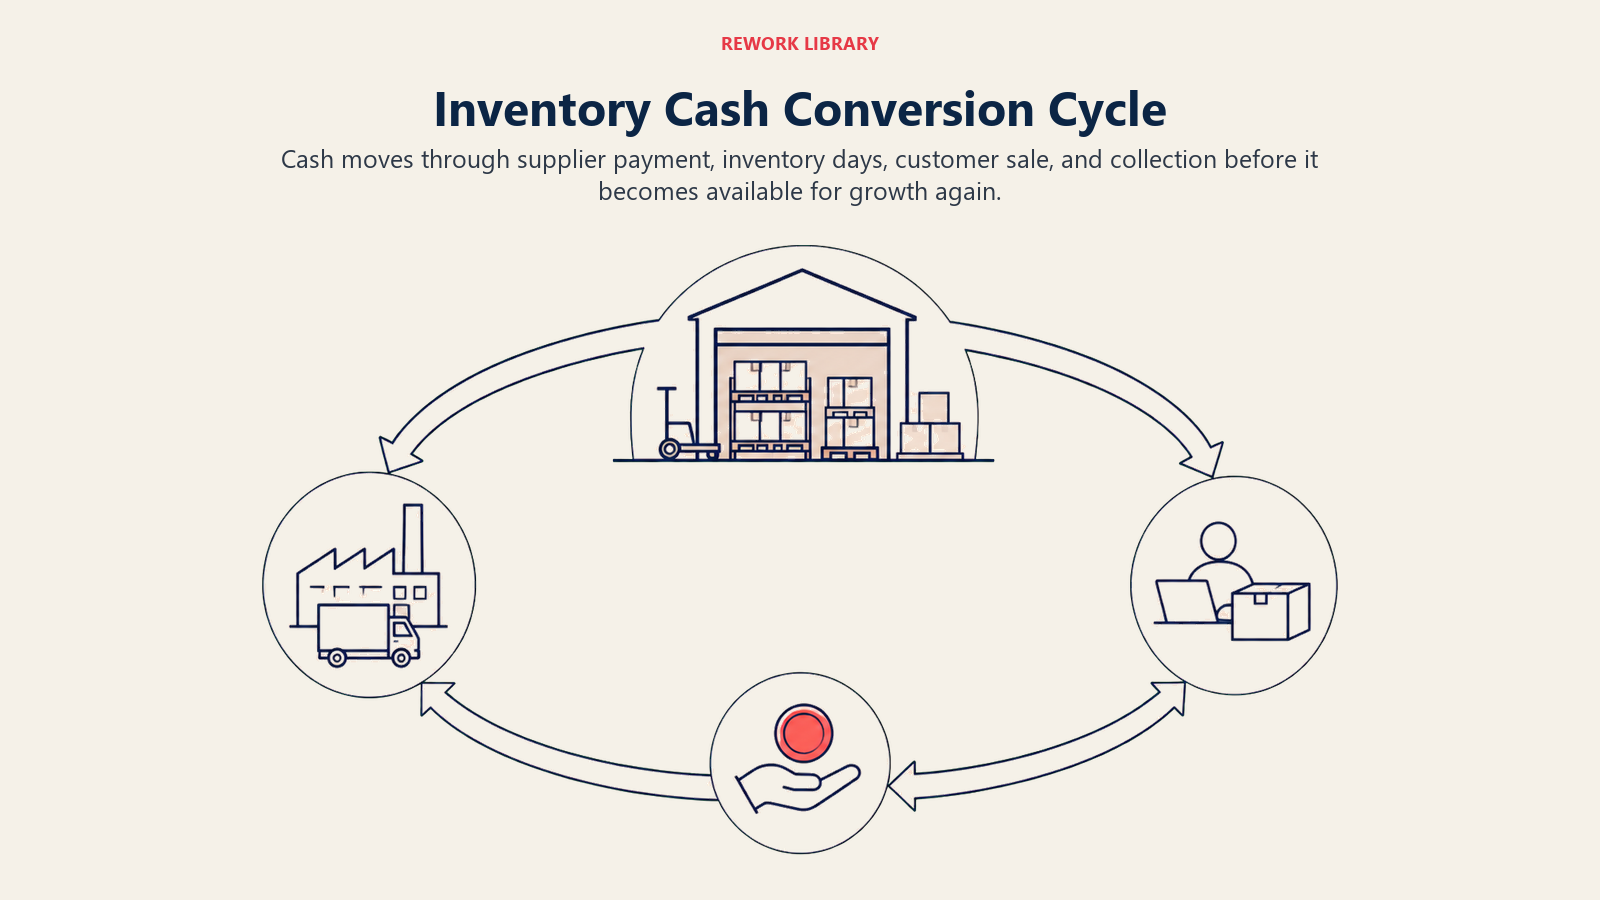
Cash Flow Impact and Working Capital
Inventory is your largest working capital investment. Managing it effectively determines whether you can fund growth or constantly struggle with cash constraints. Understand your cash conversion cycle:
Days Inventory Outstanding (DIO) measures how long cash sits in inventory. Calculate: (Average Inventory / COGS) × 365. If you have $500K average inventory and $3M COGS, your DIO is 61 days.
Days Sales Outstanding (DSO) measures how long it takes to collect payment. For direct-to-consumer e-commerce, this is typically 0-2 days.
Days Payable Outstanding (DPO) measures how long you take to pay suppliers. If you're paying in 30 days, that's your DPO.
Your Cash Conversion Cycle = DIO + DSO - DPO. With 61 days inventory, 1 day collections, and 30 day payables, your cycle is 32 days. This means you need to finance 32 days of operations before revenue becomes cash.
Optimize working capital through inventory management:
Reduce DIO by improving inventory turnover. Every 10-day reduction in DIO for a $3M COGS business frees up approximately $82K in working capital.
Extend DPO through supplier negotiation, but maintain good relationships. Moving from 30 to 45-day terms improves your cash position by $123K for a $3M COGS business without changing operations.
The combination of faster inventory turnover and extended payment terms dramatically improves cash availability for growth. Understanding these relationships is critical to your overall unit economics for e-commerce.
Plan inventory investments around growth stages:
Early-stage businesses should maintain 60-75 days of inventory (5-6x turnover). You're still learning demand patterns and can't afford stockouts that kill momentum. Focus on having product available over optimizing every dollar.
Growth-stage businesses should target 45-60 days of inventory (6-8x turnover). You understand demand better and can tighten inventory without risking stockouts. Balance investment in new product expansion with efficient existing product management.
Mature-stage businesses should achieve 30-45 days of inventory (8-12x turnover). With predictable demand and established supplier relationships, you can minimize inventory investment while maintaining high service levels. Every freed dollar funds additional product lines or marketing.
Inventory Planning for Growth Stages
Your inventory strategy must evolve as your business scales. What works at $500K annual revenue fails at $5M. Startup stage ($0-$1M revenue):
Your primary goal is validating product-market fit, not optimizing inventory efficiency. Expect to maintain 75-90 days of inventory, it's inefficient but necessary.
Order conservatively for new products, quantities that sell through in 45-60 days. Better to reorder and pay slightly higher per-unit costs than to get stuck with 12 months of inventory on a product that doesn't resonate.
Accept frequent stockouts as learning opportunities. Each stockout teaches you about demand patterns while you prove your business model. Your customers will forgive occasional stockouts at this stage. They won't forgive being marketed to if you can't fulfill orders.
Partner with flexible suppliers willing to work with smaller order quantities. You'll pay more per unit, but flexibility is worth the premium during validation stages.
Growth stage ($1M-$10M revenue):
Now you're balancing growth against efficiency. Target 45-60 days of inventory while maintaining 95%+ in-stock rates on hero products.
Implement proper forecasting systems. Your historical data is now sufficient to build meaningful statistical models. Invest in inventory management software that automates reorder points and flags exceptions.
Develop supplier relationships that support growth. As order volumes increase, negotiate better terms: lower MOQs, extended payment terms, priority production slots, and dedicated account management.
Build working capital discipline. Growth creates intense cash demands, new product investment, increased inventory, marketing scale-up. Improving inventory efficiency from 75 to 50 days of inventory for a $5M business frees over $300K for growth investments.
Mature stage ($10M+ revenue):
Your focus shifts to optimization and expansion. Target 30-45 days of inventory with 98%+ service levels on all A-items, maintained through sophisticated systems.
Implement advanced forecasting using machine learning models that factor in dozens of variables: historical sales patterns, seasonal indices, promotional calendars, marketing spend, weather patterns for relevant categories, and economic indicators.
Develop strategic supplier partnerships. Your volume justifies vendor-managed inventory programs, consignment arrangements for new products, and dedicated production capacity.
Expand into multi-warehouse distribution for shipping speed and cost optimization. Use regional demand patterns to optimize inventory distribution, reducing shipping costs while improving delivery speed.
Supplier Relationships and Negotiation
Your suppliers determine your inventory success as much as your internal processes. Strong supplier relationships create competitive advantages. Develop strategic supplier partnerships:
Consolidate your supplier base where possible. Three great suppliers beat ten mediocre ones. Concentration gives you negotiating power and mindshare with your key suppliers.
Share forecasts and planning information with strategic suppliers. Visibility into your plans helps them plan production, often resulting in better pricing, guaranteed capacity during peak seasons, and flexibility during demand fluctuations.
Create supplier scorecards tracking: on-time delivery rate, quality defect rate, lead time accuracy, responsiveness to issues, flexibility with order changes, and pricing competitiveness.
Review supplier performance quarterly. Address issues proactively and reward great performance with increased order volume and longer-term commitments.
Negotiate favorable terms as you scale:
Start with payment terms. Moving from Net 30 to Net 45 or Net 60 as you grow improves cash flow without changing anything else about your relationship.
Negotiate volume discounts based on annual commitments rather than per-order quantities. Commit to $500K annual volume for 15% better pricing, then place orders throughout the year as needed.
Request flexible MOQs. As your reliable order volume increases, suppliers often reduce minimum order requirements, allowing you to order more frequently in smaller quantities, reducing inventory while maintaining product availability.
Build supplier redundancy for critical products. Having two qualified suppliers for your hero products protects against production issues, shipping delays, or supplier financial problems. The complexity is worth the risk mitigation.
Manage lead time optimization:
Document actual lead times versus quoted lead times. If suppliers consistently deliver in 28 days when they quote 35 days, adjust your reorder points to reflect reality, freeing working capital.
Request lead time commitments with penalties for delays. As a larger customer, you can negotiate expedited production slots or guaranteed delivery windows during critical periods.
Implement supplier portals or EDI connections that automate ordering and provide real-time inventory visibility. Reduced communication lag often cuts several days from lead times.
Inventory Metrics Dashboard
You can't manage what you don't measure. Build a dashboard that provides daily visibility into inventory health. Core inventory KPIs to track daily:
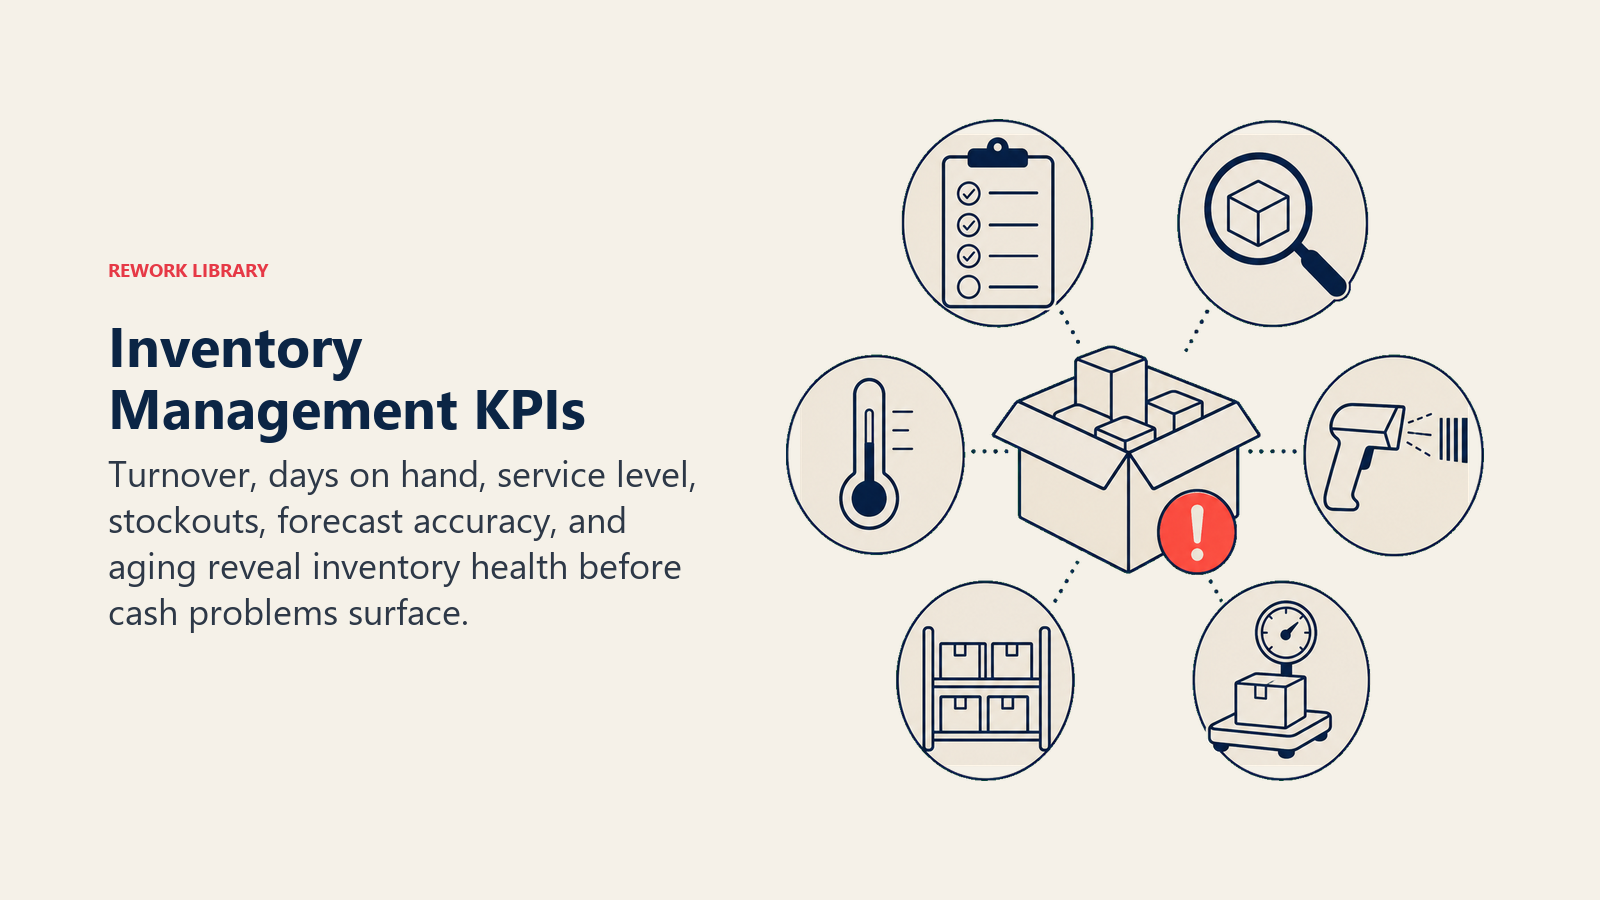
When building your e-commerce metrics and KPIs dashboard, inventory turnover ratio (rolling 90-day) shows whether efficiency is improving or degrading. Set targets by product category and flag variance from targets.
Service level percentage measures in-stock rate for your A-items. Calculate: (Days in Stock / Total Days) × 100. Target 98%+ for hero products, 95%+ for B-items, 92%+ for C-items.
Stockout rate tracks frequency and duration of stockouts. Log every stockout with estimated lost sales. This metric prevents you from under-investing in inventory to hit efficiency targets at the cost of revenue.
Days of inventory on hand (DIO) by category identifies where capital is trapped. Break down by A/B/C categories to spot problems before they become crises.
Inventory aging by SKU flags obsolescence risk. Report inventory in buckets: 0-90 days, 91-180 days, 181-365 days, and 365+ days. Everything in the 180+ day buckets needs liquidation plans.
Weekly review metrics:
Forecast accuracy (MAPE) by category and forecaster measures whether your predictions are improving. Track forecast error trends, is accuracy improving or degrading?
Reorder point exceptions report all products that hit reorder points unexpectedly early (demand spike) or unusually late (demand decline). These exceptions reveal changing demand patterns.
Supplier performance scorecard tracks on-time delivery rates, lead time accuracy, and quality issues. Address vendor problems before they create stockouts.
New product sell-through rates track whether new launches are meeting expectations. Flag any new product below 30% sell-through at 90 days for immediate action.
Monthly strategic metrics:
Gross margin return on inventory investment (GMROI) measures profitability per dollar invested in inventory. Calculate: Gross Margin / Average Inventory Investment. Target GMROI varies by category but typically ranges from 3:1 to 5:1.
Working capital efficiency tracks how much capital is tied up in inventory relative to sales. Calculate: (Average Inventory / Annual Revenue) × 365. Lower is better, typically 30-60 days for efficient operations.
Inventory investment by product lifecycle stage shows where capital is allocated: growth products, mature products, or declining products. Ensure you're not over-investing in declining categories while under-investing in growth opportunities.
SKU profitability after allocated inventory costs identifies which products truly drive profit versus which create complexity without contribution.
Putting It All Together
Inventory management transforms from cost center to competitive advantage when you implement systematic processes.
Start by calculating your current inventory position accurately. Measure turnover ratio, DIO, service levels, and forecast accuracy. Establish baselines before optimizing.
Implement ABC analysis to focus attention where it matters most. Your A-items deserve sophisticated management, while C-items need simple rules to prevent over-managing complexity.
Build forecasting systems that balance historical patterns with forward-looking trends. Start simple with moving averages and seasonal adjustments, then add sophistication as you scale.
Set reorder points and safety stock levels using the formulas provided. Automate replenishment to free your time for strategic decisions rather than order placement.
Create liquidation processes before you need them. Dead stock is inevitable, systematic liquidation minimizes losses.
Track metrics that drive behavior. If you're not measuring service levels, stockout costs, and forecast accuracy, you can't systematically improve them.
Most importantly, recognize that inventory management directly impacts your unit economics (covered in Unit Economics for E-commerce). Every dollar freed from excess inventory can be invested in Product Line Expansion or marketing. Every stockout prevented protects customer lifetime value.
The difference between profitable and struggling e-commerce businesses often comes down to inventory management. Get this right, and you'll have the cash flow and product availability to scale. Get it wrong, and you'll constantly struggle with cash constraints and lost sales, no matter how good your products or marketing.
Your inventory is either your biggest liability or your strategic advantage. The frameworks in this article help you make it the latter.
Related Resources:

Senior Operations & Growth Strategist
On this page
- The Inventory Management Challenge
- Inventory Forecasting Methods
- Stock Level Optimization
- Reorder Points and Automated Replenishment
- Inventory Turnover and Velocity Analysis
- Dead Stock and Obsolescence Management
- Multi-Warehouse and SKU Complexity
- Cash Flow Impact and Working Capital
- Inventory Planning for Growth Stages
- Supplier Relationships and Negotiation
- Inventory Metrics Dashboard
- Putting It All Together