Seasonal Product Planning: Maximizing Revenue Through Strategic Calendar Planning
 The difference between a profitable season and a missed opportunity often comes down to planning. While your competitors scramble to stock up two weeks before Valentine's Day, you've already secured inventory, launched pre-season campaigns, and positioned yourself to capture maximum revenue.
Turn this article into takeaways for your work.
Each assistant summarizes the article only for you and suggests best practices for your work.
Seasonal product planning isn't about reacting to the calendar. It's about anticipating demand, optimizing inventory, and executing a coordinated strategy that turns seasonal peaks into predictable revenue drivers.
Why Seasonal Planning Matters
The numbers tell the story. A well-executed seasonal strategy can drive 30-50% revenue spikes during peak periods. For many e-commerce businesses, Q4 alone accounts for 40-50% of annual revenue. But seasonal selling is a double-edged sword. Stock too little and you leave money on the table while competitors fulfill orders. Stock too much and you're left with clearance inventory that eats into margins and impacts your unit economics for e-commerce.
The risks compound fast:
- Stockouts during peak demand mean lost sales you'll never recover
- Excess inventory ties up cash and requires deep discounting
- Late marketing preparation means higher ad costs and lower conversion
- Poor forecast accuracy creates a cascade of operational problems
Seasonal planning mitigates these risks while maximizing opportunity. You're not just preparing for a busy period, you're engineering profitable growth.
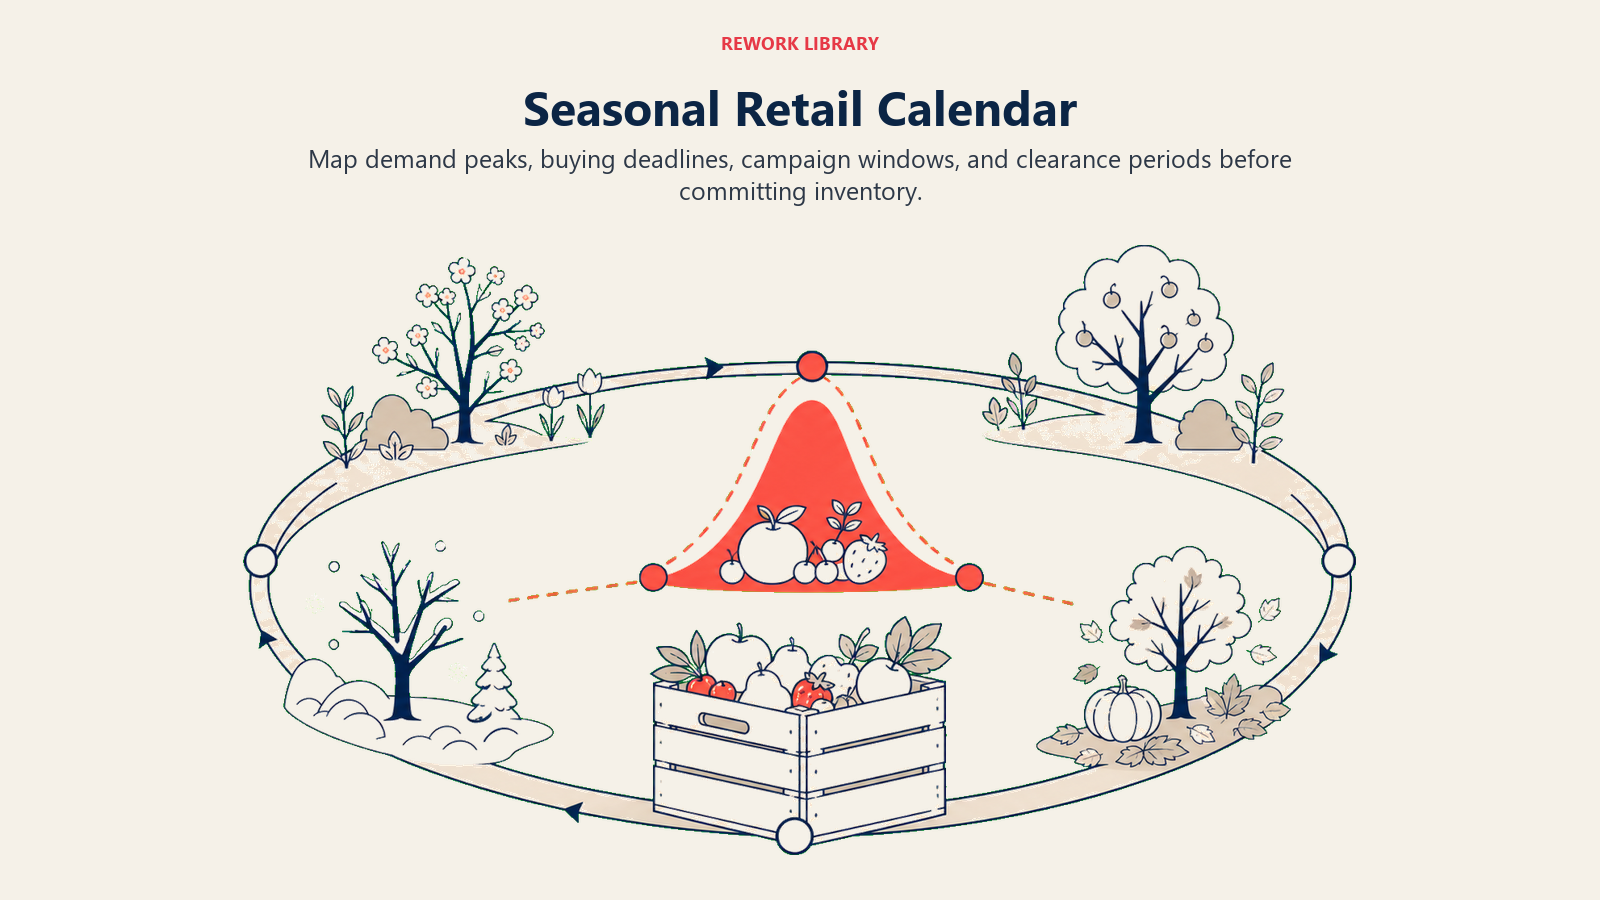
Seasonal Calendar Fundamentals
Every e-commerce business has a seasonal calendar, whether you've documented it or not. The key? Identifying your specific peaks and building a planning framework around them.
Major Commercial Seasons
Start with the universal retail calendar:
- Q1: New Year/Resolution season, Valentine's Day, Presidents Day
- Q2: Easter, Mother's Day, Memorial Day, graduation season
- Q3: Back-to-school, Labor Day, early fall preparation
- Q4: Halloween, Black Friday/Cyber Monday, holiday shopping, New Year's Eve But these are just starting points. Your actual seasonal calendar depends on your product category and customer base.
Industry-Specific Peaks
Different industries have different rhythms:
- Fashion: Spring/Summer collections (Feb-Mar), Fall/Winter collections (Aug-Sep)
- Home & Garden: Spring planting (Mar-May), fall decorating (Sep-Oct)
- Fitness: January resolution season, pre-summer (Apr-May)
- Toys: September through December (80% of annual revenue)
- Electronics: Back-to-school (Aug), holiday (Nov-Dec), post-holiday clearance
Map your historical sales data to identify your specific peaks. You're looking for patterns that repeat year over year.
Regional and Weather-Based Variations
Geography creates micro-seasons within your business:
- Sunscreen sells in Florida year-round but peaks in June in Minnesota
- Snow equipment moves in October in Denver, December in Boston
- Hurricane supplies spike regionally based on storm predictions
- Air conditioners sell March-May in the South, May-July in the North
If you serve multiple regions, segment your seasonal planning accordingly. You can't apply a one-size-fits-all approach to geographically diverse markets.
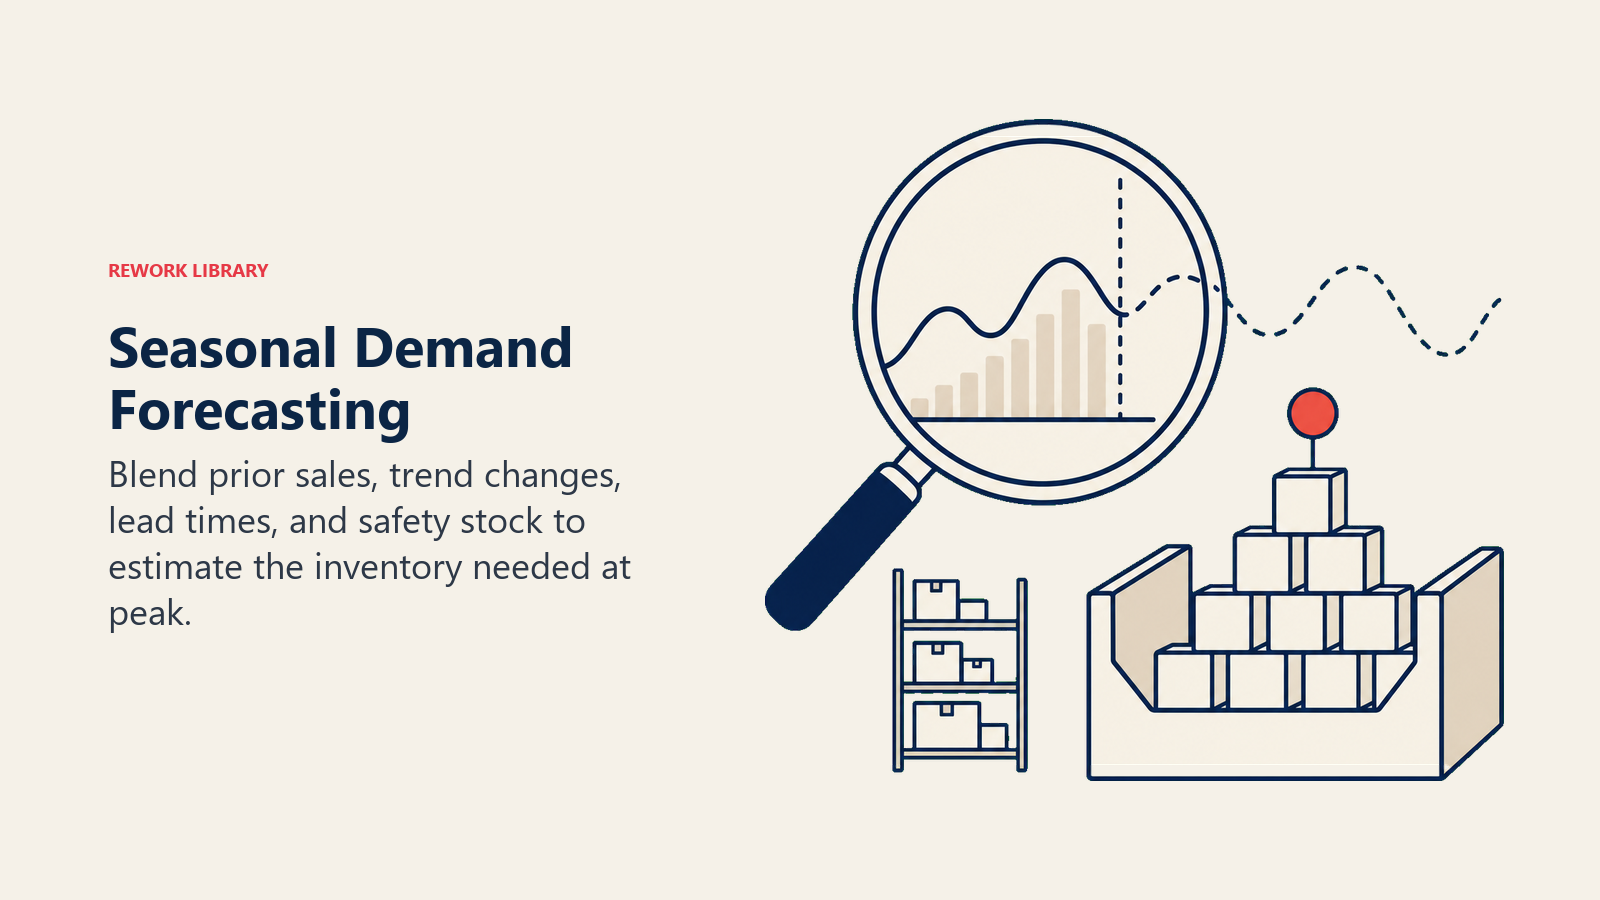
Demand Forecasting for Seasonal Products
Accurate demand forecasting is the foundation of seasonal success. You need to predict not just what will sell, but when and in what quantities.
Historical Data Analysis
Start with your own performance data:
- Sales by week for the past 2-3 years
- Year-over-year growth rates by product category
- Peak demand dates and duration
- Sell-through rates by product line Look for patterns:
Example: Valentine's Day Analysis
Week -4: 5% of seasonal revenue
Week -3: 12% of seasonal revenue
Week -2: 28% of seasonal revenue
Week -1: 35% of seasonal revenue
Week of: 20% of seasonal revenue
Total season: 6 weeks
Peak week: 7 days before Valentine's Day
This tells you not just how much to stock, but when demand accelerates and peaks.
External Data Points
Your historical data doesn't exist in isolation. Layer in external factors:
- Economic indicators: Consumer confidence, unemployment rates, inflation
- Weather patterns: Long-range forecasts for temperature-sensitive products
- Trend data: Google Trends, social media mentions, influencer activity
- Competitive intelligence: New product launches, major campaigns
A cold winter forecast might increase demand for outerwear by 15-20%. A viral TikTok trend can multiply demand overnight. Build flexibility into your forecast.
Forecasting Formula
A simple but effective approach:
Base Forecast = Last Year's Sales × (1 + Growth Rate)
Adjusted Forecast = Base Forecast × Trend Factor × Economic Factor
Safety Stock = Adjusted Forecast × 0.15-0.25
Total Order = Adjusted Forecast + Safety Stock
Example calculation:
Last year's Valentine's Day sales: 1,000 units
Annual growth rate: 20%
Base forecast: 1,000 × 1.20 = 1,200 units
Trend factor: 1.10 (product gaining traction)
Adjusted forecast: 1,200 × 1.10 = 1,320 units
Safety stock (20%): 264 units
Total order: 1,584 units
This gives you a data-driven starting point. Adjust based on qualitative factors and risk tolerance.
Inventory Planning & Purchasing
Forecasting tells you what to buy. Strategic inventory management tells you when and how much to order given real-world constraints.
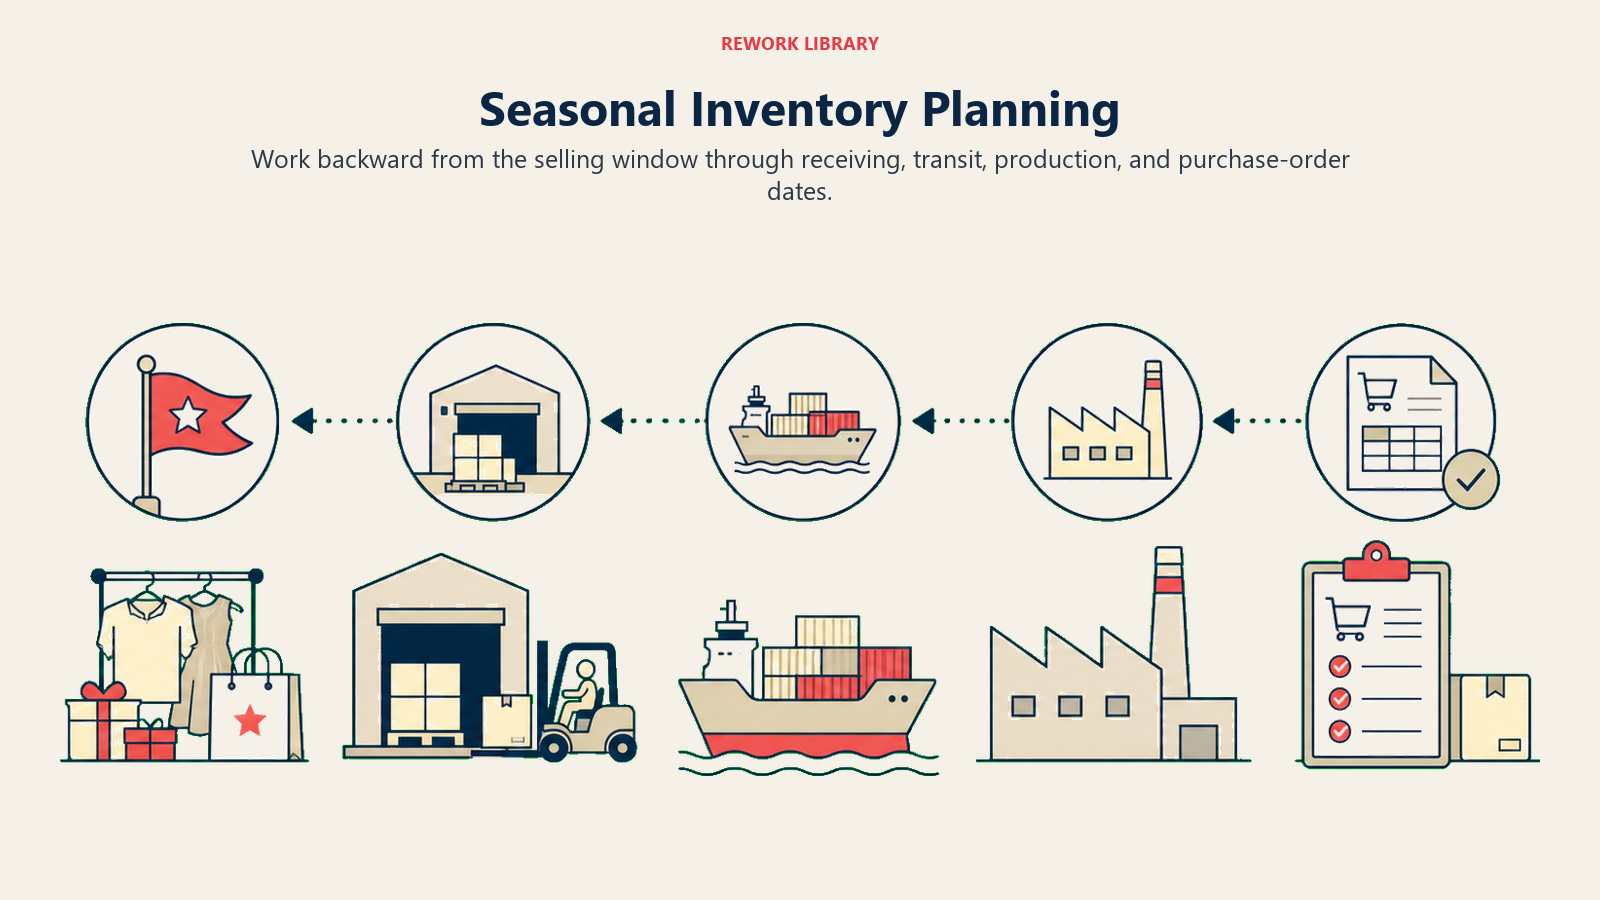
Lead Time Mapping
Work backward from your peak demand date:
- Manufacturing time: 30-90 days for custom products
- Shipping time: 15-45 days depending on origin and method
- Customs clearance: 3-10 days for international shipments
- Warehouse receiving: 2-5 days
- Quality control: 1-3 days Add buffer time for delays. A product that needs to be in stock by November 1st might require an order placed in July.
Optimal Order Quantities
Balance carrying costs against stockout risk:
For high-margin, fast-moving items: Order aggressively. The cost of a stockout exceeds the cost of modest overstock.
For low-margin, slow-moving items: Order conservatively. You can't afford deep discounting on clearance.
For trend-driven products: Order in multiple waves. Place an initial conservative order, then reorder based on early response.
Buffer Stock Strategy
Safety stock prevents stockouts during demand spikes:
- Critical products: 25-30% buffer
- Standard products: 15-20% buffer
- Nice-to-have products: 10-15% buffer
The buffer percentage increases with:
- Forecast uncertainty
- Lead time length
- Cost of stockouts
- Product profitability
Monitor sell-through rates weekly during peak season using your e-commerce metrics and KPIs. If you're burning through inventory faster than expected, you need emergency reorders or allocation strategies.
Product Mix Strategy
Not all seasonal products are created equal. Your mix should include heroes, supporting players, and fill-ins.
Seasonal Heroes
These are your peak-season MVPs, the products that drive 60-70% of seasonal revenue. They get:
- Deepest inventory investment
- Primary marketing focus
- Premium placement on site
- First reorder priority if selling fast
Identify heroes through historical data. They typically have high margins, broad appeal, and strong conversion rates.
Supporting Products
These complement your heroes and increase average order value. Think:
- Accessories for your hero products
- Lower price point alternatives
- Coordinating items for bundling
- Gift-with-purchase options
Supporting products need less inventory depth but should be in stock throughout the season. Running out of a $15 accessory can kill a $75 hero product sale.
Fill-In Products
These round out your assortment and serve niche needs:
- Size/color variations
- Alternative styles
- Budget-conscious options
- Specialty items for specific customer segments
Order conservatively on fill-ins. They're nice to have but not critical to seasonal success.
Developing product research and validation processes helps you identify which products will become heroes versus fill-ins before you invest heavily in inventory.
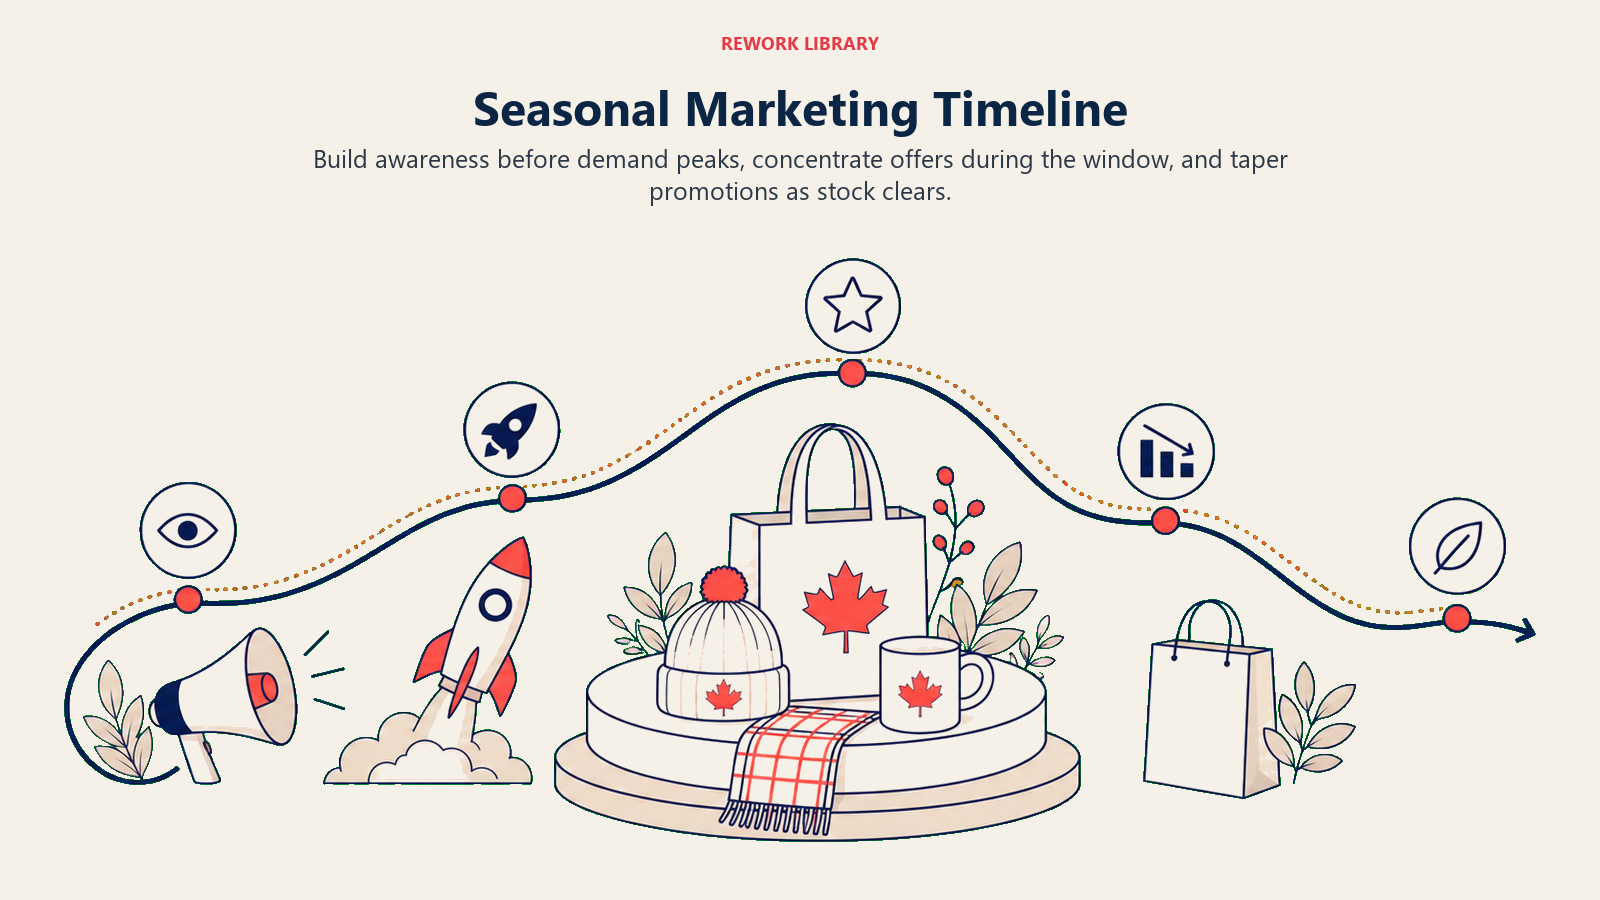
Marketing Timing & Promotion Strategy
Great inventory planning means nothing if customers don't know you're ready. Your seasonal promotional strategy and marketing calendar should align precisely with your seasonal peaks.
Pre-Season Awareness (8-12 Weeks Out)
Start building anticipation early:
- Content marketing around seasonal themes
- Email list growth campaigns
- Social media teasers
- Influencer partnerships and seeding
- SEO optimization for seasonal keywords You're not selling hard yet, you're positioning yourself in customers' minds before they're ready to buy.
Early Bird Phase (4-6 Weeks Out)
Reward early shoppers and smooth demand:
- Early access sales for email subscribers
- Pre-order campaigns with incentives
- Limited-time early bird discounts
- Gift guide content
- Retargeting campaigns begin
Early sales help you gauge demand and make last-minute inventory adjustments. They also spread fulfillment load across a longer window.
Peak Season Execution (2 Weeks Before Through Event)
This is game time:
- Maximum ad spend during high-intent windows
- Daily email campaigns
- Flash sales to create urgency
- Social proof (testimonials, user content)
- Countdown timers and scarcity messaging
- Live chat support for peak traffic
Your Email Marketing for E-commerce efforts should intensify during this window with segmented campaigns targeting different customer behaviors.
Post-Peak Conversion (Week After Event)
Don't go dark the moment the calendar flips:
- "Missed it?" recovery campaigns
- Last chance messaging
- Alternative product suggestions
- Gift card promotions
Many customers procrastinate or decide last-minute. Post-peak campaigns can capture 10-15% additional revenue.
Budget Allocation
Spread your marketing budget to match customer journey:
- 15% pre-season awareness
- 25% early bird phase
- 50% peak season
- 10% post-peak recovery
Adjust based on your customer behavior patterns and CAC during different phases. Your traffic acquisition strategy should scale up significantly during peak windows while maintaining baseline spend year-round.
Clearance & Inventory Management
Even perfect planning leaves residual inventory. Your clearance strategy protects margins and frees cash for the next season.
End-of-Season Timing
Start clearance while there's still residual demand:
- Seasonal peaks: Begin clearance 1-2 weeks after peak
- Fashion seasons: Start when new collection launches
- Holiday items: January 1st for holiday, day after for specific events Don't wait until demand evaporates. Strategic early clearance sells more at better margins than desperate late clearance.
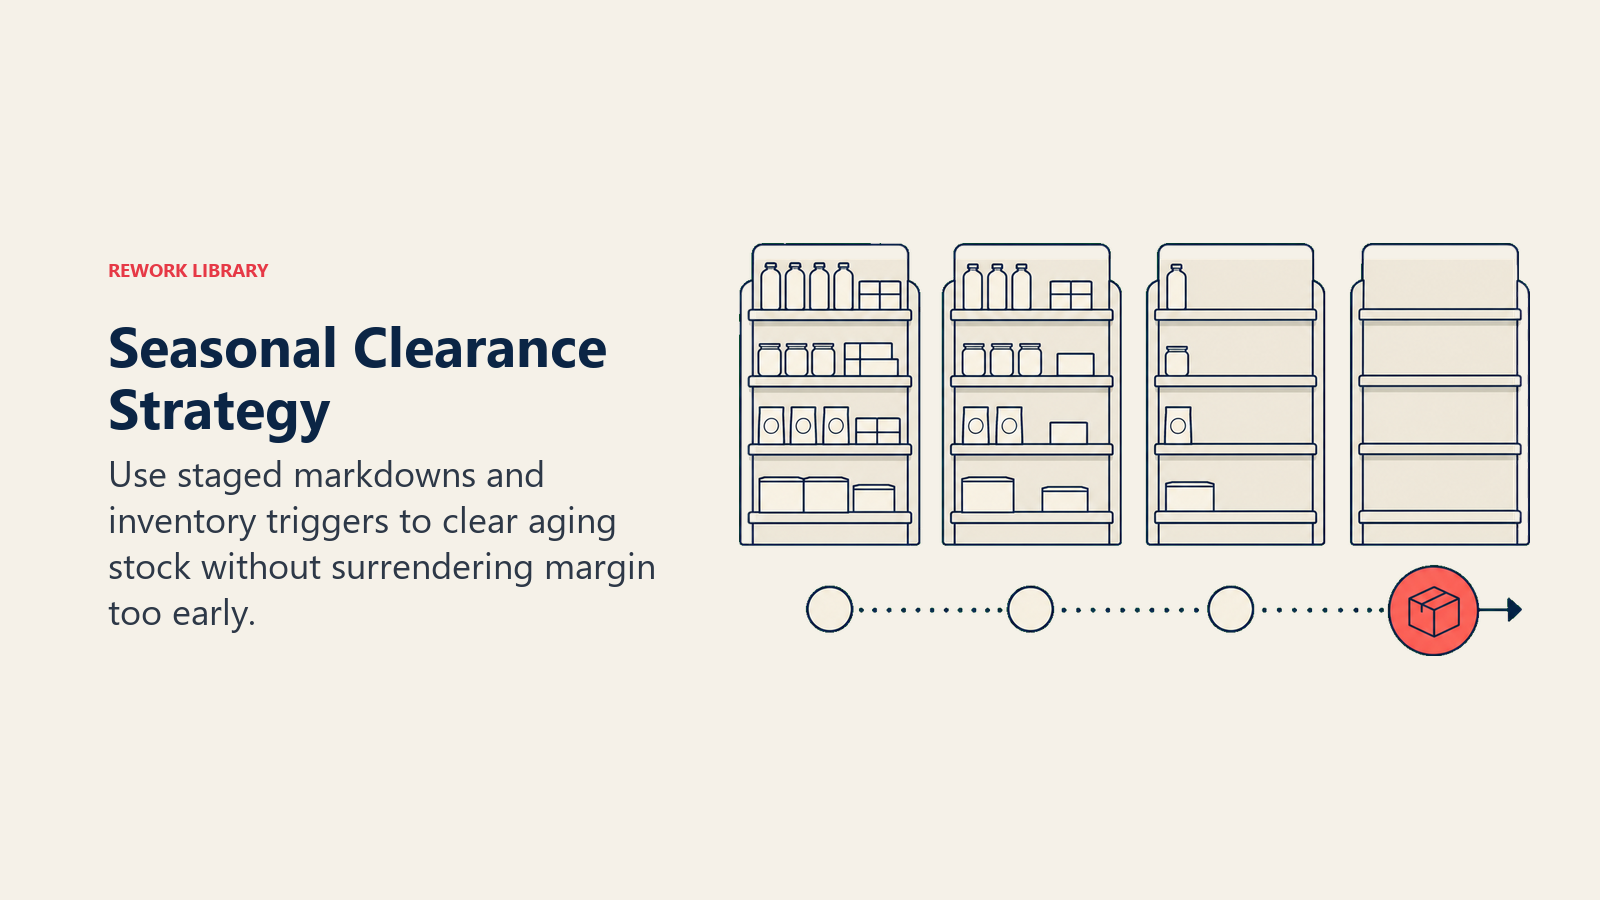
Markdown Progression
Use graduated discounts to maximize revenue:
Week 1-2: 15-20% off (captures deal-seekers while maintaining margin) Week 3-4: 25-35% off (moves volume, still acceptable margin) Week 5-6: 40-50% off (accelerates clearance) Week 7+: 60-75% off (liquidation, just clear it out)
Monitor sell-through at each level. If inventory moves quickly at 25% off, don't automatically jump to 50%.
Your pricing strategy and optimization framework applies here, protect margin while moving inventory through strategic markdowns.
Alternative Clearance Channels
Don't limit yourself to on-site clearance:
- Flash sale sites: Zulily, Gilt, Rue La La (bulk offload)
- Amazon/eBay: Different customer base, accepts lower margins
- Outlet section: Dedicated clearance area on your site
- Bundle with new season: "Last season's style + new season item"
- Donation: Tax write-off for unsellable inventory
Each channel has different economics. Flash sale sites take 40-50% commission but move volume fast. Your own clearance section preserves brand control but requires marketing effort.
Evergreen Product Balance
Seasonal spikes are exciting, but sustainable businesses balance seasonal and year-round revenue.
Core Product Strategy
Identify products that sell consistently regardless of season:
- Basic essentials in your category
- Consumables requiring regular repurchase
- Products solving evergreen problems
- Items suitable for year-round gifting
Allocate 40-60% of your inventory investment to these core products. They provide cash flow during seasonal valleys and require less promotional support.
Year-Round Marketing Mix
Don't let evergreen products starve during seasonal pushes:
- Maintain baseline ad spend on core products
- Create seasonal applications for evergreen items
- Use evergreen products for customer acquisition
- Bundle seasonal and evergreen items
A cookware company might push pumpkin-themed products in fall, but year-round basics like chef's knives fund operations during slow months.
Subscription Models
Convert seasonal buyers to year-round customers:
- Post-seasonal subscription offers
- Quarterly delivery of seasonal favorites
- Mix-and-match subscription boxes
- Membership programs with seasonal perks
A customer who buys Christmas decorations once a year might subscribe to a quarterly home decor box if the offer is right.
Balance seasonal excitement with evergreen stability. The goal is predictable baseline revenue with seasonal spikes on top.
Technology & Systems
Managing seasonal complexity manually doesn't scale. The right tools provide visibility and automation.
Inventory Management Systems
Modern IMS platforms handle:
- Multi-channel inventory tracking
- Automated reorder points
- Demand forecasting algorithms
- Purchase order management
- Warehouse integration
Look for systems that handle seasonal patterns, not just average demand. You need forecasting tools that recognize December isn't like July.
Popular options: Cin7, Ordoro, Skubana, NetSuite for enterprise scale.
Demand Planning Software
Dedicated forecasting tools analyze:
- Historical sales patterns
- Seasonal trends and cycles
- External data integration
- Scenario planning
- Forecast accuracy tracking
These systems get smarter over time, learning your specific seasonal patterns and improving predictions.
Real-Time Dashboards
During peak season, you need minute-by-minute visibility:
- Current vs. forecasted sales
- Inventory levels by product
- Fulfillment capacity utilization
- Ad spend and ROAS
- Cash position
Create a seasonal command center dashboard that shows critical metrics at a glance. When things move fast, you can't wait for weekly reports.
Consider how your seasonal planning integrates with your fulfillment strategy, especially during peak periods when warehouse capacity becomes constrained and shipping timelines tighten.
Seasonal Content Creation
Great seasonal campaigns require content created well in advance. The timeline's longer than you think.
Content Lead Times
Work backward from launch:
- Photography/videography: 8-12 weeks before season
- Graphic design: 6-8 weeks before season
- Copy and content writing: 6-8 weeks before season
- Email campaign setup: 4 weeks before season
- Social media calendaring: 4 weeks before season
- Website updates: 2-3 weeks before season
Holiday content created in November is too late. You should be shooting holiday creative in August.
Social Media Calendar
Map seasonal content across platforms:
- Instagram: Lifestyle imagery, user content, stories
- TikTok: Trend-jacking, behind-scenes, how-to content
- Pinterest: Inspiration boards, gift guides (start 3-4 months early)
- Facebook: Community engagement, longer-form content
- Email: Product highlights, exclusive offers, guides
Create a master calendar showing all content pieces, their creation dates, approval deadlines, and publish dates.
Influencer Coordination
Influencer partnerships need even longer lead times:
- Identification and outreach: 12-16 weeks before
- Contract negotiation: 10-12 weeks before
- Product seeding: 8-10 weeks before
- Content creation: 6-8 weeks before
- Review and approval: 4-6 weeks before
- Publication: Aligned with campaign launch
Factor in the influencer's own content calendar. The best creators book months in advance.
Build promotional campaigns that leverage your email marketing for e-commerce capabilities to nurture customers through the entire seasonal journey, from early awareness to post-season retention.
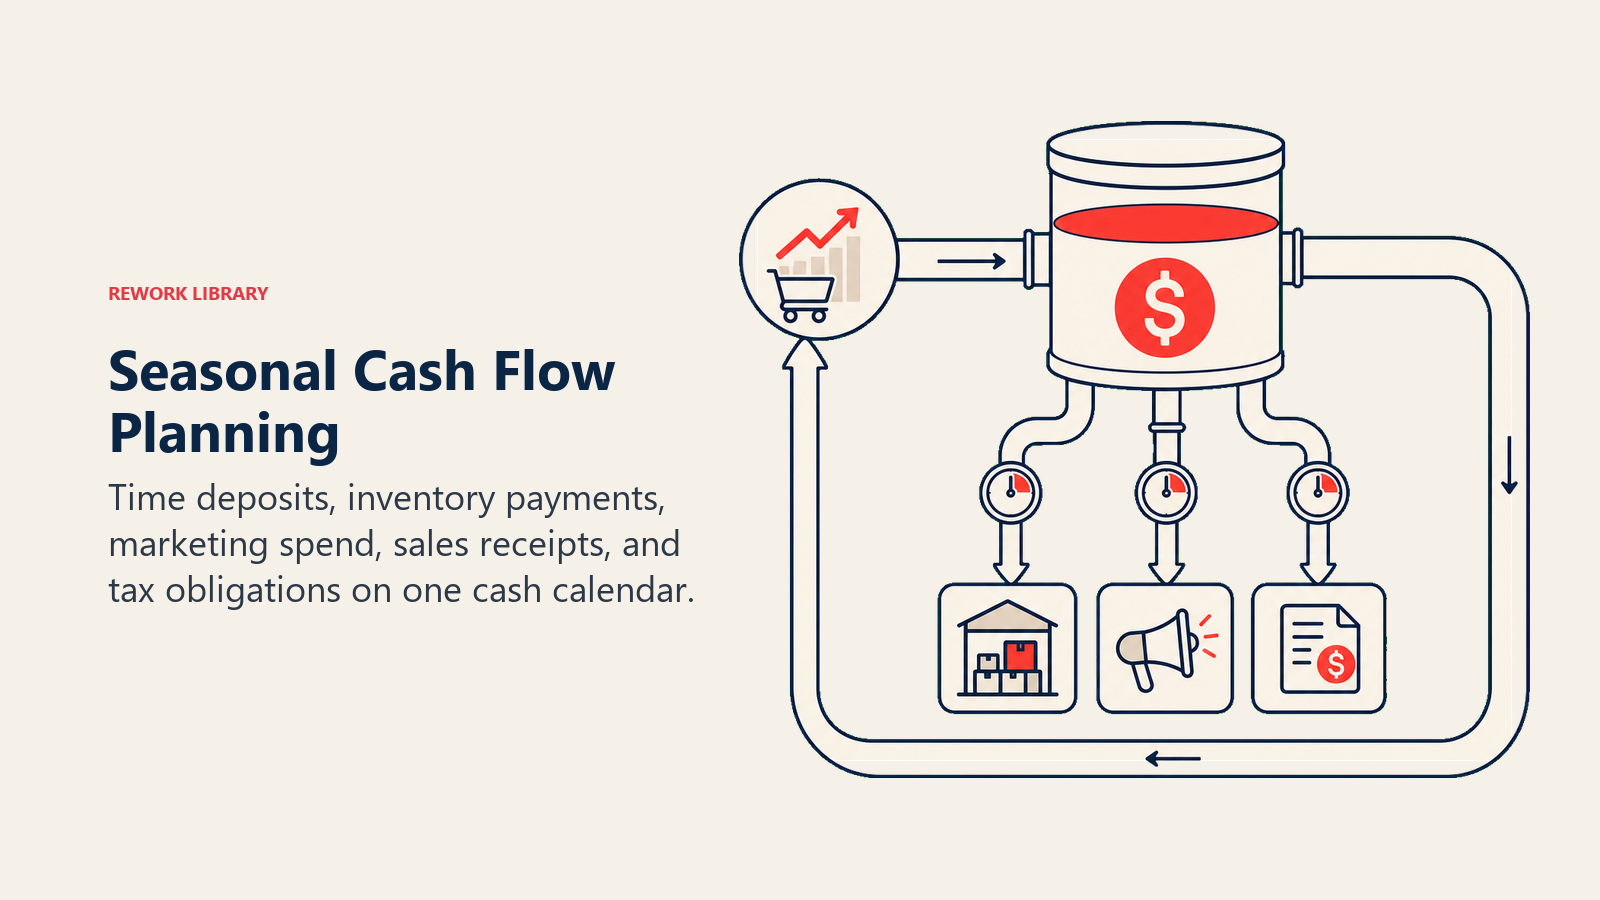
Cash Flow Management
Seasonal businesses face unique cash flow challenges. Revenue concentrates in narrow windows while expenses spread across the year.
Working Capital Requirements
Calculate seasonal cash needs:
Example: Q4 Holiday Season
Inventory purchase (Sep): $200,000
Marketing spend (Oct-Dec): $75,000
Additional staffing (Nov-Dec): $25,000
Total cash outlay: $300,000
Revenue received (Nov-Jan): $500,000
Gross margin (60%): $300,000
Net seasonal profit: $0 (breakeven after initial investment)
The real profit comes in later seasons when initial inventory investment is behind you. But year one requires significant capital.
Payment Terms Strategy
Negotiate favorable terms to ease cash pressure:
- Suppliers: Request 60-90 day terms instead of 30
- Manufacturers: Negotiate deposits vs. full prepayment
- Marketing platforms: Use credit cards for 30-day float
- Seasonal lines of credit: Establish before you need them
A 60-day payment term on a $200,000 inventory order means you might sell product before paying for it. Massive cash flow advantage.
Financing Options
Bridge seasonal cash gaps through:
- Business line of credit: Flexible, pay only when used
- Invoice factoring: Immediate cash for receivables
- Inventory financing: Lenders advance against inventory
- Seasonal small business loans: Structured for peak-season needs
Secure financing in your slow season when you don't need it. Lenders prefer lending to businesses not in crisis.
Integrate your seasonal cash planning with ongoing monitoring of e-commerce metrics and KPIs to ensure cash flow remains healthy throughout the seasonal cycle.
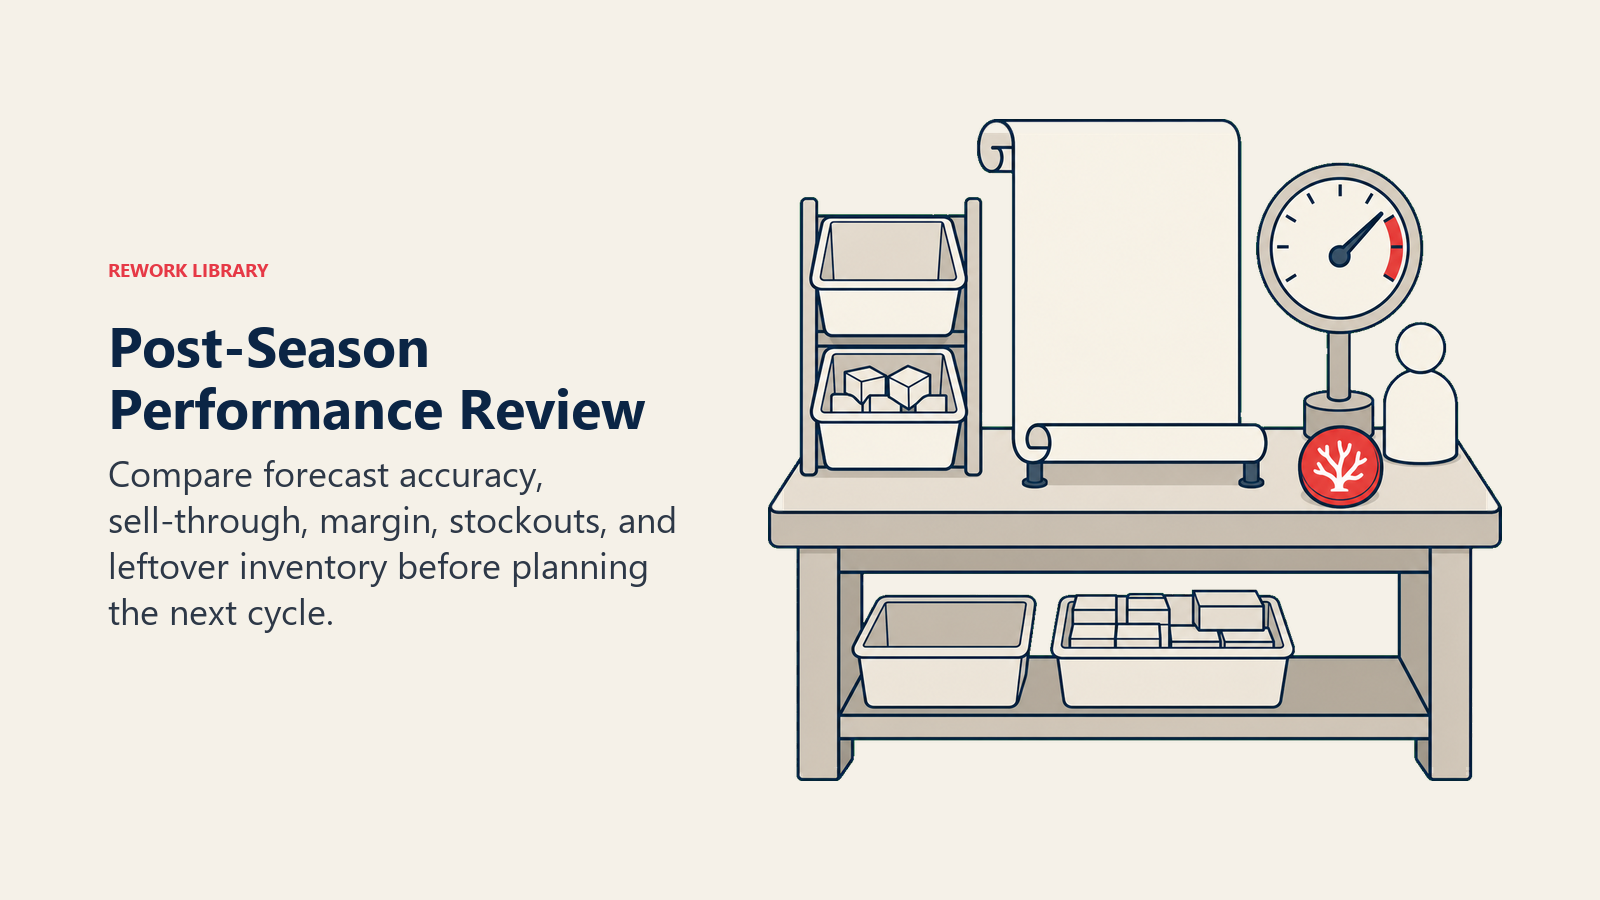
Post-Season Analysis
The season doesn't end when sales stop. Your post-mortem determines next year's success.
Sales Performance Analysis
Dig into the numbers:
- Actual vs. forecasted sales by product
- Sell-through rates by category
- Stockouts and lost sales estimates
- Excess inventory by SKU
- Revenue by channel and campaign
- Customer acquisition cost by source
- Lifetime value of seasonal customers Create a scorecard rating forecast accuracy:
Product A: Forecasted 1,000, sold 1,200 (+20% miss)
Product B: Forecasted 500, sold 450 (-10% miss)
Product C: Forecasted 800, sold 200 (-75% miss - major overstock)
Products with large misses need investigation. What assumptions were wrong?
Forecast Accuracy Review
Calculate your forecast accuracy:
Forecast Accuracy = 1 - (|Actual - Forecast| / Forecast)

Example:
Forecast: 10,000 units
Actual: 11,500 units
Accuracy = 1 - (1,500 / 10,000) = 85%
Target 80%+ accuracy. Below 70% indicates forecasting methodology problems.
Track accuracy over time. Your third year planning the same season should be significantly more accurate than year one.
Operational Learning
Document what worked and what didn't:
- Fulfillment capacity and bottlenecks
- Customer service volume and issues
- Website performance under traffic
- Marketing channel effectiveness
- Supplier reliability and quality
- Content performance by type
Create a "next year playbook" while details are fresh. Future you will thank current you.
Planning Adjustments
Update your seasonal playbook:
- Revised forecast models
- Updated inventory safety stock levels
- Modified marketing budget allocation
- Adjusted content creation timelines
- Supplier changes
- Process improvements
Each season should be better than the last. The learning loop is what separates good seasonal operators from great ones.
Building Your Seasonal System
Seasonal planning isn't a one-time project. It's an operational rhythm you refine over time.
Start with your most important season. Build a comprehensive plan including forecast, inventory, marketing timeline, and cash flow projection. Execute it, measure results, and improve.
Then apply the same framework to your next seasonal peak. Over 2-3 years, you'll have a complete seasonal calendar with proven playbooks for each peak.
The businesses that dominate seasonal selling aren't lucky. They're prepared. They see the calendar as opportunity, not chaos. They plan in advance, execute with precision, and continuously improve.
Your next seasonal peak is an opportunity to capture significant revenue growth. The question is whether you'll be ready when customers are.
The planning starts now.
Related Resources
- Inventory Management - Core inventory principles and systems
- Product Launch Strategy - Launch planning framework applicable to seasons
- Pricing Strategy for E-commerce - Margin protection during seasonal periods
- Holiday & Seasonal Promotions - Specific holiday campaign tactics
- Product Bundling - Increasing AOV during peak seasons
- Discount Strategy - Clearance pricing and markdown management
- Product Line Expansion - Adding seasonal products strategically
- Email Marketing for E-commerce - Email campaign execution during peaks

Senior Operations & Growth Strategist
On this page
- Why Seasonal Planning Matters
- Seasonal Calendar Fundamentals
- Major Commercial Seasons
- Industry-Specific Peaks
- Regional and Weather-Based Variations
- Demand Forecasting for Seasonal Products
- Historical Data Analysis
- External Data Points
- Forecasting Formula
- Inventory Planning & Purchasing
- Lead Time Mapping
- Optimal Order Quantities
- Buffer Stock Strategy
- Product Mix Strategy
- Seasonal Heroes
- Supporting Products
- Fill-In Products
- Marketing Timing & Promotion Strategy
- Pre-Season Awareness (8-12 Weeks Out)
- Early Bird Phase (4-6 Weeks Out)
- Peak Season Execution (2 Weeks Before Through Event)
- Post-Peak Conversion (Week After Event)
- Budget Allocation
- Clearance & Inventory Management
- End-of-Season Timing
- Markdown Progression
- Alternative Clearance Channels
- Evergreen Product Balance
- Core Product Strategy
- Year-Round Marketing Mix
- Subscription Models
- Technology & Systems
- Inventory Management Systems
- Demand Planning Software
- Real-Time Dashboards
- Seasonal Content Creation
- Content Lead Times
- Social Media Calendar
- Influencer Coordination
- Cash Flow Management
- Working Capital Requirements
- Payment Terms Strategy
- Financing Options
- Post-Season Analysis
- Sales Performance Analysis
- Forecast Accuracy Review
- Operational Learning
- Planning Adjustments
- Building Your Seasonal System
- Related Resources