A/B Testing Framework: Systematic Experimentation for E-commerce Growth
Turn this article into takeaways for your work.
Each assistant summarizes the article only for you and suggests best practices for your work.
Most e-commerce decisions are made on gut feeling, past experience, or what competitors are doing. A/B testing changes that by turning assumptions into data-backed decisions. The difference between a store that tests systematically and one that doesn't can mean 20-30% higher conversion rates over time.
The stores winning in e-commerce aren't necessarily spending more on marketing or having better products. They're testing relentlessly, learning from every experiment, and compounding small improvements into serious growth. This framework shows you how to build that capability through systematic conversion rate optimization.
Why A/B Testing Matters in E-commerce
Every change you make to your store carries risk. A new checkout design might increase conversions by 15% or tank them by 20%. Without testing, you're gambling. With testing, you're making informed bets backed by data. The cost of untested changes is real. A mid-sized e-commerce store processing $500K monthly might lose $50K-100K in a single month from a well-intentioned but unvalidated redesign. Testing protects against these losses while systematically finding wins.
Typical lift ranges from systematic testing:
- Homepage and category page optimization: 5-15% conversion lift
- Product page improvements: 10-25% lift in add-to-cart rates
- Checkout flow refinements: 8-20% completion rate improvement
- Pricing and promotion tests: 3-12% revenue per visitor increase
- Email and messaging tests: 15-40% open and click-through rate gains
The ROI of a mature testing program typically ranges from 5:1 to 20:1. For every dollar invested in testing infrastructure and resources, stores see $5-20 in incremental revenue. The key word is "mature", it doesn't happen overnight.
What separates high-performing testing programs:
- Testing velocity: 8-12 tests per quarter minimum
- Win rate: 20-30% of tests produce statistically significant improvements
- Implementation speed: Winners rolled out within 1-2 weeks
- Learning documentation: Every test documented, wins and losses
- Cross-functional buy-in: Testing embedded in product development
The real value isn't individual test wins. It's the accumulated knowledge about what works for your specific customers, built experiment by experiment. This compounding insight becomes a competitive moat that's hard to replicate. Tracking the right e-commerce metrics and KPIs ensures you're measuring what matters most.
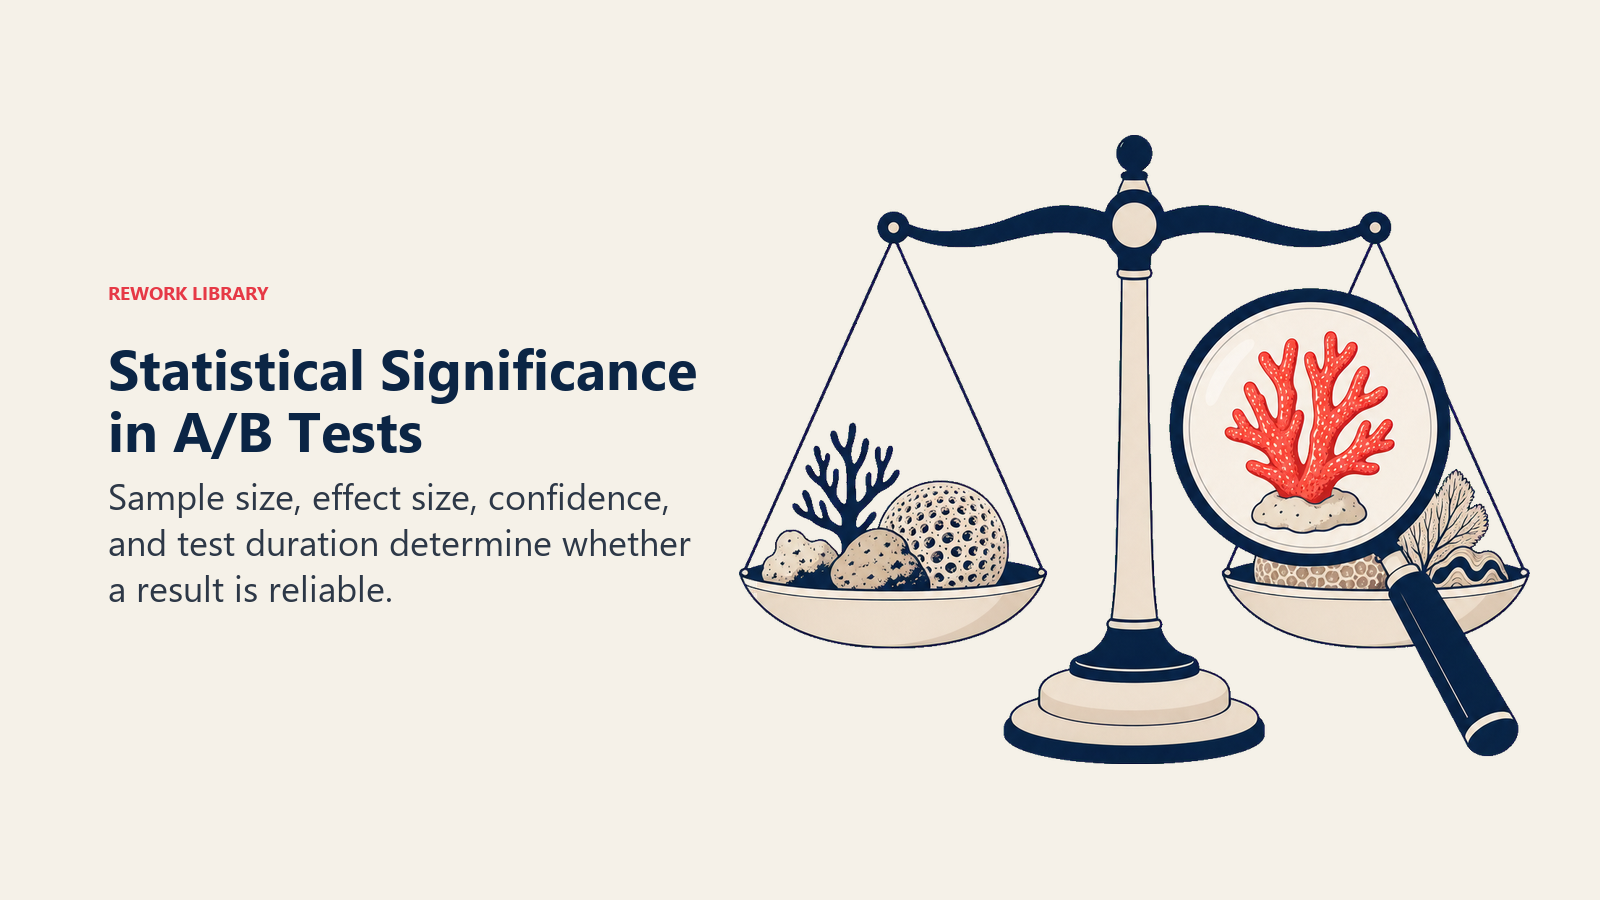
Statistical Foundations & Significance
Understanding the statistics behind A/B testing isn't academic, it prevents costly mistakes and helps you trust your results. You don't need a PhD, but you do need the fundamentals. Hypothesis structure: Every test starts with a hypothesis containing three elements: the change you're making, the metric you expect to move, and by how much. "Changing the CTA button from 'Buy Now' to 'Add to Cart' will increase add-to-cart rate by at least 10%." The null hypothesis assumes no difference exists between variants. The alternative hypothesis claims a difference does exist. Your test either rejects the null hypothesis (finding a significant difference) or fails to reject it (no conclusive difference found). Sample size calculation: Sample size determines how long you need to run a test. The formula considers four inputs:
- Baseline conversion rate (current performance)
- Minimum detectable effect (smallest improvement worth detecting)
- Statistical power (typically 80%, meaning 80% chance of detecting true effects)
- Significance level (typically 95%, meaning 5% chance of false positives)
For a checkout page with 2% baseline conversion, detecting a 10% relative improvement (2.0% to 2.2%) at 95% confidence requires approximately 38,000 visitors per variant, or 76,000 total visitors.
Higher baseline rates need less traffic. A homepage with 15% engagement rate needs only 4,800 visitors per variant to detect a 10% lift. This is why testing high-traffic, low-conversion pages often requires patience.
Confidence levels explained: 95% confidence means if you ran this test 100 times, 95 times you'd see similar results. The remaining 5% are false positives, you detected a difference that doesn't actually exist.
Some teams use 90% confidence for rapid iteration and 99% confidence for major changes like pricing or checkout redesigns. The tradeoff is speed versus certainty. Lower confidence gets answers faster but accepts more false positives.
Common statistical pitfalls:
Peeking problem: Checking results before reaching sample size inflates false positive rates dramatically. Looking at results daily when you need 30 days to reach sample size can bump false positives from 5% to 20-25%. Use sequential testing calculators if you must monitor progress.
Multiple testing: Running five different tests simultaneously, each at 95% confidence, means roughly 23% chance at least one shows a false positive. Adjust significance thresholds (Bonferroni correction) or limit how many tests you run at once.
Segment drilling: Finding that your test "won" for mobile Android users in California after losing overall is almost always bogus. Pre-specify segments in your hypothesis or treat post-hoc segments as ideas for new tests.
Bayesian vs Frequentist approaches: Most tools use frequentist statistics, fixed sample sizes and binary outcomes (significant or not). Bayesian approaches provide probability distributions and allow continuous monitoring without peeking penalties.
Bayesian testing is better for businesses that need faster decisions and can accept probabilistic guidance ("78% likely this variant is better"). Frequentist testing is better for high-stakes decisions requiring clear yes/no answers with controlled error rates.
For most e-commerce testing, frequentist approaches work fine. Reserve Bayesian methods for advanced programs running 20+ tests quarterly.
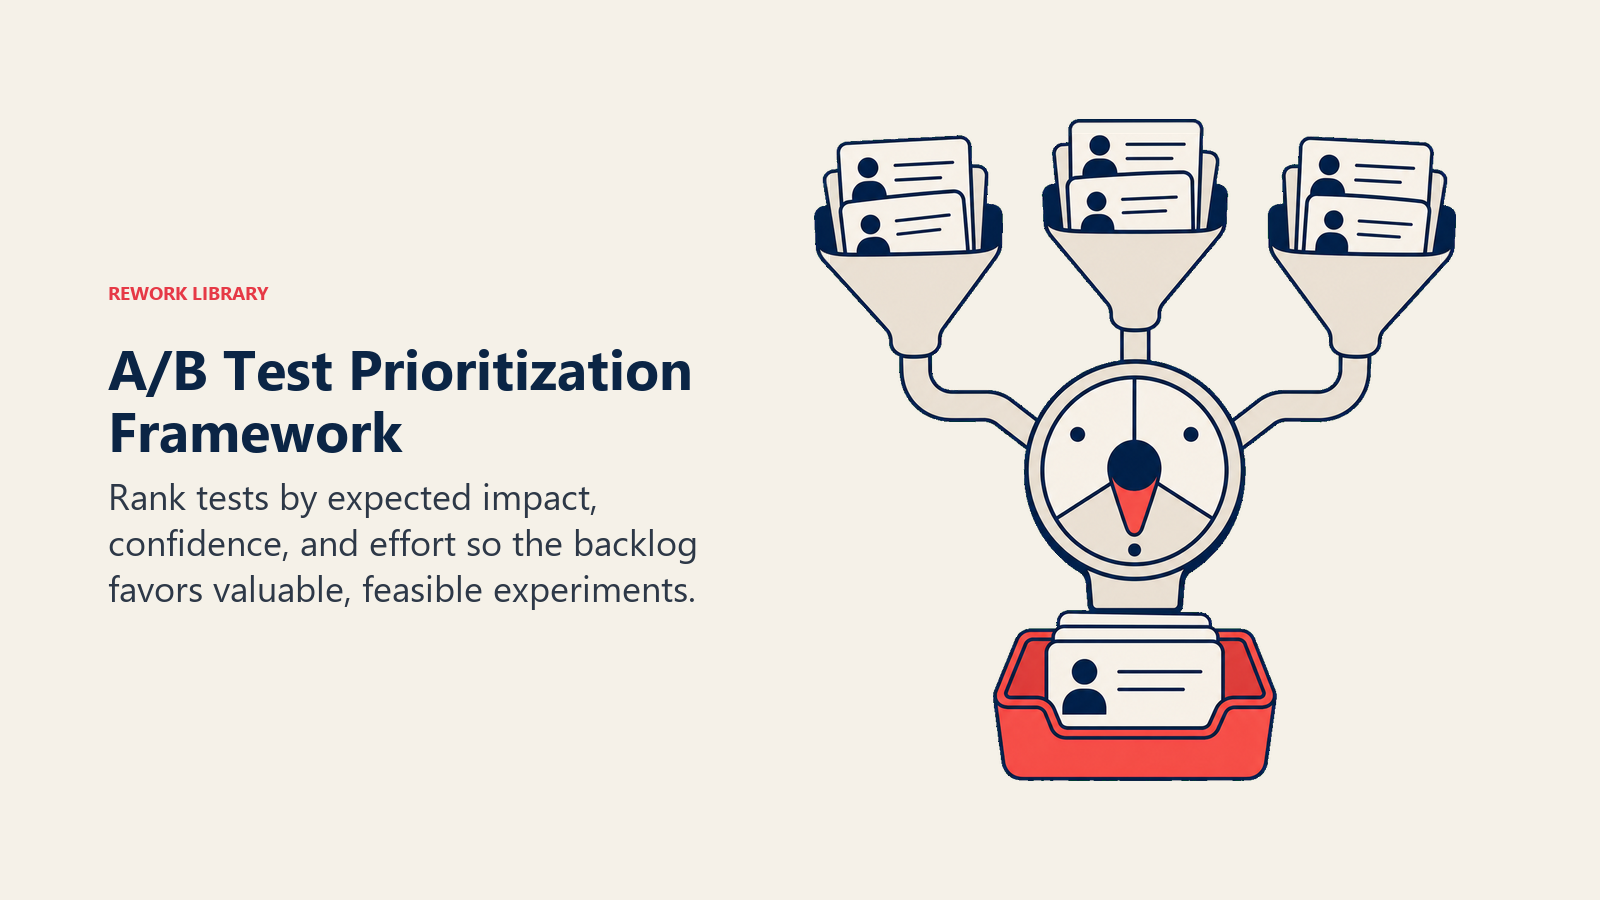
Test Prioritization Framework
You could test hundreds of elements. The question is what to test first. Prioritization frameworks prevent random testing and maximize ROI. Impact vs Effort Matrix: Plot potential tests on two axes: High Impact, Low Effort (do first):
- Changing CTA button text or color
- Adjusting product image size or count
- Adding trust badges near checkout
- Modifying shipping messaging
- Email subject line variations
High Impact, High Effort (plan carefully):
- Complete checkout redesign
- New product page layout
- Navigation restructure
- Personalization engine implementation
- Mobile app experience overhaul
Low Impact, Low Effort (do if resources permit):
- Footer link text changes
- About page layout tweaks
- Minor copy adjustments
- Icon style updates
Low Impact, High Effort (avoid):
- Custom illustration system
- Extensive brand guidelines
- Complex animation systems
Traffic requirements and time to significance: Calculate how long each test will take based on page traffic and baseline conversion rates. A product page with 10,000 monthly visitors testing a 15% baseline metric needs roughly 2-3 weeks to detect a 10% lift. A checkout page with 1,000 monthly visitors might need 2-3 months.
Prioritize tests that reach significance quickly early in your program. This builds momentum and gets executives on board. As your program matures, tackle longer-running tests on lower-traffic pages.
Seasonality considerations: Avoid testing during peak seasons unless you have enormous traffic. Black Friday isn't the time to test a new checkout flow, traffic patterns, customer behavior, and promotional context all differ dramatically from normal periods.
Run tests during "normal" periods that represent typical customer behavior. If your business is highly seasonal (summer apparel, holiday decorations), you might need to test within seasons and re-validate across different periods.
Dependencies and sequential testing strategy: Some tests must run before others. Test homepage messaging before testing the product pages visitors land on. Optimize your checkout flow before testing individual form field designs within it.
Build a testing roadmap with:
- Foundation tests (high-traffic, high-impact pages)
- Conversion funnel tests (homepage → product → cart → checkout sequence)
- Refinement tests (individual elements within optimized pages)
- Personalization tests (segment-specific variations)
This sequential approach ensures each test builds on validated learnings instead of optimizing a broken foundation.
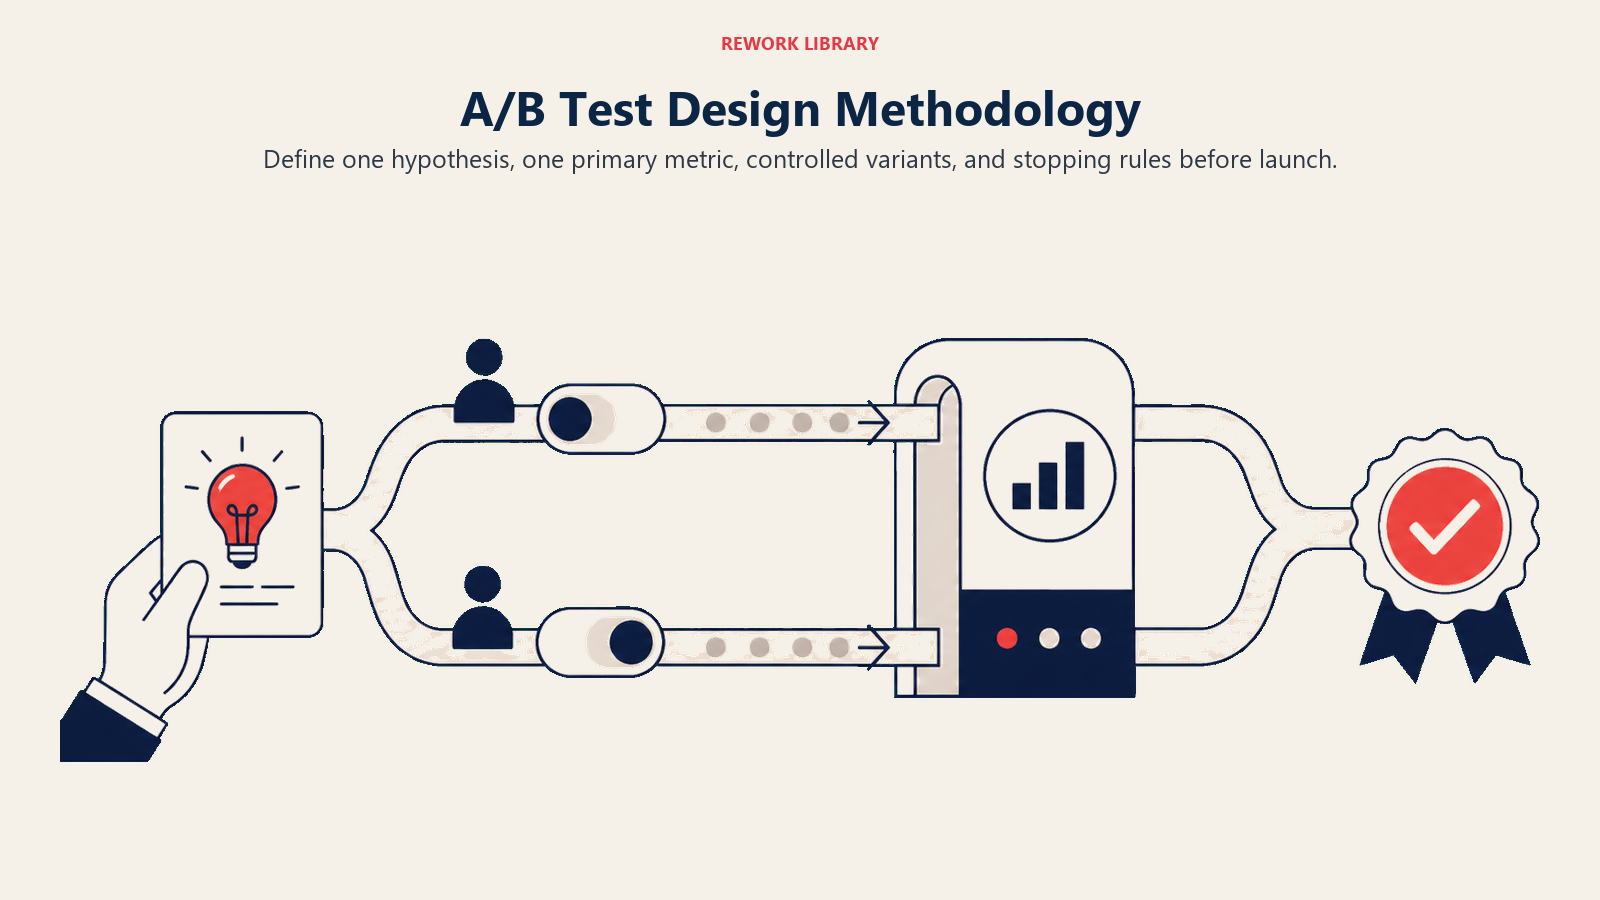
Testing Methodology & Design
How you structure a test matters as much as what you test. Poor methodology invalidates results, no matter how rigorous your statistics. Single-variable vs Multivariate: A/B tests compare two versions changing one element. A/B/n tests compare multiple variants (A/B/C/D). Multivariate tests combine multiple changes to identify interactions between elements. Start with single-variable tests. They're simpler to interpret and require less traffic. A product page test changing only the hero image provides clear learning. A multivariate test changing image, headline, bullet points, and CTA simultaneously requires 10-20x more traffic and muddies the learnings.
Reserve multivariate testing for mature programs with substantial traffic (500K+ monthly visitors) and when you specifically need to understand how elements interact.
Control group design: Your control should represent the current experience, not an idealized version. If your current checkout has six form fields, don't clean up bugs or improve copy in the control while testing a five-field variant. Fix bugs in both variants or neither.
Hold the control constant across tests when possible. If you validated a new homepage in January, use that as the control for February homepage tests. This creates a consistent baseline and compounds improvements.
Sample splitting and traffic allocation: 50/50 splits work for most tests. Occasionally use 90/10 or 80/20 when testing potentially risky changes, you limit downside exposure while still gathering data.
Traffic should split randomly, not based on day of week, time of day, or user characteristics (unless testing personalization specifically). Random assignment ensures variants differ only in the element you're testing, not underlying customer composition.
Holdout groups for long-term impact: For major changes, consider a permanent holdout group receiving the old experience. This 5-10% holdout lets you measure long-term effects (do customers who experienced the new checkout return more? Spend more over time?) that short-term tests miss.
Holdouts are most valuable for foundational changes like navigation redesigns, pricing strategy shifts, or loyalty program launches. Skip them for tactical tests like button color or headline variants. Understanding customer lifetime value helps determine whether changes improve long-term profitability beyond just initial conversion lifts.
Test duration and seasonal variations: Run tests for at least one full week to capture weekday and weekend behavior differences. Two weeks is better, capturing potential paycheck cycle effects. Go longer for low-traffic pages or when measuring nuanced metrics.
Stop tests once you reach sample size, not when you see a result you like. Extend tests if external factors intervene (site outage, unexpected PR spike, major competitor event).
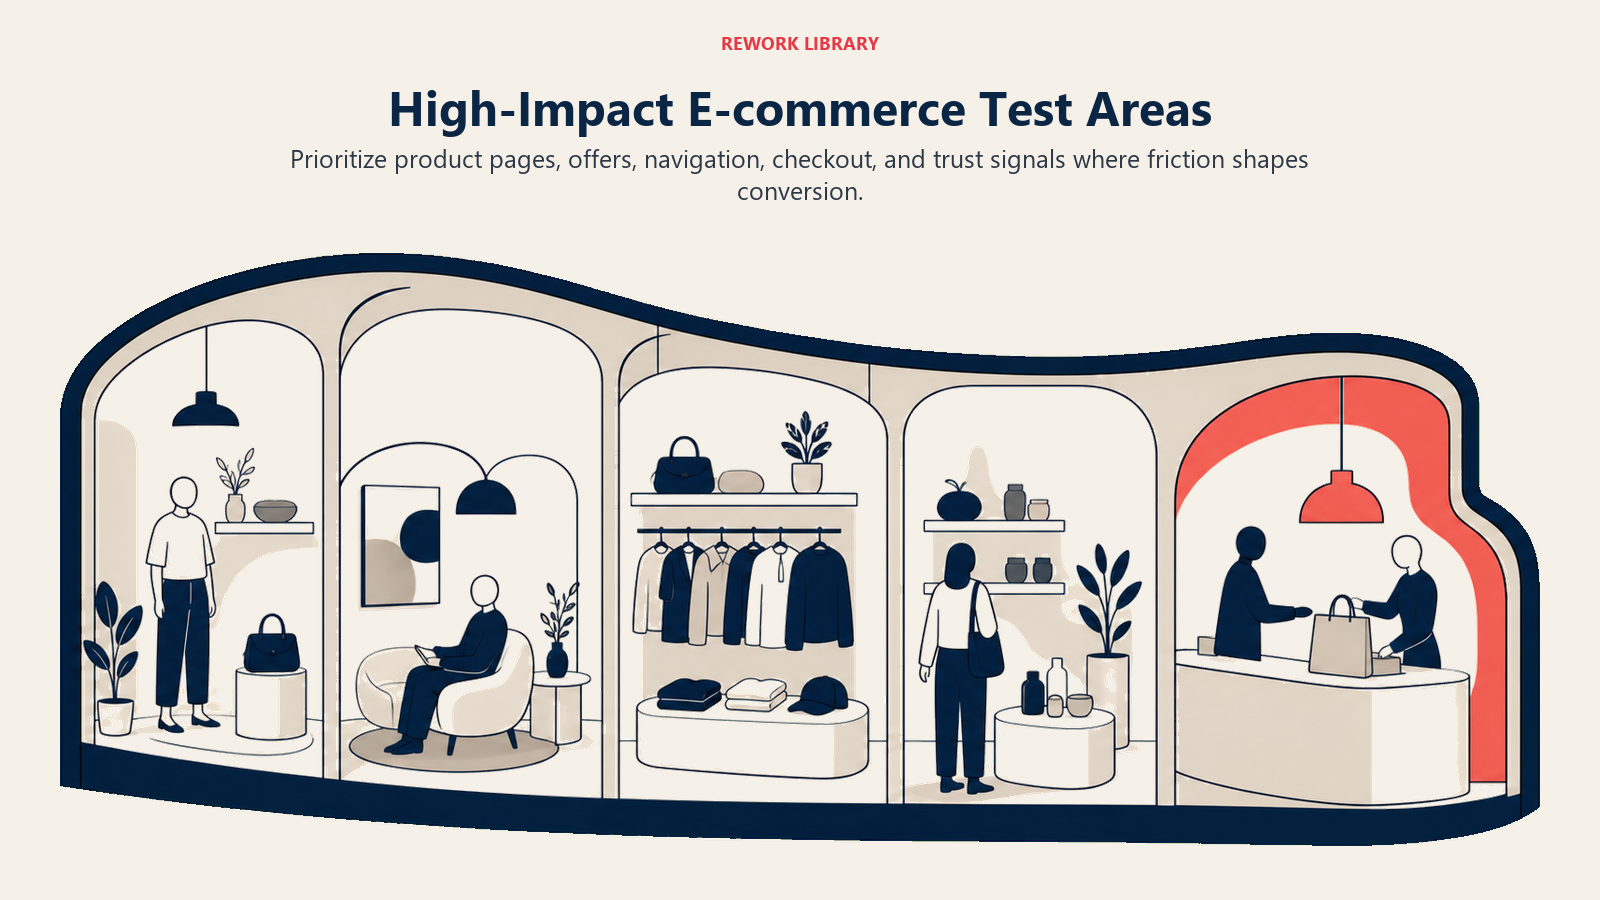
Key Areas for Testing
Certain areas consistently provide outsized returns from testing. Focus your early efforts here. Product page optimization: Product pages are conversion engines. Small improvements compound across hundreds or thousands of SKUs. Test priorities:
- Hero image count and layout (single large, multiple angles, lifestyle context)
- Image zoom and gallery functionality
- Product description structure and length
- Bullet point count, order, and formatting
- Review placement and prominence
- CTA button text, color, and position
- Shipping and return messaging placement
- Size and variant selection interface
A fashion retailer increased conversions 18% by testing lifestyle images in the hero position versus product-only shots. A home goods store lifted add-to-cart rate 12% by moving shipping information above the fold. These changes cost nothing to implement but you need testing to validate them.
Learn more about systematic product page optimization approaches.
Checkout flow variations: Checkout abandonment averages 70% across e-commerce. Each percentage point recovered translates directly to revenue.
High-impact tests:
- Single-page vs multi-step checkout
- Guest checkout vs required account creation
- Form field count and order
- Progress indicators and step labels
- Payment method display and order
- Shipping option presentation
- Trust badge placement
- Cart summary visibility
A software company reduced checkout abandonment 22% by moving from three steps to a single-page flow. An apparel retailer had the opposite result, a clear multi-step process outperformed single-page by 8%. Your customers dictate the winner. Checkout flow optimization requires systematic testing, not best practices.
Pricing and promotional testing: Pricing tests are high-stakes, high-reward. A 5% price change can swing revenue 15-20% depending on your elasticity.
Test approaches:
- Price point variations for new products
- Discount presentation (% off vs dollar amount)
- Free shipping thresholds
- Bundle pricing and configurations
- Tiered pricing structures
- Promotional urgency messaging
- Reference pricing display
Test pricing in controlled segments before company-wide rollouts. A B2B supplier tested 8%, 10%, and 12% price increases on new customers only, finding 10% was the sweet spot, meaningful revenue lift without harming conversion. Testing saved them from leaving money on the table or overpricing themselves out of deals.
Explore systematic pricing strategy optimization development.
Messaging and value propositions: How you describe your value determines who converts. Small messaging shifts resonate differently with different segments.
Test variations:
- Primary headline focus (product features vs customer benefits vs emotional outcomes)
- Subheadline supporting evidence
- Above-fold value proposition placement
- Category page positioning statements
- Email subject lines and preview text
- Ad copy and landing page message match
A SaaS company testing "Save 10 hours per week" against "Automate your busywork" found the time-saving message converted 23% better. A wellness brand found emotional outcome messaging ("Feel energized every morning") beat functional benefits ("Contains 500mg vitamin B12") by 16%.
Navigation and UI testing: Navigation determines whether customers find products. UI patterns determine whether the experience feels intuitive or frustrating.
Test priorities:
- Mega menu vs standard dropdown navigation
- Search bar prominence and functionality
- Category organization and naming
- Filter and sort option availability
- Mobile menu structure
- Sticky navigation vs scrolling
- Breadcrumb implementation
An outdoor retailer increased product discovery 31% by testing activity-based navigation ("Camping," "Hiking," "Climbing") against product-type navigation ("Tents," "Boots," "Backpacks"). Customer mental models matter more than internal product categorization.
Traffic and channel-specific tests: Different channels bring different customer intent. What works for paid search might fail for organic social.
Channel-specific tests:
- Landing page variants for paid traffic
- Email promotional structures
- Social proof elements for cold traffic
- Returning customer vs new customer experiences
- Mobile-specific layouts and flows
A home decor brand found social traffic converted 43% better with highly visual, minimal-text product pages while search traffic preferred detailed descriptions and specifications. One-size-fits-all experiences don't work as well as customized approaches. Effective customer segmentation helps you tailor experiences based on behavior and preferences.
Tools & Technology Stack
Choosing the right tools balances functionality, ease of use, and cost. Your first tool won't be your last, mature programs graduate to more sophisticated platforms.
Specialized A/B testing platforms:
Optimizely (Enterprise, $50K-300K+ annually): Full-featured experimentation platform with visual editor, multivariate testing, personalization engine, and robust statistical engine. Best for large retailers with dedicated optimization teams.
VWO (Mid-market, $1K-10K+ monthly): Visual editor, heatmaps, session recordings, and surveys in addition to testing. Good balance of features and cost for growing stores doing 10-20 tests annually.
Convert (Small business, $700-2K+ monthly): Lightweight platform focusing on testing essentials with privacy compliance built-in. Works well for stores beginning systematic testing programs.
Google Optimize (Discontinued 2023): Free tool integrated with Google Analytics, now sunset. Shows the risk of free tools, they disappear. Budget for proper testing infrastructure.
Built-in platform features:
Shopify: Theme experiments available on Shopify Plus ($2K+ monthly) for homepage and template testing. Limited to theme-level changes, not individual elements.
WooCommerce: Requires third-party plugins like Nelio A/B Testing ($200-400 annually) or integration with external platforms.
BigCommerce: Partners with Optimizely and Google Optimize (when active). No native testing capability.
Magento: Adobe Target integration for Adobe Commerce Cloud ($30K+ annually). Complex setup requiring developer resources.
Analytics integration requirements: Your testing tool must share data with your analytics platform. Track micro-conversions (add-to-cart, wishlist additions, email signups) and macro-conversions (purchases, revenue) in both systems.
Set up proper analytics and tracking infrastructure before launching tests. You can't measure what you don't track.
Statistical calculators and validators: Use external calculators to validate tool outputs, especially for critical decisions:
- Evan Miller's A/B test calculator (free, reliable)
- Optimizely's sample size calculator
- VWO's A/B test duration calculator
- Adobe's confidence calculator
Cross-check significant results with secondary calculations. Tools occasionally miscalculate, especially for small sample sizes or unusual baseline rates.
Dashboard and reporting requirements: Build dashboards tracking:
- Tests in progress and time to completion
- Completed test results and implementation status
- Win rate and average lift per winning test
- Total incremental revenue from testing program
- Cost per test and ROI calculations
Share monthly summaries with stakeholders. Transparency builds support and resources for expanded testing.
Tag management considerations: Use Google Tag Manager, Adobe Launch, or similar tools to deploy test variations without needing developers for every change. This can accelerate testing velocity from 2-3 tests per quarter to 10-15 tests.
Tag management also enables quick rollback if tests cause technical issues. One-click removal beats emergency developer deployments.
Implementation Best Practices
Execution determines whether your carefully designed test produces valid results or garbage data. Define clear success metrics: Every test needs exactly one primary metric. Add secondary metrics for context, but don't cherry-pick winners based on whichever metric looks best.
Primary metric examples:
- Product page tests: Add-to-cart rate
- Checkout tests: Completion rate
- Homepage tests: Product page click-through rate
- Pricing tests: Revenue per visitor (not just conversion rate)
Secondary metrics provide guardrails. A product page variant increasing add-to-cart 15% but decreasing actual purchases 8% is a loser, not a winner. The full funnel matters.
Establish baseline and minimum detectable effect: Run your site for 1-2 weeks measuring current performance before testing. This baseline informs sample size calculations and provides context for results.
Define your minimum detectable effect (MDE), the smallest improvement worth implementing. For high-effort changes, you might need 10-15% lift to justify development costs. For low-effort changes, 3-5% lift is worth capturing.
MDE affects sample size. Detecting 5% lifts requires 4x the traffic of detecting 10% lifts. Balance statistical ambition with practical timelines.
QA and validation process: Before launching tests:
- Load both variants in multiple browsers (Chrome, Safari, Firefox, Edge)
- Test on mobile devices (iOS Safari, Android Chrome)
- Verify tracking fires correctly in analytics
- Check page speed impact of testing scripts
- Confirm variants display correctly at multiple screen sizes
- Test form submissions and transaction completion
A single hour of QA prevents invalid tests that waste weeks of traffic. An electronics retailer ran a checkout test for three weeks before discovering the variant broke Apple Pay, invalidating all mobile results. Make sure site speed and performance is validated for both control and variant groups.
Segment-specific considerations: Test effects often vary by segment. Plan segment analysis in advance:
- Device type (mobile vs desktop vs tablet)
- Traffic source (organic, paid, email, social)
- Customer type (new vs returning)
- Geographic region
- Product category
Pre-specify 2-3 critical segments. Post-hoc segment analysis is hypothesis generation, not validation.
Device and browser compatibility: Variants must function identically across devices. A product gallery working beautifully on desktop but broken on mobile invalidates results.
Pay special attention to:
- Touch vs click interactions
- Hover states (non-existent on mobile)
- Screen size responsive breakpoints
- Browser-specific CSS or JavaScript quirks
- Payment method compatibility (Apple Pay, Google Pay, PayPal)
Mobile vs desktop testing: Mobile behavior differs fundamentally from desktop. Attention spans are shorter, interaction patterns differ, and context varies.
Consider separate tests for mobile and desktop rather than assuming one experience works for both. A furniture retailer found lifestyle-heavy product pages won on mobile (browse mode) while specification-heavy pages won on desktop (research mode).
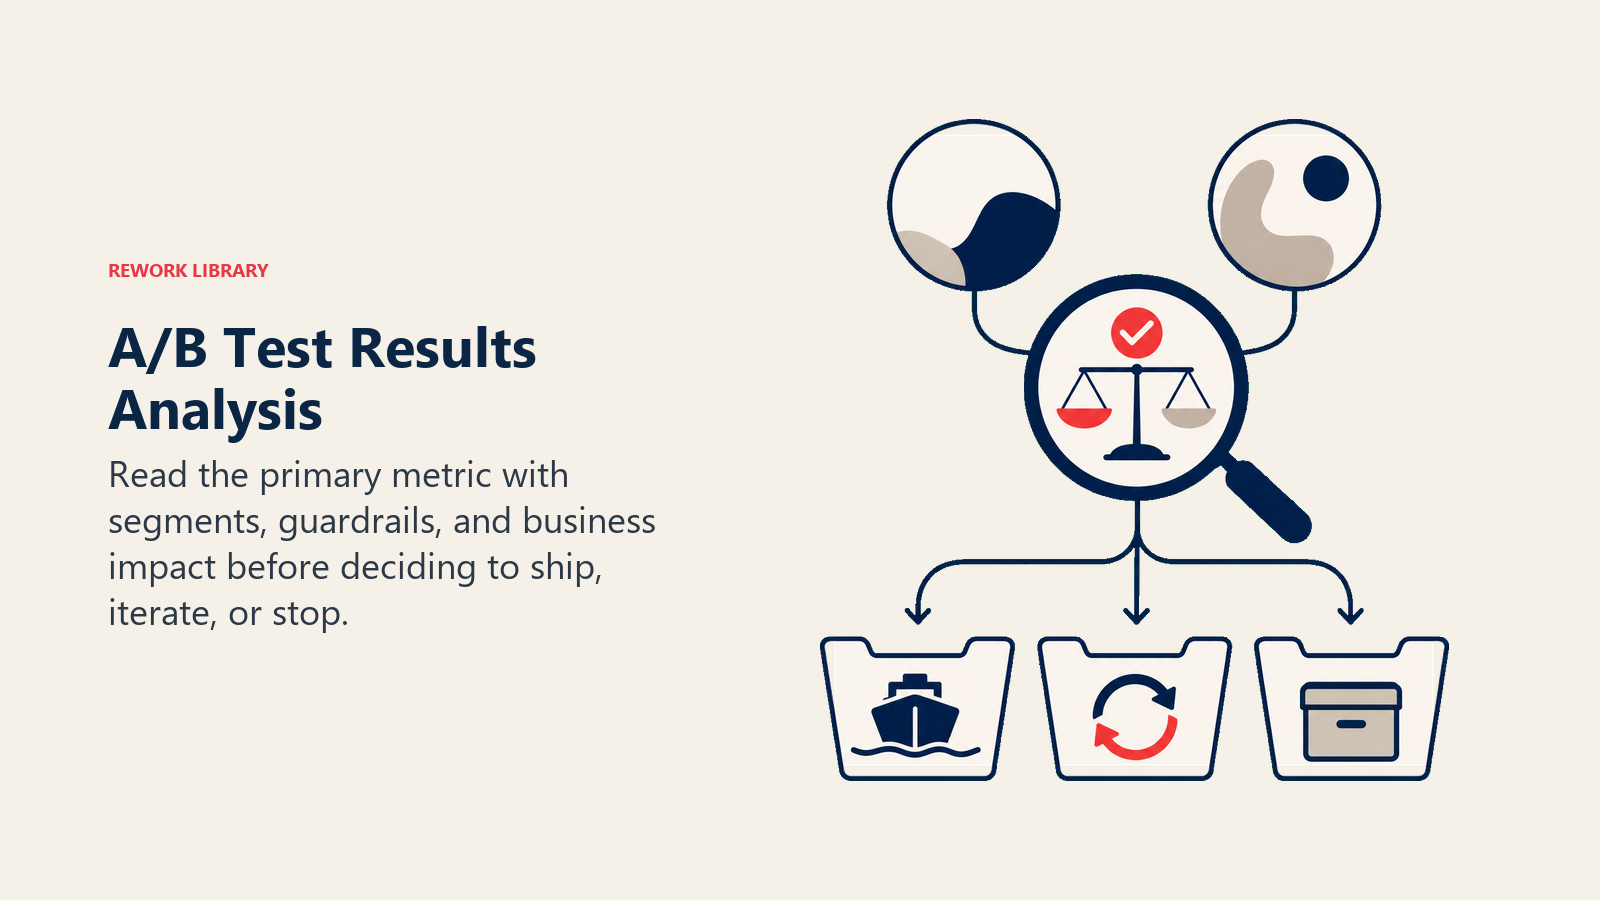
Analyzing Results & Action Items
Getting results is one thing. Correctly interpreting and acting on them is another. Reading statistical outputs: Your testing tool provides several key numbers: Conversion rates: Control at 2.3%, variant at 2.6% means a 13% relative improvement (0.3 / 2.3 = 13%). Confidence interval: "95% CI: +5% to +22%" means you're 95% confident the true lift falls between 5% and 22%. Wide intervals suggest you need more data.
P-value: Below 0.05 (for 95% confidence) means the difference is statistically significant. Above 0.05 means inconclusive, you can't rule out random chance.
Probability to beat baseline: Bayesian metric showing likelihood the variant outperforms control. Above 95% typically triggers implementation.
Statistical vs practical significance: A test can be statistically significant but practically worthless. Testing two homepage headlines might show variant B wins at 99.9% confidence with a 0.8% improvement in click-through rate.
Statistically valid, yes. But 0.8% improvement on a metric two steps removed from revenue won't move the needle. Practical significance asks: "Is this improvement worth the effort to implement and maintain?"
Apply your minimum detectable effect threshold. If you set MDE at 5% and detected 1.5%, the test is a statistical win but a practical pass.
Quantifying lift and impact: Translate percentage improvements to business outcomes:
- Product page add-to-cart lift of 12% × 50,000 monthly visitors × 15% baseline rate × $85 average order value × 25% purchase rate = $19,125 monthly incremental revenue
- Checkout completion improvement of 8% × 5,000 monthly checkout starts × 45% baseline completion × $120 average order = $21,600 monthly incremental revenue
Show stakeholders dollar impact, not just percentage lifts. "This test will generate $258,000 additional annual revenue" gets resources allocated. "This test improved conversion 8%" gets a "nice job" email.
Handling inconclusive results: Most tests (60-70%) produce inconclusive results, no statistically significant difference detected. This isn't failure, it's learning.
Inconclusive results mean:
- Your hypothesis was wrong (the change doesn't matter)
- Your MDE was too aggressive (there might be a 2% lift but you needed 10% for significance)
- You need more time/traffic to detect smaller effects
- External factors introduced too much noise
Don't extend tests indefinitely chasing significance. Accept inconclusive results, document learnings, and move to the next test. Some teams re-test with larger changes after inconclusive results.
Handling negative results: Negative results, variant performs worse than control, teach as much as positive results. A drop of 10% at 95% confidence is valuable knowledge.
Document why you hypothesized the variant would win and why it lost. These "failure case studies" prevent repeating mistakes and build institutional knowledge. A beauty brand tested urgency messaging ("Only 3 left!") expecting increased conversions but saw a 14% drop, customers felt manipulated. That learning stopped similar mistakes across categories.
Rollout strategies: For winning tests:
Immediate full rollout (typical): Flip the switch, make the variant the new control, move to the next test.
Gradual rollout (for major changes): Roll out to 25% of traffic for one week, then 50%, then 75%, then 100%. This catches unexpected issues before full deployment.
Permanent holdout (for strategic changes): Keep 5% of traffic on the old experience indefinitely to measure long-term impact.
Implement winners within 1-2 weeks. The longer you delay, the more revenue you leave on the table. A validated improvement generating $20K monthly costs you $10K for every two-week delay.
Documentation standards: Create a testing repository tracking:
- Hypothesis and reasoning
- Design and variants tested
- Primary and secondary metrics
- Sample size and duration
- Results and statistical significance
- Business impact quantification
- Implementation status
- Key learnings
Use a spreadsheet, Notion database, or dedicated tool. The format matters less than consistent documentation. Future tests build on this institutional memory.
Continuous Testing Culture
The difference between companies that test occasionally and those with testing cultures is execution velocity and organizational commitment.
Embedding testing in processes: Testing shouldn't be a special project, it should be the default approach to changes. Before implementing any significant update, ask: "Should we test this?"
Build testing into:
- Product development (test new features before full rollout)
- Marketing campaigns (test messaging before scaling spend)
- Pricing changes (test in limited segments first)
- UX improvements (validate assumptions before investing heavily)
The question shouldn't be "Should we test?" But "Why wouldn't we test?"
Team structure and responsibilities: Small companies (under $5M revenue) typically assign testing to a marketing or growth lead spending 25-40% of their time on testing.
Mid-sized companies ($5M-50M) often hire a dedicated CRO specialist or growth product manager owning the testing roadmap.
Large companies ($50M+) build optimization teams with analysts, designers, and developers dedicated full-time to experimentation.
Regardless of size, establish a testing committee meeting monthly to review results, prioritize upcoming tests, and align on methodology.
Stakeholder alignment and buy-in: Testing fails when executives or product teams bypass the process, shipping changes without validation. Prevent this by:
- Sharing monthly testing summaries with leadership
- Quantifying dollar impact from testing program
- Involving stakeholders in hypothesis generation
- Running tests on their proposed changes (they become advocates when their tests win)
Show the cost of not testing. If a proposed redesign would reach 100,000 customers monthly and has a 30% chance of decreasing conversion 10%, the expected cost of skipping testing is $X,000 monthly (calculate based on your AOV). Testing removes that risk.
Testing velocity and portfolio approach: Mature programs run 8-15 tests quarterly across different areas:
- 40% high-confidence incremental improvements (likely wins)
- 40% uncertain tests with meaningful upside (moderate risk)
- 20% "moonshots" testing radically different approaches (high risk, high reward)
This portfolio balances consistent wins (building credibility and compounding gains) with big swings (hunting for 30-50% improvements that occasionally hit).
Track your win rate. If 80% of tests win, you're not being ambitious enough, test bigger changes. If 10% of tests win, you're testing too randomly, focus on validated improvement areas.
Learning from failures: Failed tests teach what doesn't matter, which is as valuable as learning what does. After 50 tests, you'll know your customers respond strongly to trust signals but don't care about design flourishes. That focus prevents wasted effort.
Build a "failed test" library with hypotheses that didn't pan out. Review it quarterly. Patterns emerge: "Our customers consistently don't respond to urgency messaging" or "Image quality matters more than image quantity" or "Simplified checkout always beats complex checkout."
These patterns become strategic advantages competitors lack.
Advanced Testing Techniques
Once your foundation is solid, advanced approaches unlock additional value.
Personalization and dynamic testing: Instead of serving everyone the same variant, serve different experiences based on customer attributes:
- First-time visitors see trust-building elements
- Returning customers see personalized product recommendations
- Cart abandoners see special offers
- High-value segments see premium products first
Personalization requires significantly more traffic (testing multiple variants across multiple segments) and sophisticated tools. Save this for mature programs with 500K+ monthly visitors.
Contextual experimentation: Test how changes perform in different contexts:
- Product availability (in-stock vs limited stock vs out-of-stock messaging)
- Promotional periods (normal pricing vs sales vs holiday events)
- Traffic sources (paid search landing pages vs organic social)
- Seasonal variations (summer vs winter for apparel)
Context-aware testing produces more nuanced learnings than one-size-fits-all approaches.
New vs existing customer testing: New and returning customers have different needs. New customers need education, trust-building, and clear value propositions. Returning customers need efficiency, personalization, and rewards.
Test separately for these segments. A home goods brand found new customers needed extensive product information and reviews while returning customers converted better with minimal content and quick reorder options.
Cross-device and cross-session challenges: Customers often research on mobile and purchase on desktop, or abandon cart on desktop and complete on mobile. Standard testing tools struggle with this.
Advanced implementations use user-level tracking (cookies, account IDs) to maintain consistent experiences across devices. This ensures a customer in the "variant" group sees the variant whether they're on mobile, desktop, or tablet.
For most programs, device-specific testing (mobile users always in mobile test, desktop users in desktop test) is simpler and sufficient.
Testing during peak periods: High-traffic periods (Black Friday, Cyber Monday, holiday season) create temptation to test. Don't do it.
Peak periods introduce massive noise, conversion rates, customer behavior, and traffic patterns all differ dramatically from normal periods. Tests run during peaks often don't replicate during normal periods.
Use peaks to gather baseline data for next year's pre-peak testing. Test your holiday checkout flow in October, not December.
International and localization testing: Selling across countries or languages requires testing cultural preferences. Color meanings, messaging tone, social proof types, and even layout preferences vary by culture.
A European fashion retailer found British customers responded to understated luxury messaging while German customers preferred technical specifications and quality certifications. One product page didn't work for both markets.
Test major markets independently when traffic allows. Use winning patterns from larger markets as hypotheses for smaller markets.
Common Testing Mistakes & Solutions
Learn from others' expensive mistakes. Statistical errors:
Running underpowered tests: Testing with insufficient traffic means you can't detect meaningful improvements. Calculate sample size before launching.
Solution: No test runs until sample size calculation confirms you can reach significance in a reasonable timeframe (4-6 weeks maximum).
Stopping tests early: Checking results daily and stopping when you see significance inflates false positives to 20-30% instead of 5%.
Solution: Set test duration based on sample size calculation and don't check results until completion. If you must monitor, use sequential testing calculators.
Multiple comparison problem: Testing four variants simultaneously without correction means 18% chance of false positive, not 5%.
Solution: Limit concurrent test count, adjust significance thresholds (divide by test count), or use Bayesian approaches that handle multiple variants better.
Business errors:
Testing the wrong metric: Optimizing click-through rate when you should optimize revenue per visitor leads to clicks that don't convert.
Solution: Define success metrics considering full-funnel impact and business outcomes, not just immediate engagement.
Ignoring context: Running tests during atypical periods (site outages, viral PR, supply shortages) produces results that don't generalize.
Solution: Pause tests during unusual events. Better to delay two weeks than waste weeks of traffic on invalid data.
Testing everything: Spreading testing resources across dozens of small improvements prevents achieving significance on anything meaningful.
Solution: Concentrate tests on high-impact areas. Three tests reaching significance beat ten inconclusive tests.
Implementation errors:
Broken variants: Variants with JavaScript errors, broken checkouts, or display issues invalidate results.
Solution: Mandatory QA checklist covering all browsers, devices, and critical user flows before launch.
Tracking issues: Analytics not firing correctly, conversion events missing, or double-counting skews results.
Solution: Verify tracking in both control and variant before launching. Check daily for first week to catch issues early.
Flash of original content: Users briefly see the control before JavaScript swaps to the variant, creating jarring experience and biasing results.
Solution: Use server-side testing tools when possible or implement flicker-free deployment methods (style hiding, synchronous scripts).
Organizational errors:
HiPPO syndrome: Highest-Paid Person's Opinion overrides test results. Executive likes variant B despite variant A winning, so variant B ships.
Solution: Set pre-commitment to test results. Define decision criteria before launching: "If variant reaches 95% confidence with 5%+ lift, we implement regardless of opinions."
Test theater: Running tests for appearances but ignoring results or implementing changes without testing.
Solution: Track implementation rates. If you're completing tests but implementing less than 30% of winners, you're wasting resources. Find and fix what's blocking you.
Lack of patience: Demanding results within days when tests need weeks creates pressure to cherry-pick inconclusive data.
Solution: Set expectations up-front. Share testing calendar showing when results will be ready. Educate stakeholders on sample size requirements.
False positives and replication: Even with perfect methodology, 5% of your "wins" at 95% confidence are false positives, random flukes, not real improvements.
For critical changes, replicate tests before full implementation. Run the test again with fresh traffic. If it replicates, confidence increases to 99.75% (0.05 × 0.05 = 0.0025 false positive rate). If it doesn't replicate, it was likely a false positive.
Most tactical tests don't warrant replication costs. But for strategic changes (major redesigns, pricing shifts, checkout overhauls), replication prevents expensive mistakes.
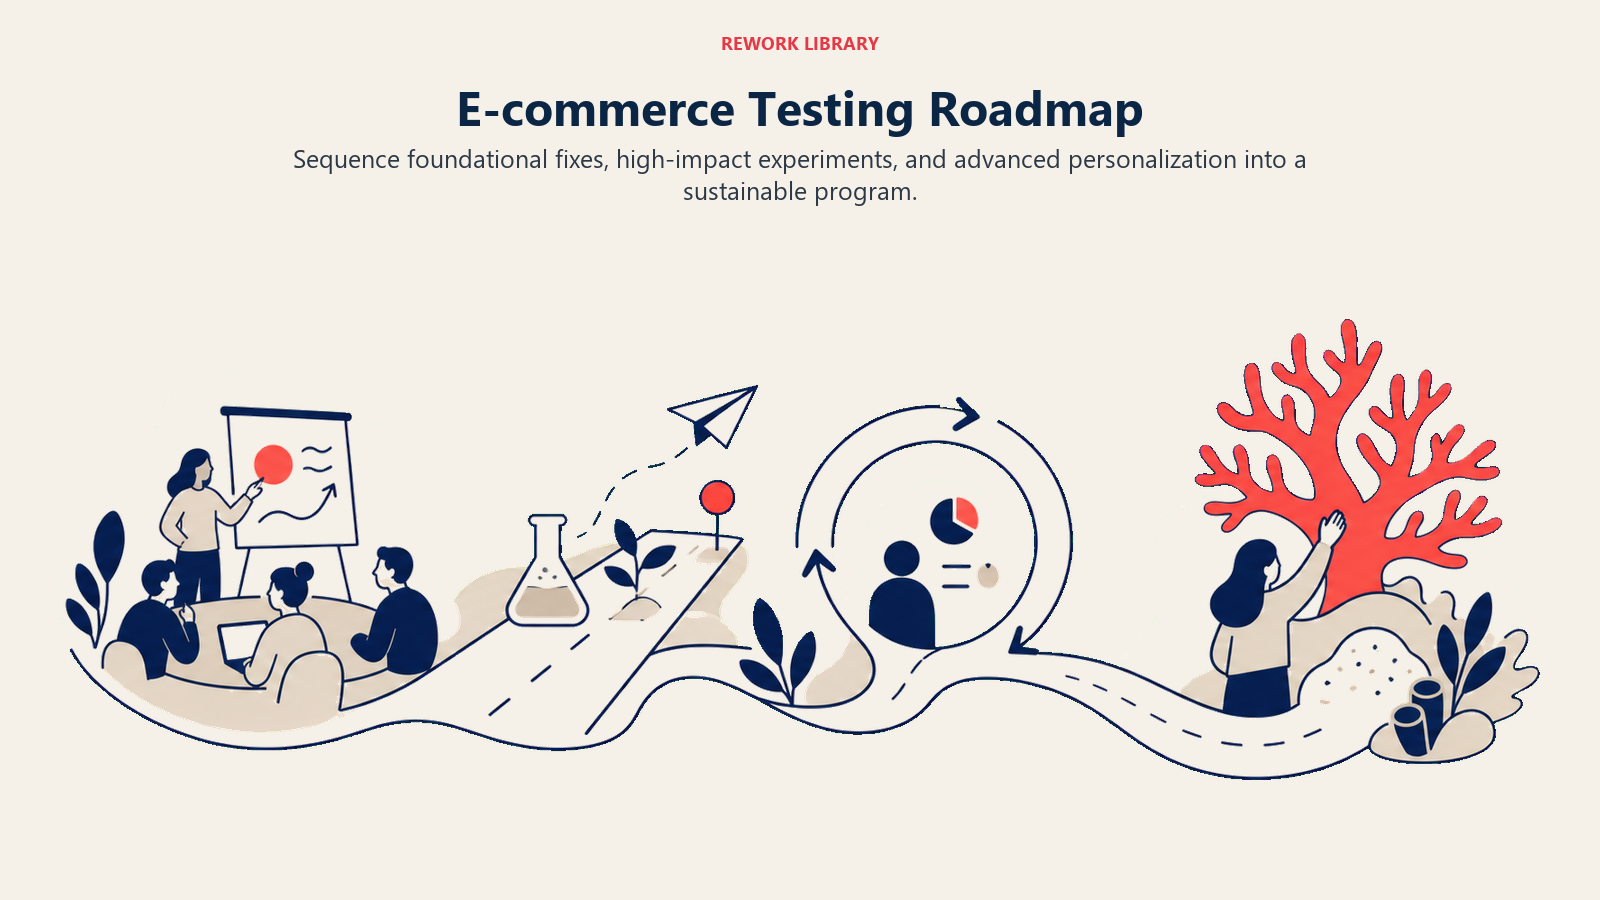
Building a Testing Roadmap
A roadmap transforms ad-hoc testing into a strategic program. Starting point: High-impact, low-effort tests: Months 1-3: Quick wins
- Homepage primary CTA text and placement
- Product page image gallery layout
- Checkout page trust badge placement
- Cart abandonment email messaging
- Key category page layouts
Target: 4-6 tests, 30-40% win rate, $30K-60K incremental annual revenue
Months 4-6: Conversion funnel optimization
- Full product page template redesign
- Checkout flow structure (single vs multi-page)
- Navigation and category organization
- Pricing presentation and discount display
- Mobile-specific experience improvements
Target: 3-5 tests, 25-35% win rate, $80K-150K incremental annual revenue
Scaling across the organization:
Months 7-12: Expansion and systematization
- Email marketing tests (subject lines, layouts, send times)
- Landing page optimization for paid traffic
- Post-purchase experience and cross-sells
- Personalization for key segments
- Seasonal campaign pre-testing
Target: 8-12 tests, 25-30% win rate, $150K-300K incremental annual revenue. Implementing email marketing for e-commerce testing helps optimize your highest-performing channel.
Year 2: Advanced optimization
- Sophisticated personalization rules
- Predictive testing using ML
- Cross-sell and upsell algorithms
- Pricing optimization across categories
- International market customization
Integrating with product roadmap: Product and engineering teams often view testing as slowing down development. Reframe it as removing risk from development.
Before building a new feature, test a prototype or MVP. A furniture retailer wanted to build a room visualization tool (3-month development effort). They first tested a simple "see it in your room" feature using basic photo overlay. It decreased conversion 4%, customers found it gimmicky. Testing saved three months of wasted development.
Build testing checkpoints into product development:
- Concept validation (will customers use this?)
- Design testing (which design variant performs better?)
- Feature refinement (what specific implementation works best?)
- Rollout validation (gradual rollout while monitoring metrics)
Annual goals and measurement: Set program-level goals:
Year 1 goals (new program):
- Complete 12-15 tests
- Achieve 25-30% win rate
- Generate $200K-400K incremental revenue
- Build testing infrastructure and documentation
Year 2 goals (growing program):
- Complete 20-25 tests
- Achieve 30-35% win rate
- Generate $500K-800K incremental revenue
- Expand testing to email and paid traffic
Year 3 goals (mature program):
- Complete 30-40 tests
- Achieve 30-40% win rate
- Generate $1M-2M incremental revenue
- Implement personalization and advanced techniques
Measuring testing program ROI: Calculate total program costs:
- Testing tool subscription ($15K-50K annually)
- Personnel time (% of salary for involved team members)
- Design and development resources
- Analytics and tracking tools
Compare to documented incremental revenue from winning tests. Mature programs typically achieve 10:1 to 20:1 ROI.
A mid-market retailer ($15M annual revenue) invested $60K annually in their testing program (tool + personnel) and generated $680K incremental revenue from validated improvements. That 11:1 ROI excludes the value of prevented mistakes from losing tests.
The ROI of testing compounds. Year one improvements become the new baseline for year two tests. A 15% conversion rate improvement in year one makes year two's 10% improvement worth more in absolute terms. Compounding optimization creates sustainable competitive advantages.
A/B testing transforms e-commerce from guesswork to systematic optimization. The framework outlined here, statistical rigor, strategic prioritization, proper methodology, and organizational commitment, turns testing from an occasional tactic into a compounding growth engine.
Start with high-impact areas using simple tools. Build win rate and credibility. Expand to sophisticated techniques as your program matures. Most importantly, commit to testing relentlessly, learning continuously, and implementing validated winners quickly.
The stores dominating e-commerce in five years won't be those with the biggest budgets or the most products. They'll be those that tested more systematically, learned more quickly, and compounded small improvements into serious competitive advantages. Build that capability now.
Related Resources
- Conversion Rate Optimization (CRO) - Comprehensive CRO strategies and frameworks
- Product Page Optimization - Detailed product page improvement guide
- Checkout Flow Optimization - Reducing friction and abandonment in checkout
- Pricing Strategy for E-commerce - Strategic pricing approaches and psychology
- Cart Abandonment Recovery - Recovering lost sales systematically
- Analytics & Tracking Setup - Building proper measurement foundations
- Marketing Automation - Automating testing and personalization at scale

Senior Operations & Growth Strategist
On this page
- Why A/B Testing Matters in E-commerce
- Statistical Foundations & Significance
- Test Prioritization Framework
- Testing Methodology & Design
- Key Areas for Testing
- Tools & Technology Stack
- Implementation Best Practices
- Analyzing Results & Action Items
- Continuous Testing Culture
- Advanced Testing Techniques
- Common Testing Mistakes & Solutions
- Building a Testing Roadmap
- Related Resources