Amazon FBA Strategy: Build a Scalable Marketplace Business with Fulfillment by Amazon
Turn this article into takeaways for your work.
Each assistant summarizes the article only for you and suggests best practices for your work.
A winning Amazon FBA strategy comes down to three disciplines: selecting products priced $15 to $50 with margins above 40%, modeling true profit after referral and fulfillment fees, and keeping inventory velocity high enough to dodge storage penalties. Master those three and FBA becomes a scalable, defensible marketplace business rather than a cash trap.
Third-party sellers generated over $160 billion in revenue on Amazon in 2026, with the majority using Fulfillment by Amazon (FBA) to scale their marketplace businesses. The reason is simple: FBA transforms individual entrepreneurs into operations that compete with Fortune 500 brands on delivery speed, customer service, and marketplace visibility.
But FBA isn't just about outsourcing logistics. It's a complete business model that requires strategic product selection, rigorous profitability modeling, and disciplined inventory management. The difference between FBA sellers who build sustainable businesses and those who burn through cash comes down to understanding the economics before sending the first shipment to Amazon's warehouses.
This guide provides the comprehensive framework for building a scalable, profitable FBA business, from product selection criteria to fee structure analysis, launch strategy to multi-SKU portfolio management.
What is Amazon FBA?
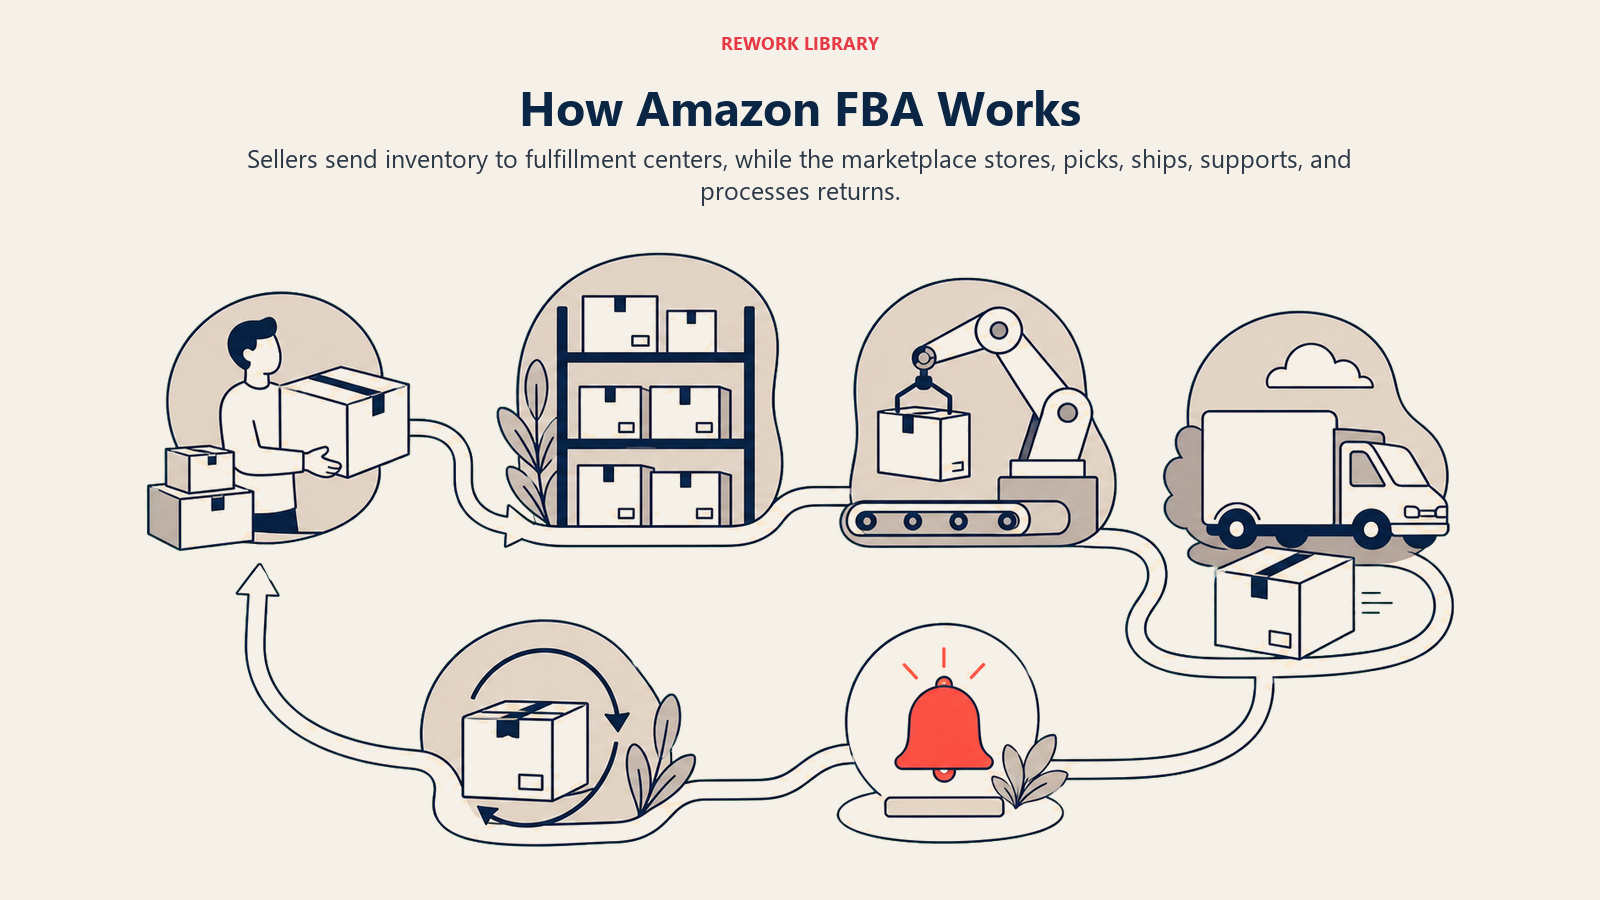
Fulfillment by Amazon (FBA) is Amazon's logistics service where sellers send inventory to Amazon warehouses, and Amazon handles storage, picking, packing, shipping, customer service, and returns. When a customer orders your product, Amazon fulfills it from their network of fulfillment centers.
FBA vs. FBM (Fulfilled by Merchant):
FBA advantages:
- Prime eligibility (automatic 2-day shipping)
- Higher Buy Box win rate (70-80% vs. 30-40% for FBM)
- Amazon handles customer service and returns
- Multi-channel fulfillment available
- Better visibility in search results
FBM advantages:
- Lower fees for large/heavy items
- Complete control over inventory
- No long-term storage fees
- Better margins on slow-moving items
- No preparation requirements
Why sellers choose FBA:
The competitive advantage is algorithmic. Amazon's A9 search algorithm prioritizes products that convert well and ship fast. FBA products automatically qualify for Prime, which accounts for 200+ million subscribers globally who preferentially buy Prime-eligible items. This creates a flywheel: better placement leads to more sales, which improves ranking, which drives more sales.
The second advantage is operational. FBA allows a single entrepreneur to compete with established brands on fulfillment speed without building warehouse infrastructure, hiring staff, or negotiating carrier contracts. You're effectively renting Amazon's logistics network at a per-unit cost.
For more context on how FBA fits into broader e-commerce approaches, see E-commerce Business Models.
FBA Business Model Mechanics
FBA economics work by trading platform and fulfillment fees for marketplace demand, Prime conversion lift, and operational leverage that would be hard to build alone.
Revenue streams:
FBA sellers generate revenue through product sales on Amazon's marketplace. Unlike building a direct-to-consumer brand, you're tapping into Amazon's existing customer base of 310+ million active accounts. The trade-off is margin: you pay platform fees, fulfillment fees, and advertising costs in exchange for access to this traffic.
Typical FBA business revenue composition:
- Organic sales (50-70%): Traffic from Amazon search and browse
- Sponsored Products ads (20-40%): PPC-driven sales
- External traffic (5-10%): Social, email, or influencer-driven
Algorithm favor and Buy Box advantage:
Amazon's search algorithm ranks products based on relevance, sales velocity, conversion rate, and fulfillment speed. FBA products receive preferential treatment in all these areas:
- Higher conversion rates: Prime badge increases CVR by 20-30%
- Better search placement: FBA products rank higher for identical keywords
- Buy Box preference: 82% of Amazon sales happen through the Buy Box; FBA significantly increases win rate
The Buy Box is particularly critical. Multiple sellers often list the same product. The seller who "wins" the Buy Box gets the prominent "Add to Cart" button. FBA sellers win the Buy Box more often because Amazon prioritizes fast, reliable fulfillment.
Capital efficiency vs. cash flow challenges:
FBA creates operational leverage but requires upfront capital. You must purchase inventory, ship it to Amazon, and wait for sales before seeing cash. Unlike a dropshipping model where you only buy inventory after receiving payment, FBA requires inventory investment 60-90 days before you realize revenue.
Cash conversion cycle:
- Order inventory from supplier (Day 0)
- Manufacturing and shipping (Days 30-60)
- Receive at Amazon warehouse (Day 60)
- Sales period (Days 60-120)
- Amazon payout (Day 74-134, bi-weekly disbursements)
Total cash cycle: 74-134 days from initial payment to receiving revenue.
Product Selection Framework for FBA
The foundation of a profitable FBA business is choosing the right products. Most failed FBA ventures can be traced to poor product selection, entering oversaturated markets, choosing low-margin items, or selecting products with prohibitive FBA fees.
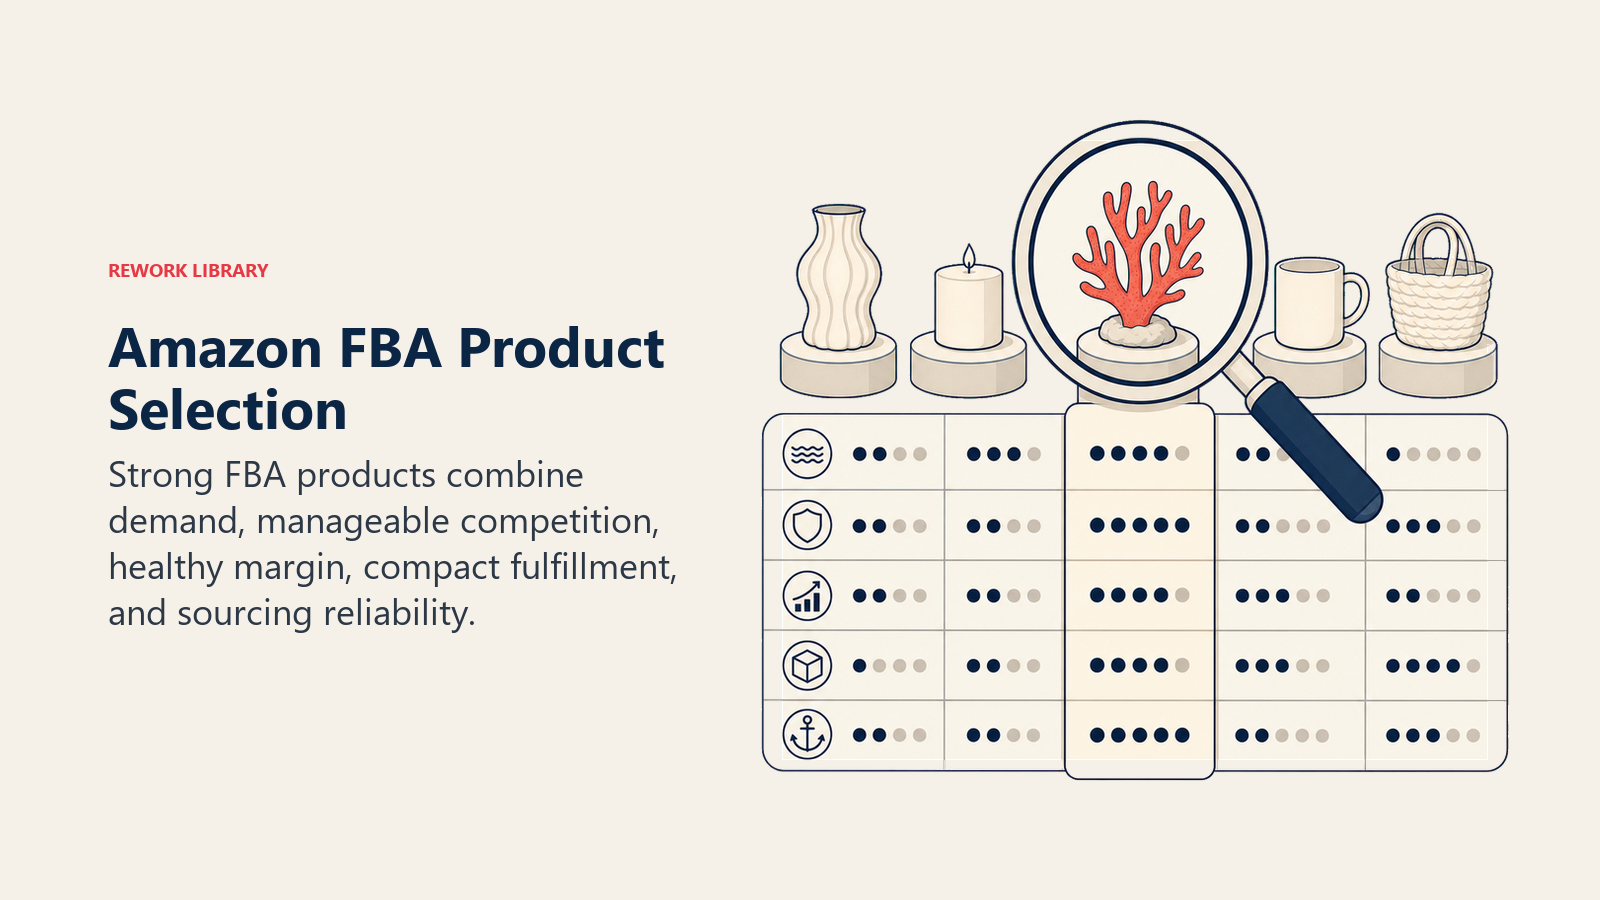
Ideal FBA product characteristics:
- Price point: $15-$50 retail price (sweet spot for margins after fees)
- Size and weight: Small, lightweight (under 1 lb, fits in small standard size box)
- Durability: Low breakage risk during shipping and storage
- Demand consistency: Year-round sales, not heavily seasonal
- Improvement opportunity: Existing products with 3.5-4.0 star reviews (room to differentiate)
- Low complexity: Simple SKU management, minimal variations
For a systematic approach to identifying winning products, see product research and validation.
Category viability assessment:
Avoid categories requiring approval:
- Collectibles (coins, entertainment collectibles)
- Automotive and powersports (certain subcategories)
- Jewelry and fine art
- Watches
- Professional services
Target accessible categories with demand:
- Home and kitchen (organizers, accessories)
- Sports and outdoors (fitness accessories, camping gear)
- Pet supplies (grooming tools, toys, accessories)
- Office products (desk organizers, stationery)
- Beauty and personal care (tools, accessories)
Your choice of product and positioning will significantly impact long-term success. Learn more about brand building and positioning strategies for marketplace sellers.
Weight and dimension optimization:
FBA fees are heavily influenced by size tier. Understanding these tiers is critical to profitability:
- Small standard size: Max 15" x 12" x 0.75", under 12 oz ($3.22 fulfillment fee)
- Large standard size: Max 18" x 14" x 8", under 20 lbs ($5.14-$9.73 fulfillment fee)
- Large bulky: Over large standard dimensions (fees escalate rapidly)
A product that weighs 11 oz vs. 13 oz can have a $2+ difference in per-unit fulfillment fees. At scale, this difference determines profitability.
Competitive analysis metrics:
Before committing to a product:
- Review count: Target products with 50-200 reviews (established demand, not oversaturated)
- Average rating: Look for 3.5-4.2 stars (opportunity to improve)
- Top seller rank: Category BSR under 15,000 (consistent sales velocity)
- Pricing consistency: Check if 80%+ of sellers are within 10% of each other (stable market)
- Seasonality: Review 12-month sales trend via tools like Helium 10 or Jungle Scout
These competitive metrics directly inform your pricing strategy and optimization approach for maximum profitability.
FBA Fee Structure & Cost Analysis
Amazon's FBA fee structure is complex but predictable. Understanding these fees is essential for accurate profitability modeling.
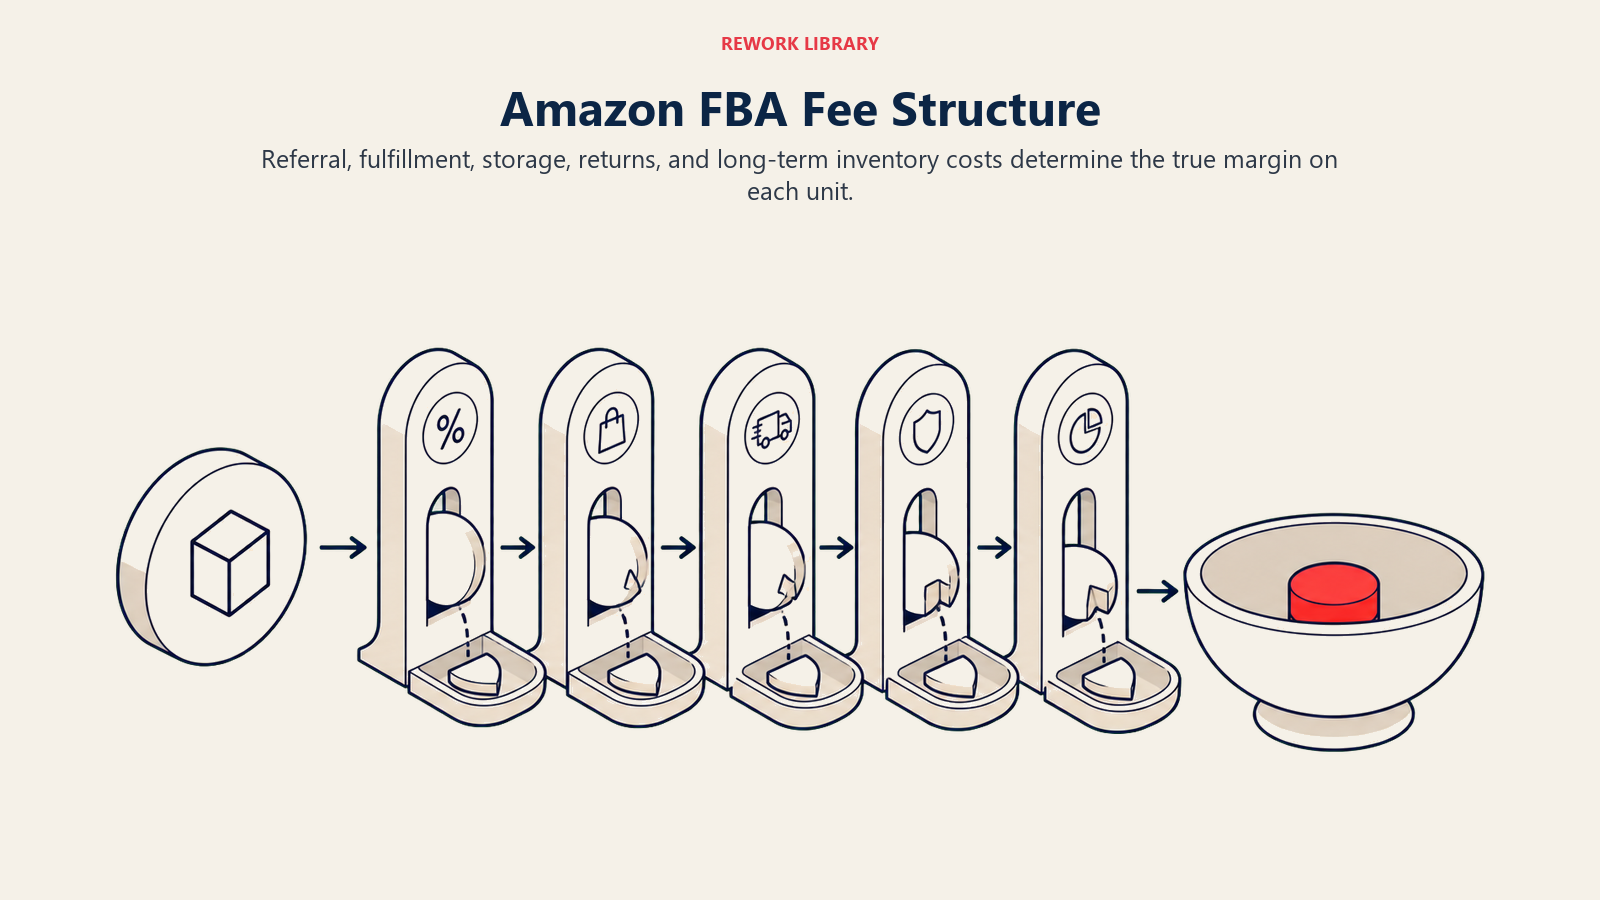
Referral fees (15% for most categories):
Amazon charges a percentage of the total sale price (item price + shipping) as a referral fee. This ranges from 6% (personal computers) to 45% (Amazon device accessories), with most categories at 15%.
Example for a $25 product:
- Referral fee: $25 × 15% = $3.75
Fulfillment fees (based on size tier and weight):
These cover picking, packing, shipping, customer service, and returns.
Small standard size (12 oz or less): $3.22 Large standard size examples:
- 10 oz: $5.14
- 1 lb: $5.73
- 2 lb: $6.91
- 3 lb+: $7.35 + $0.16/half-pound over 3 lbs
Monthly storage fees:
Charged based on daily average volume in cubic feet:
January-September:
- Standard size: $0.87 per cubic foot
- Oversize: $0.56 per cubic foot
October-December (peak season):
- Standard size: $2.40 per cubic foot
- Oversize: $1.40 per cubic foot
Long-term storage fees:
Items stored for 271-365 days: $6.90 per cubic foot or $0.15 per unit (whichever is greater)
Items stored 365+ days: $6.90 per cubic foot or $0.15 per unit monthly
Aged inventory surcharge:
Applied in addition to monthly storage fees:
- 181-210 days: $0.50 per cubic foot
- 211-240 days: $1.00 per cubic foot
- 241-270 days: $1.50 per cubic foot
- 271-300 days: $3.45 per cubic foot
- 301-330 days: $4.60 per cubic foot
- 331-365 days: $5.75 per cubic foot
- 365+ days: $6.90 per cubic foot
These fees make inventory velocity critical. Slow-moving inventory dramatically erodes margins.
FBA fee calculator example:
Product: Yoga mat carry strap
- Retail price: $19.99
- Dimensions: 12" x 3" x 2" (0.042 cubic feet)
- Weight: 6 oz
- Cost of goods: $4.50
- Units per month: 150
Revenue per unit: $19.99
Amazon fees per unit:
- Referral fee (15%): $3.00
- Fulfillment fee (small standard): $3.22
- Storage fee: $0.87 × 0.042 ÷ 30 days × avg 15 days = $0.02
- Total Amazon fees: $6.24
Gross profit per unit: $19.99 - $4.50 - $6.24 = $9.25
Margin: 46.3%
This profitability framework is part of a comprehensive unit economics for e-commerce approach essential for sustainable growth.
Profitability Modeling for FBA
Understanding all costs, not just Amazon fees, is essential for accurate profitability modeling.
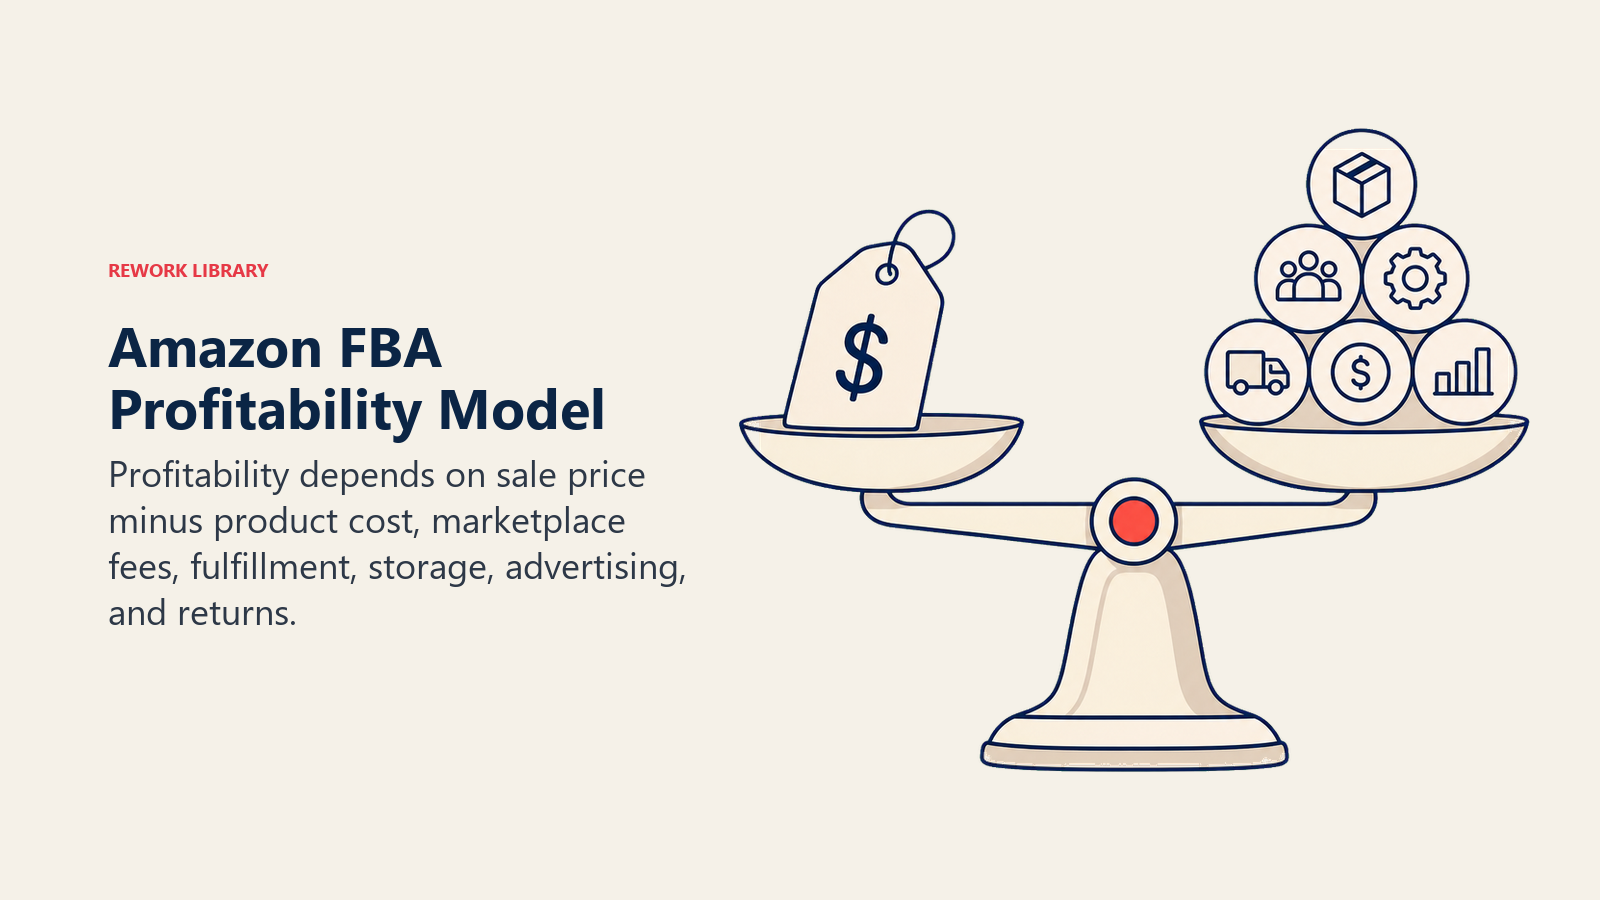
Complete cost structure:
Cost of Goods Sold (COGS):
- Product cost from supplier
- Shipping from supplier to your location (if applicable)
- Product customization or bundling costs
Inbound logistics:
- Shipping to Amazon warehouse
- Prep services (labeling, polybagging, bundling)
- Freight forwarding (for international suppliers)
Amazon fees:
- Referral fee
- Fulfillment fee
- Storage fee (monthly and long-term)
- Removal or disposal fees (for unsold inventory)
Advertising costs:
- Sponsored Products (PPC)
- Sponsored Brands
- External traffic acquisition
Operating expenses:
- Software tools (Helium 10, Jungle Scout, etc.)
- Professional services (photography, graphic design)
- Virtual assistant or team costs
- Business insurance
Minimum margin requirements:
Experienced FBA sellers target specific margin thresholds:
- Gross margin (after COGS and Amazon fees): 40-50%
- Contribution margin (after advertising): 25-35%
- Net margin (after all operating expenses): 15-25%
Products with gross margins below 40% rarely remain profitable after accounting for advertising, returns, and operational costs.
Break-even analysis:
Calculate the sales volume needed to cover fixed costs:
Fixed monthly costs: $2,500
- Software: $300
- VA support: $800
- Photography/design: $400
- Insurance: $200
- Misc overhead: $800
Average contribution margin per unit: $7.50
Break-even units: $2,500 ÷ $7.50 = 334 units/month
This represents the minimum sales velocity required before generating profit.
Cash flow projection:
Most FBA failures stem from cash flow challenges, not lack of demand. Model your cash conversion cycle:
Month 1: Order inventory ($10,000) Month 2: Receive and ship to Amazon ($1,200 shipping) Month 3: Begin sales, first payout ($8,000 revenue) Month 4: Full sales velocity ($15,000 revenue) Month 4: Reorder inventory to maintain stock ($12,000)
Cash required before positive cash flow: $11,200 Time to positive cash flow: 90-120 days
Understanding these cash flow dynamics is critical when evaluating your overall fulfillment strategy and operational model.
Product Selection & Sourcing Strategy
Once you've identified viable product categories, the next phase is finding suppliers and ensuring product quality.
Market research process:
- Identify opportunity: Use tools like Helium 10, Jungle Scout, or Viral Launch to analyze sales volume, competition, and pricing
- Validate demand: Check Google Trends for consistent search interest
- Assess differentiation: Read 3-star reviews to identify improvement opportunities
- Calculate profitability: Model all costs before committing
Supplier vetting and selection:
The most common sourcing approach is working with manufacturers in China via Alibaba, though domestic suppliers offer faster turnaround and lower MOQs (minimum order quantities).
Supplier vetting checklist:
- Trade assurance or verified status
- Minimum 2 years in business
- Factory audit reports (if available)
- Sample quality meets standards
- Communication responsiveness
- Reasonable payment terms
- Acceptable MOQ (ideally under 500 units for first order)
Sample ordering and quality control:
Never place a bulk order without testing samples:
- Order samples from 3-5 suppliers ($50-$200 total investment)
- Test product quality, packaging, labeling
- Identify required modifications or improvements
- Request updated samples with changes
- Approve final sample before bulk production
Quality control during production:
- Request photos during manufacturing
- Hire third-party inspection service for orders over $5,000
- Verify weight, dimensions, and specifications match samples
Differentiation and bundling strategies:
Entering a market with a commodity product leads to price wars. Successful FBA sellers differentiate through:
- Product bundling: Combine complementary items (resistance bands + door anchor + carry bag)
- Enhanced features: Upgrade materials, add functionality
- Superior packaging: Better unboxing experience
- Expanded color/size options: Offer more variety
- Improved instructions: Better user guides, QR codes to video tutorials
The goal is to make your listing visually distinct and offer clear added value versus competitors.
Inventory Management & Optimization
Inventory management makes or breaks FBA profitability. Too little inventory means lost sales and ranking drops. Too much inventory means long-term storage fees that erase margins.
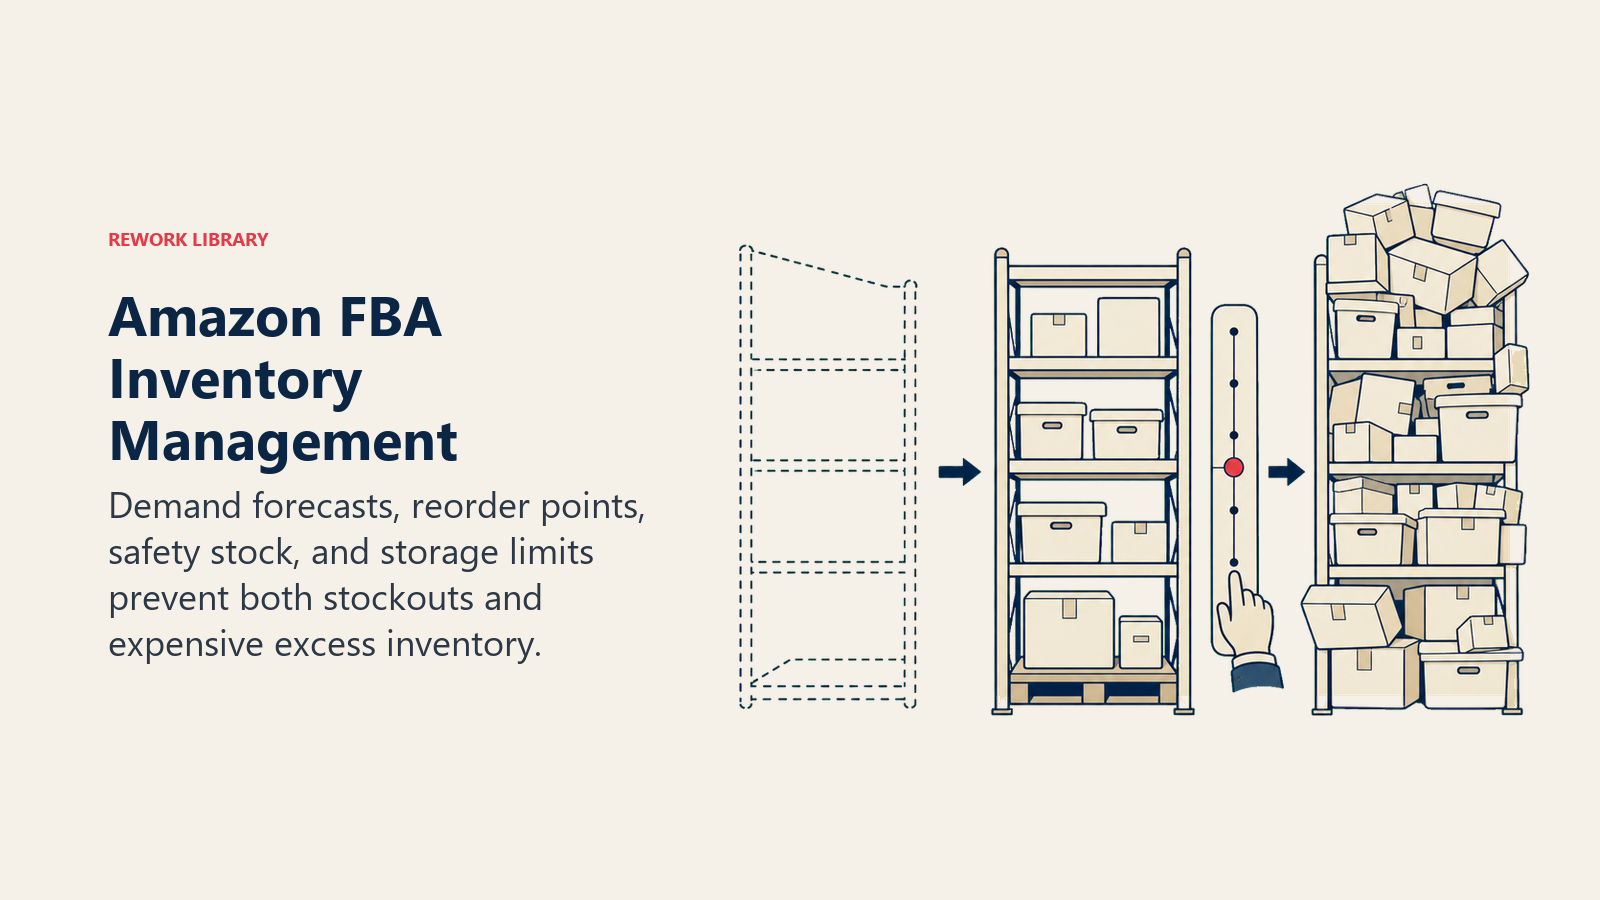
Demand forecasting:
Use Amazon's sales data to project future demand:
Simple moving average: (Month 1 sales + Month 2 sales + Month 3 sales) ÷ 3 = Projected next month
Weighted average (recent months weighted higher): (Month 1 × 1 + Month 2 × 2 + Month 3 × 3) ÷ 6 = Projected next month
Factor in:
- Seasonal trends (summer products, holiday items)
- Promotional calendars (Prime Day, Black Friday)
- Inventory lead time (60-90 days from order to Amazon warehouse)
Reorder point calculation:
Reorder point = (Average daily sales × Lead time in days) + Safety stock
Example:
- Average daily sales: 15 units
- Lead time: 75 days (production + shipping)
- Safety stock: 30 days of inventory
Reorder point = (15 × 75) + (15 × 30) = 1,125 + 450 = 1,575 units
Order new inventory when current stock reaches 1,575 units.
Storage cost optimization:
Minimize storage fees by:
- Maintaining 60-90 days of inventory (not 6 months)
- Using Amazon's Inventory Performance Index (IPI) score to track efficiency
- Removing slow-moving inventory before long-term storage fees kick in
- Running promotions to clear aged inventory
- Splitting shipments to multiple fulfillment centers (if cost-effective)
SKU rationalization:
As you expand product lines, regularly audit SKU performance:
Evaluate each SKU:
- Units sold per month
- Gross margin
- Storage costs
- Return rate
- Contribution to brand presence
Remove SKUs that:
- Sell fewer than 20 units/month
- Have gross margins under 35%
- Generate frequent returns
- Cannibalize sales from better-performing products
These principles are foundational to effective inventory management across all e-commerce channels.
Launch Strategy & Market Entry
A well-executed launch significantly impacts long-term success. Amazon's algorithm rewards products with strong initial velocity, so launching strategically builds momentum.
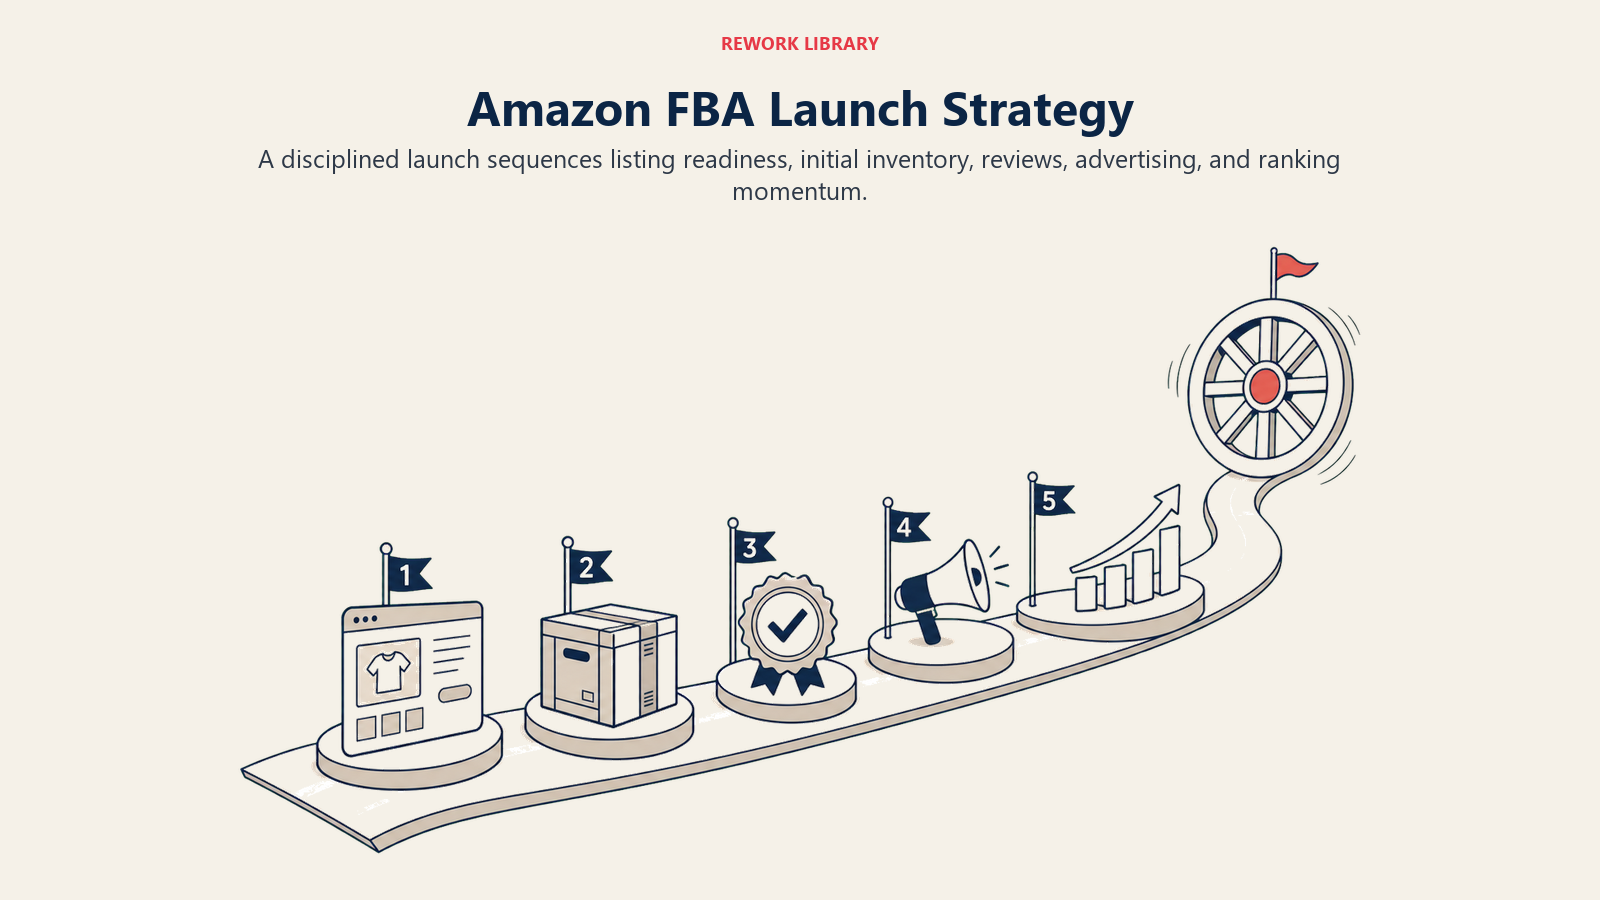
Pre-launch optimization:
Before inventory arrives at Amazon:
- Listing optimization:
- Keyword-optimized title (includes primary keywords)
- Bullet points highlighting benefits, not just features
- A+ Content (Enhanced Brand Content for brand-registered sellers)
- High-quality images (7+ images showing product in use)
- Backend search terms fully utilized
Effective listing optimization requires understanding Amazon SEO and ranking algorithms to maximize organic visibility.
Pricing strategy:
- Launch at competitive price (often 10-15% below established competitors)
- Plan pricing increases as reviews accumulate
Advertising preparation:
- Research top-performing keywords via tools
- Prepare manual and automatic campaigns
- Set initial daily budget ($25-$50/day)
Review generation strategy:
Reviews directly impact conversion rate and search ranking. Ethical review generation:
- Amazon Vine program: Provides free products to trusted reviewers (requires Brand Registry)
- Request a Review button: One-click request via Seller Central (use for every order)
- Follow-up email sequences: Via tools like FeedbackWhiz or Helium 10 (compliant with Amazon TOS)
- Product inserts: QR codes to helpful resources (not requesting reviews, which violates TOS)
Never:
- Offer incentives for positive reviews
- Use review services promising 5-star reviews
- Leave fake reviews from friends/family
Reviews are a critical component of customer reviews and UGC strategy for driving conversions and building trust.
PPC strategy for launch:
Amazon PPC accelerates initial sales velocity. A well-structured Amazon advertising campaign is essential for launch success:
Week 1-2: Discovery phase
- Run automatic campaigns at moderate bids ($0.75-$1.50)
- Collect data on converting keywords
- Monitor ACoS (Advertising Cost of Sale)
Week 3-4: Optimization phase
- Create manual campaigns targeting top-performing keywords
- Add negative keywords to eliminate wasted spend
- Increase bids on high-converting terms
Ongoing:
- Target ACoS: 25-35% during launch (break-even or slight loss)
- Optimize toward 15-20% ACoS as organic ranking improves
Launch timeline:
Days 1-14: High-velocity push
- Maximum advertising budget
- Competitive pricing
- Active promotion to warm audiences (if available)
Days 15-30: Data collection
- Monitor keyword ranking improvements
- Track conversion rate trends
- Adjust pricing based on review accumulation
Days 31-60: Stabilization
- Reduce PPC spend as organic sales increase
- Optimize listing based on search term reports
- Begin profitability focus
Scaling & Multi-SKU Strategy
Once you've proven profitability with your initial product, strategic expansion multiplies revenue while using your existing infrastructure.
Horizontal expansion (related products):
Add complementary products within the same category:
- Yoga mat strap → Add yoga blocks, resistance bands, mat cleaners
- Dog grooming gloves → Add nail clippers, deshedding tools, shampoo
Benefits:
- Cross-selling opportunities
- Shared marketing (one ad campaign drives multiple product sales)
- Customer lifetime value increase
- Algorithmic benefit (Amazon shows customers related products from same seller)
Vertical expansion (same product, different variations):
Offer size, color, or bundle variations:
- Resistance bands in 5 resistance levels
- Phone cases in 12 colors
- Bundles (individual item + 2-pack + 5-pack)
Benefits:
- Captures more market share within same niche
- Consolidated reviews (variations share review count)
- Higher average order value
- Lower PPC cost (one campaign targets multiple ASINs)
Portfolio management framework:
As you grow to 10+ SKUs, implement portfolio management:
Star products (high sales, high margin):
- Double down on inventory
- Increase advertising budget
- Expand to variations
Cash cows (steady sales, good margin):
- Maintain optimal inventory levels
- Reduce PPC to minimum effective spend
- Harvest profits
Question marks (new products, uncertain performance):
- Test with limited inventory
- Monitor closely for 60-90 days
- Decide to scale or discontinue
Dogs (low sales, poor margin):
- Liquidate via promotions
- Remove from FBA to avoid storage fees
- Discontinue and reallocate capital
Capital allocation:
As revenue grows, reinvest profits strategically:
- 40-50%: Inventory replenishment (maintain stock)
- 20-30%: New product launches (expand portfolio)
- 10-20%: Advertising and promotion (growth)
- 10-20%: Cash reserves (buffer for surprises)
Once you've established profitability on Amazon, consider expanding with a multi-channel marketplace strategy to diversify revenue streams.
Risk Management & Mitigation
FBA businesses face specific risks that can jeopardize accounts, inventory, and revenue. Proactive risk management protects your business.
Account health management:
Amazon tracks seller performance via Account Health Rating:
Critical metrics:
- Order defect rate: Must stay below 1%
- Pre-fulfillment cancellation rate: Below 2.5%
- Late shipment rate: Below 4% (less critical for FBA)
Account suspension triggers:
- Repeated policy violations
- High return rates for specific ASINs
- Customer complaints about product authenticity
- Intellectual property complaints
Mitigation strategies:
- Monitor account health dashboard weekly
- Respond to all customer messages within 24 hours
- Address negative reviews professionally
- Remove problematic ASINs before they impact account health
Counterfeit and hijacker protection:
Brand Registry provides protection against counterfeit sellers:
- Enroll in Amazon Brand Registry (requires trademark)
- Use Transparency codes (serialized stickers preventing counterfeits)
- Report violations immediately via Brand Registry portal
- Use Project Zero (automated counterfeit removal for enrolled brands)
Inventory risk management:
Protect inventory from loss:
- Amazon reimbursement claims for lost/damaged inventory (file within 18 months)
- Monitor inventory discrepancies via reconciliation reports
- Use inventory insurance for high-value products
- Maintain documentation (photos, invoices) for reimbursement claims
Supplier relationship diversification:
Relying on a single supplier creates risk:
- Develop relationships with 2-3 qualified suppliers per product
- Negotiate similar pricing and terms
- Test quality from backup suppliers
- Maintain supplier contact information and specifications
Policy compliance:
Stay current on Amazon policy changes:
- Subscribe to Seller Central news updates
- Join FBA seller forums (Reddit r/FulfillmentByAmazon, Seller Central forums)
- Review Seller Central Policy updates quarterly
- Work with Amazon compliance consultants if needed
Profitability Optimization Techniques
Continuous optimization separates sustainable FBA businesses from those that stagnate.
Pricing strategy refinement:
Repricing strategies:
- Competitive pricing: Match or beat Buy Box price (use automated repricing tools)
- Premium pricing: Price 5-10% higher than competitors if differentiation justifies it
- Psychological pricing: $19.99 vs. $20.00 (increases conversion)
- Bundle pricing: Increase perceived value while maintaining margins
Dynamic repricing based on:
- Inventory levels (increase price as stock depletes)
- Competition changes (respond to competitor price drops)
- Time of day/week (higher prices during peak shopping hours)
- Seasonality (premium pricing during peak demand)
Cost reduction initiatives:
Regularly audit and optimize costs:
Negotiate with suppliers:
- Request pricing review after 6-12 months
- Increase order quantities for volume discounts
- Consolidate orders across SKUs
Optimize packaging:
- Reduce dimensional weight (smaller boxes = lower fees)
- Minimize packaging materials while maintaining protection
- Use Amazon's packaging guidelines to avoid prep fees
Reduce return rates:
- Improve product descriptions to set accurate expectations
- Include sizing guides and measurement details
- Add instructional inserts to prevent user errors
Eliminate inefficiencies:
- Use Amazon's partnered carrier program for inbound shipping discounts
- Batch shipments to reduce per-unit logistics costs
- Automate repetitive tasks (inventory tracking, repricing, review requests)
Return management:
Returns directly impact profitability:
Category average return rates:
- Apparel: 15-30%
- Electronics: 10-15%
- Home & Kitchen: 5-10%
- Beauty: 3-5%
Strategies to reduce returns:
- Clear, accurate product descriptions
- High-quality images showing product scale
- FAQ sections addressing common concerns
- Proactive customer service (respond quickly to pre-purchase questions)
For returned items:
- Request return to your location for high-value items (save disposal fees)
- Inspect returned inventory for resale eligibility
- File reimbursement claims for damaged returns caused by Amazon
Advanced profitability tracking:
Track profitability at multiple levels:
Per-ASIN profitability:
- Revenue per unit
- All-in cost per unit (COGS + fees + advertising allocated)
- Net margin per unit
- Return on ad spend (ROAS)
Portfolio profitability:
- Total revenue
- Blended gross margin
- Total advertising spend and efficiency
- Net profit after all operating expenses
Use tools like SellerBoard, HelloProfit, or custom spreadsheets to monitor these metrics weekly. Regular tracking of e-commerce metrics and KPIs enables data-driven optimization decisions.
Getting Started with Amazon FBA
Amazon FBA offers a proven path to building a scalable e-commerce business by using Amazon's massive customer base and logistics infrastructure. Success requires disciplined product selection, rigorous profitability modeling, and continuous optimization.
The foundation is choosing products that meet specific criteria: appropriate price points, favorable size/weight characteristics, and margin potential above 40%. From there, effective inventory management, strategic launches, and portfolio expansion create compounding growth.
The sellers who build sustainable FBA businesses treat it as a data-driven operation, tracking every metric, optimizing every cost, and making decisions based on unit economics rather than intuition. With the right framework and discipline, FBA can generate consistent, scalable revenue with operational leverage that traditional e-commerce models can't match.
The opportunity is substantial. The question is whether you'll approach it with the analytical rigor required to capture it.
Frequently Asked Questions
How much money do you need to start an Amazon FBA business? Most first product launches need $5,000 to $10,000 to cover initial inventory, shipping to Amazon, product photography, and early PPC spend. Plan for 90 to 120 days before reaching positive cash flow, since FBA ties up capital between paying your supplier and receiving Amazon's bi-weekly payouts.
Is Amazon FBA still profitable in 2026? Yes, but margins favor disciplined sellers. After referral fees (typically 15%), fulfillment fees, and storage costs, you want a gross margin of 40 to 50% before advertising. Products that clear that bar can still net 15 to 25% after all operating expenses.
What products work best for FBA? Small, lightweight items priced between $15 and $50, with consistent year-round demand and existing competitors rated 3.5 to 4.2 stars. That review range signals proven demand plus room for you to differentiate on quality, bundling, or packaging.
What is the difference between FBA and FBM? With FBA, Amazon stores your inventory and handles shipping, customer service, and returns, which earns Prime eligibility and a higher Buy Box win rate. With FBM (Fulfilled by Merchant), you ship orders yourself, which can be cheaper for large or slow-moving items but loses the Prime advantage.
How long does it take to make money with FBA? Expect a 74 to 134 day cash conversion cycle from your first supplier payment to revenue. Many sellers reach steady profitability within 6 to 12 months once a product ranks organically and PPC costs drop toward 15 to 20% ACoS.

Senior Operations & Growth Strategist
On this page
- What is Amazon FBA?
- FBA Business Model Mechanics
- Product Selection Framework for FBA
- FBA Fee Structure & Cost Analysis
- Profitability Modeling for FBA
- Product Selection & Sourcing Strategy
- Inventory Management & Optimization
- Launch Strategy & Market Entry
- Scaling & Multi-SKU Strategy
- Risk Management & Mitigation
- Profitability Optimization Techniques
- Getting Started with Amazon FBA
- Frequently Asked Questions