Client Satisfaction Management: Building Systematic Approaches to Measure, Monitor, and Improve Client Experience
Turn this article into takeaways for your work.
Each assistant summarizes the article only for you and suggests best practices for your work.
Client satisfaction management is the systematic practice of measuring, monitoring, and improving client experience, and it is the engine behind agency growth services because satisfied clients renew, expand their spend, and refer new business. Firms that act on satisfaction data see 25-40% higher retention, 2-3x more expansion revenue, and 50% more referrals. Here's the uncomfortable truth about professional services: most firms have no idea how satisfied their clients actually are until it's too late. They find out when a client doesn't renew. Or when a proposal request goes to a competitor. Or when a reference call goes sideways.
The excuse is always the same: "We have great relationships with our clients. We'd know if there was a problem." But relationship managers are notoriously bad at predicting client satisfaction. One study found that account managers rated client relationships as "excellent" in 89% of cases where clients were actually planning to leave.
The ROI of systematic satisfaction management isn't subtle. Firms that measure and act on client satisfaction see 25-40% higher retention rates, 2-3x more expansion revenue, and 50% more referrals. But here's the catch: satisfaction measurement only works if you actually do something with the data. Most firms collect feedback and then file it away. Your overall client relationship strategy depends on getting this right.
This guide shows you how to build satisfaction management systems that drive real improvement. We'll cover measurement frameworks, specific methodologies like NPS and CSAT, early warning systems, and continuous improvement loops that turn feedback into action.
Defining client satisfaction beyond simple happiness
Most people think satisfaction means "the client is happy." That's incomplete. Real satisfaction operates on multiple levels, and if you only measure surface-level happiness, you'll miss critical problems. Think about satisfaction as a spectrum with three distinct states:
Dissatisfied: The client is unhappy. Something went wrong or expectations weren't met. This is dangerous territory where you're at risk of losing the client or getting negative word-of-mouth.
Satisfied: The client got what they expected. Nothing special, nothing terrible. You delivered on your promises. This sounds fine, but it's actually risky. Satisfied clients switch vendors all the time because there's no loyalty beyond "they're adequate."
Delighted: You exceeded expectations. The client is genuinely impressed and would actively recommend you. This is where retention, expansion, and referrals happen.
The problem is that most satisfaction surveys only measure whether you cleared the "satisfied" bar. They don't tell you if you're truly differentiated or just acceptable. You need to measure both baseline satisfaction and the factors that create delight.
Here's another dimension people miss: satisfaction varies across multiple stakeholders. In professional services, you're rarely dealing with a single decision-maker. You might have:
- The executive sponsor who cares about business outcomes
- The project manager who cares about responsiveness and communication
- The technical lead who cares about deliverable quality
- The procurement team who cares about budget adherence
You can delight the project manager while frustrating the executive sponsor. If you only survey one person, you're getting an incomplete picture. Your measurement system needs to capture satisfaction across all key stakeholders, weighted by their influence on renewal decisions.
There's also the concept of the psychological contract - the unspoken expectations clients have beyond what's written in the SOW. They expect you to be proactive, to bring insights, to care about their success. When you violate these implicit expectations, satisfaction drops even if you're technically delivering on contractual obligations.
Satisfaction measurement framework: choosing your approach
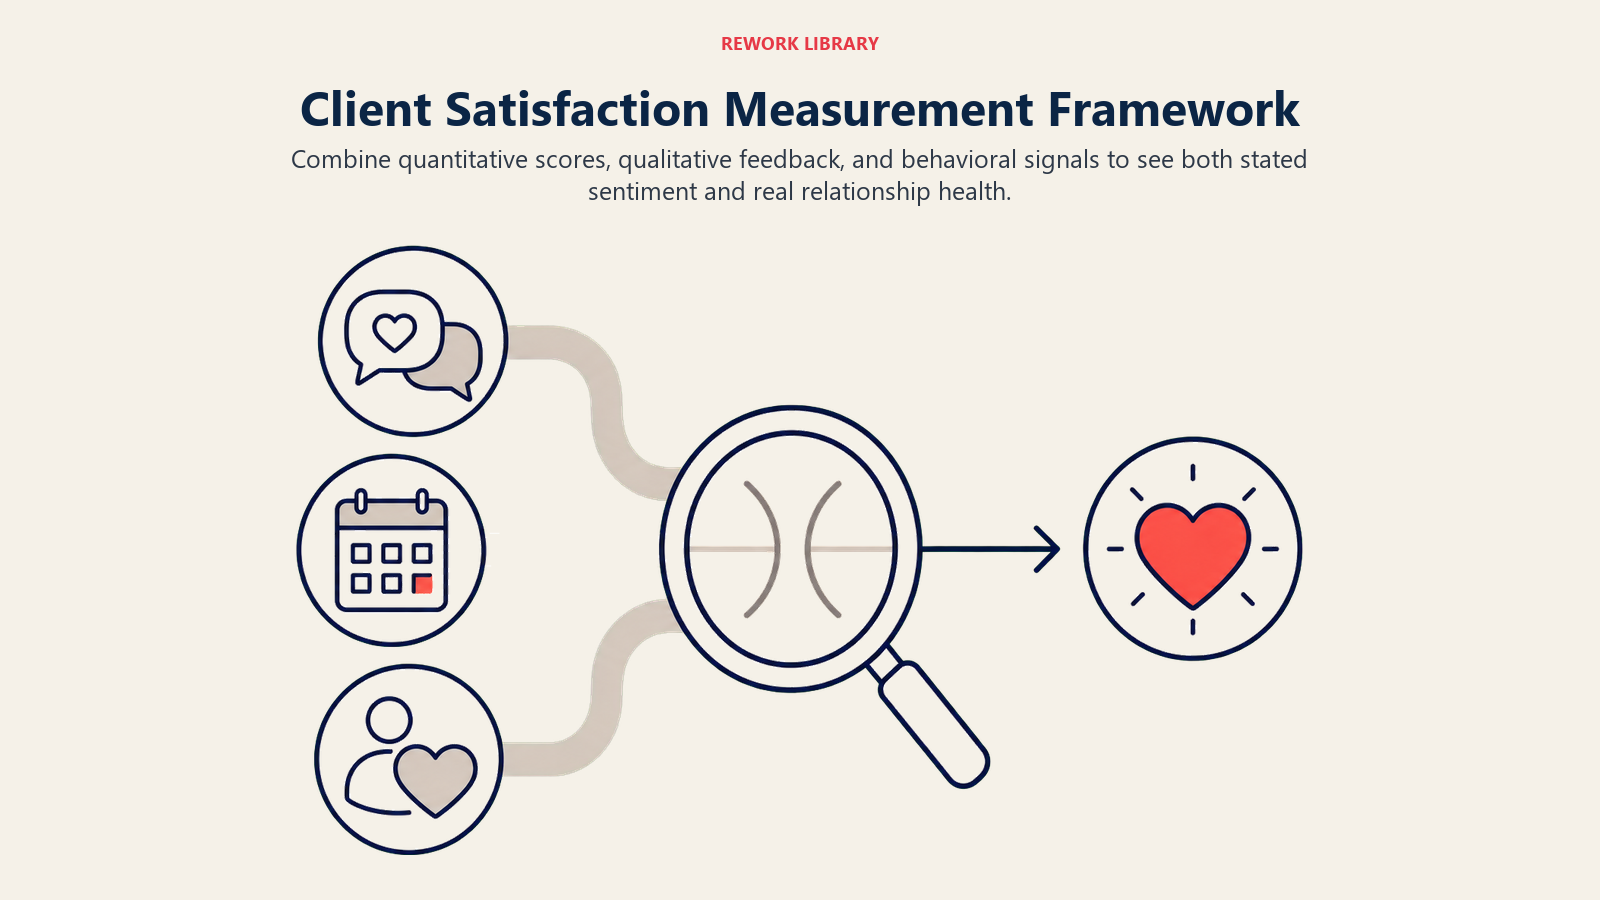
You can measure satisfaction in three ways: quantitative metrics, qualitative feedback, and behavioral indicators. Most firms pick one and ignore the others. That's a mistake. You need all three. Quantitative measurement gives you trends and benchmarks. NPS scores, CSAT ratings, effort scores. These are easy to track over time and compare across clients or teams. But they're reductive - a score of 7/10 doesn't tell you what to fix. Qualitative feedback gives you the why behind the numbers. Open-ended survey questions, client interviews, feedback during reviews. This is where you discover specific pain points and improvement opportunities. But it's harder to aggregate and spot patterns.
Behavioral indicators show satisfaction through actions, not words. Renewal rates, expansion purchases, referral frequency, response times to your emails, meeting attendance patterns. Clients lie in surveys but behavior reveals truth. If they're not returning calls or bringing you into new projects, satisfaction is low regardless of what they say in a survey.
The hybrid approach combines all three: use quantitative scores to spot trends and flag issues, qualitative feedback to understand root causes, and behavioral data to validate what clients are really thinking.
Before you start measuring, establish your baseline and benchmarks. What's your current satisfaction level? What's good performance in your industry? What's world-class? Without benchmarks, you won't know if a score of 8.2/10 is excellent or mediocre.
You also need measurement governance - who owns satisfaction tracking, how often do you measure, what happens when scores drop, who sees the data. Without clear ownership, satisfaction measurement becomes another thing that gets tracked but never acted on.
To make the three measurement types concrete, here's how they map to the growth outcome each one predicts and the cadence that works in practice:
| Metric | What it measures | Growth outcome it predicts | Cadence |
|---|---|---|---|
| NPS | Overall relationship strength and advocacy | Referrals and renewals | Quarterly + at renewal |
| CSAT | Satisfaction with a specific deliverable or touchpoint | Repeat project bookings | After each milestone |
| CES | Friction and ease of working together | Churn risk (high effort drives switching) | After support or onboarding |
Read across the row, not just down the column. A firm with a strong NPS but a weak CES is winning advocacy while quietly exhausting clients, and that effort debt eventually caps how much agency growth the relationship can support.
Net Promoter Score (NPS): measuring advocacy and referral likelihood
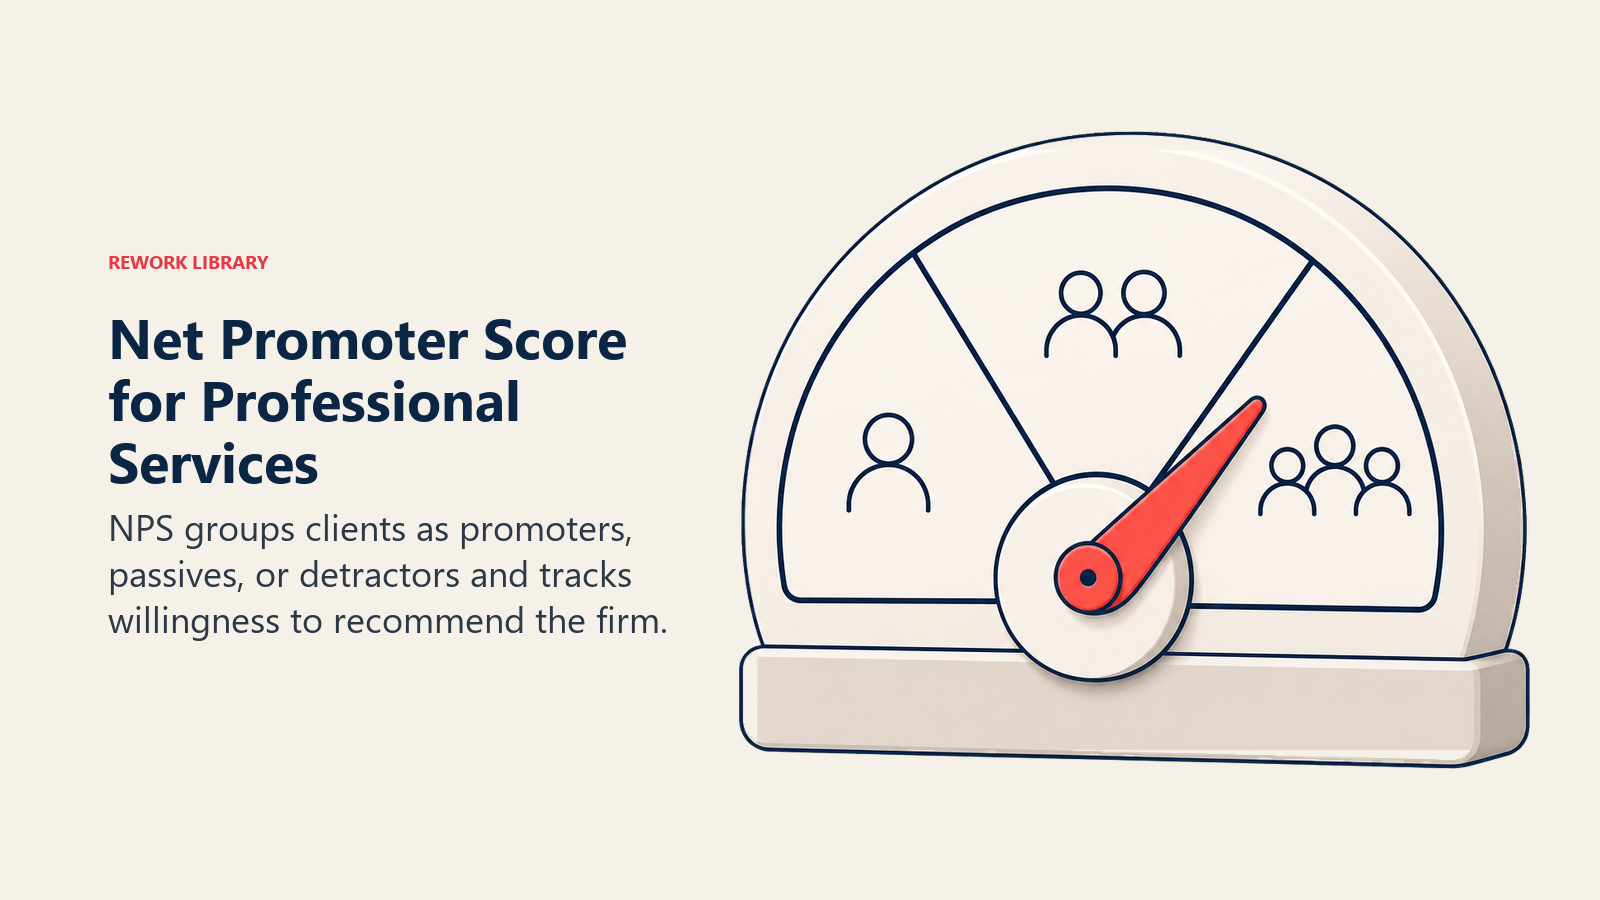
NPS is the most widely used satisfaction metric in B2B services, and for good reason: it predicts revenue growth better than any other single measure. But most firms implement it badly. The fundamental NPS question is simple: "On a scale of 0-10, how likely are you to recommend [our firm] to a colleague or peer?" Based on responses, you segment clients into three groups:
- Promoters (9-10): Enthusiastic clients who will actively refer you
- Passives (7-8): Satisfied but unenthusiastic, vulnerable to competition
- Detractors (0-6): Unhappy clients at risk of leaving and potentially damaging your reputation
Your NPS is calculated as: % Promoters - % Detractors. So if 60% are promoters, 30% are passives, and 10% are detractors, your NPS is 50. Scores above 50 are excellent in professional services, scores above 70 are world-class, and scores below 30 suggest serious problems.
But here's what most people get wrong: they send the NPS survey, calculate the score, and stop there. The score itself is almost useless without the follow-up question: "Why did you give that score?"
That qualitative answer is where the gold is. Promoters tell you what's working ("They always deliver ahead of schedule and bring creative solutions"). Detractors tell you what's broken ("Communication is terrible and we never know project status"). Passives reveal what would move them to promoters ("They're fine but haven't really added strategic value").
Survey design best practices: Keep it short. Two questions maximum for the core NPS survey - the rating and the why. Send it at meaningful moments: after project completion, quarterly for ongoing clients, post-renewal. Don't bombard clients monthly or you'll get survey fatigue.
Segmentation is critical: Don't just track overall NPS. Segment by:
- Service line (is consulting satisfaction different than implementation?)
- Client tenure (are new clients happier than long-term clients?)
- Engagement type (project vs retainer vs managed services)
- Account size (enterprise vs mid-market)
- Partner or team (which delivery teams have higher satisfaction?)
These segments reveal patterns. Maybe your NPS is 45 overall but only 20 for clients in year three. That's a retention risk. Or maybe one practice area consistently scores 70+ while another is stuck at 30. You need to understand what the high-performing team does differently.
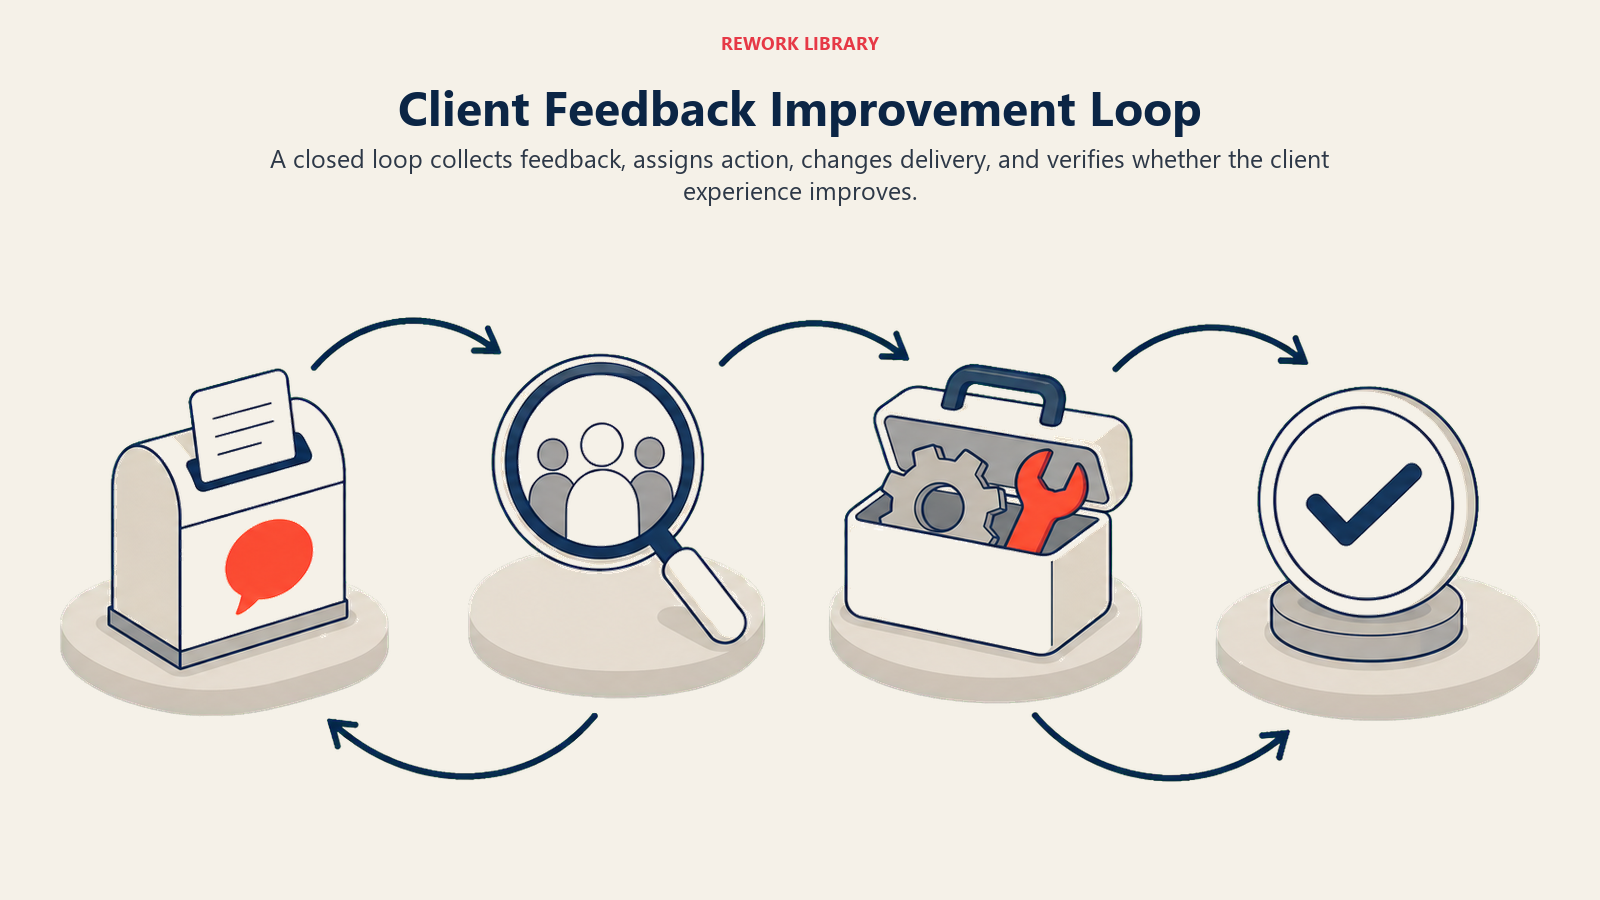
Turning NPS into action: Create a closed-loop feedback process:
- Collect responses and calculate scores
- Flag detractors immediately (within 24 hours)
- Have engagement leaders reach out to understand issues
- Create action plans to address problems
- Follow up to confirm improvements
- Track if satisfaction increases after intervention
For promoters, thank them and ask for referrals or testimonials while they're enthusiastic. This is the ideal time to begin developing client testimonials and case studies. For passives, understand what would move them to promoters and test those improvements.
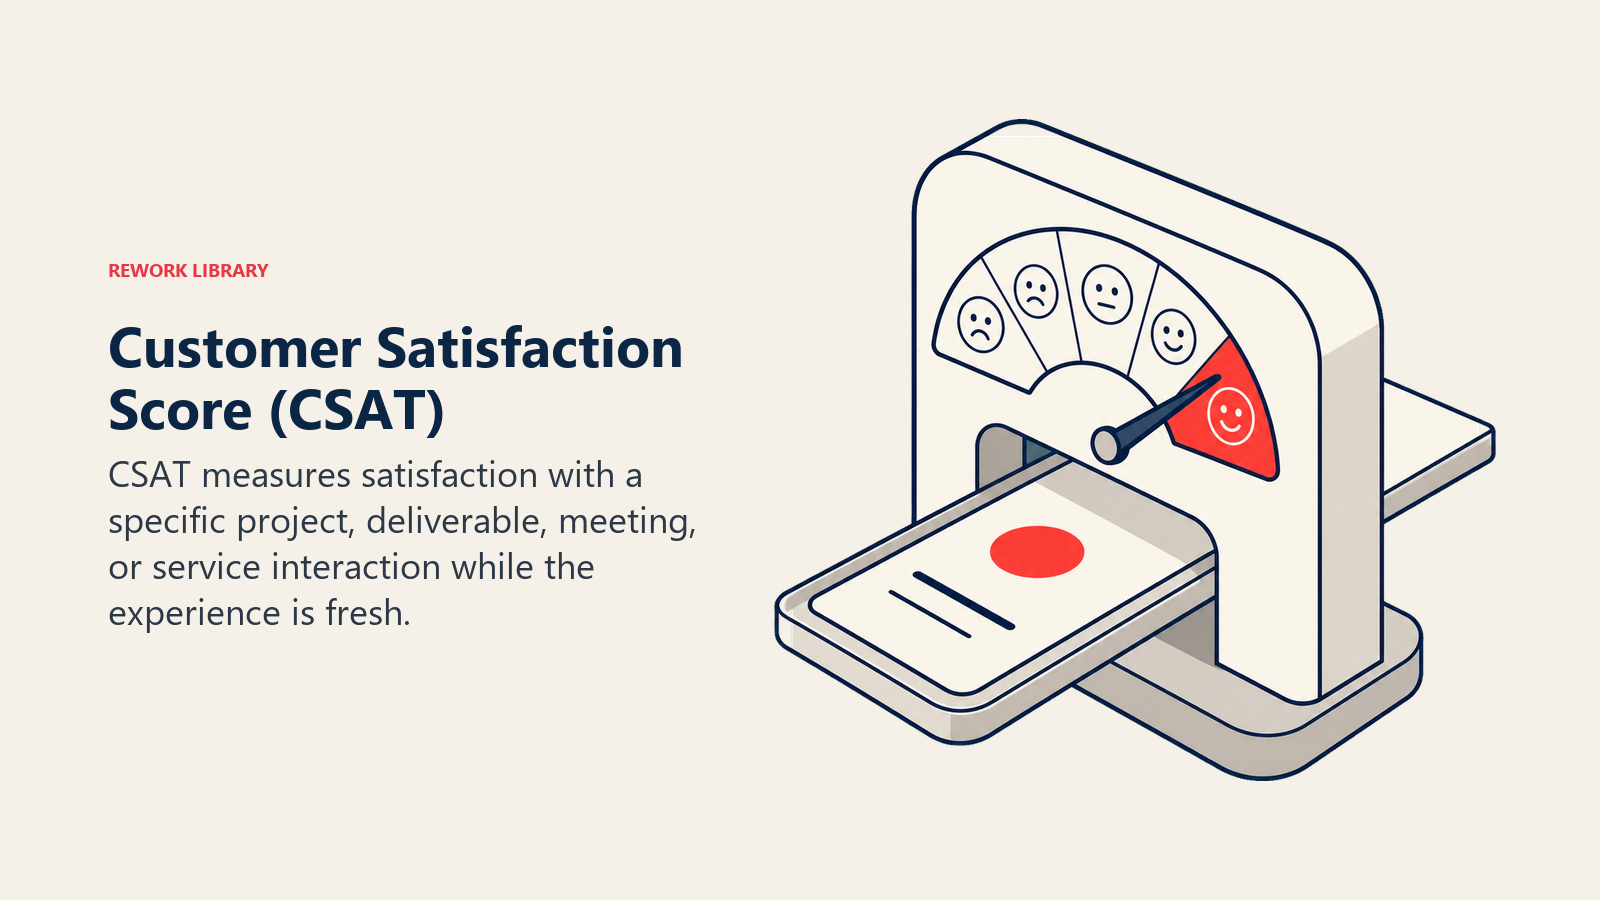
Customer Satisfaction Score (CSAT): project and touchpoint measurement
While NPS measures overall relationship strength, CSAT measures satisfaction with specific interactions, deliverables, or experiences. It's more tactical and immediate. The typical CSAT question is: "How satisfied were you with [specific experience]?" rated on a 1-5 scale where 1 is very dissatisfied and 5 is very satisfied. Your CSAT score is usually the percentage of 4s and 5s (satisfied + very satisfied). The power of CSAT is its specificity. You can measure satisfaction with:
- Individual deliverables or milestones
- Specific meetings or workshops
- Response time and communication quality
- Individual team members or roles
- Onboarding experience
- Issue resolution
- Invoicing and billing processes
This granularity lets you pinpoint exactly what's working and what's not. Maybe your overall relationship is strong but clients hate your reporting format. Or they love your strategic thinking but find your project managers unresponsive. CSAT surfaces these operational issues.
Multi-dimensional CSAT assessment: Instead of a single satisfaction question, break it into dimensions:
- Quality of deliverables (1-5)
- Timeliness and responsiveness (1-5)
- Expertise and knowledge (1-5)
- Communication clarity (1-5)
- Value for investment (1-5)
This gives you a satisfaction profile. You might score 4.8 on expertise but 3.2 on responsiveness. Now you know where to improve.
CSAT metrics to track:
- Overall CSAT score by engagement
- CSAT by dimension (quality, timeliness, communication, etc.)
- CSAT trends over time (improving or declining?)
- CSAT by client segment or service line
- CSAT correlation to project profitability (do happier clients generate better margins?)
Setting targets: Industry benchmarks for professional services CSAT are typically 80-90% (4s and 5s). Below 75% indicates serious issues. Above 90% is excellent. But absolute scores matter less than trends. If you're at 82% and rising, you're improving. If you're at 88% and falling, something changed for the worse.
Use CSAT to drive continuous improvement: review scores after every project, identify patterns in low-scoring areas, test improvements, measure if scores increase. This creates a feedback loop that compounds over time.
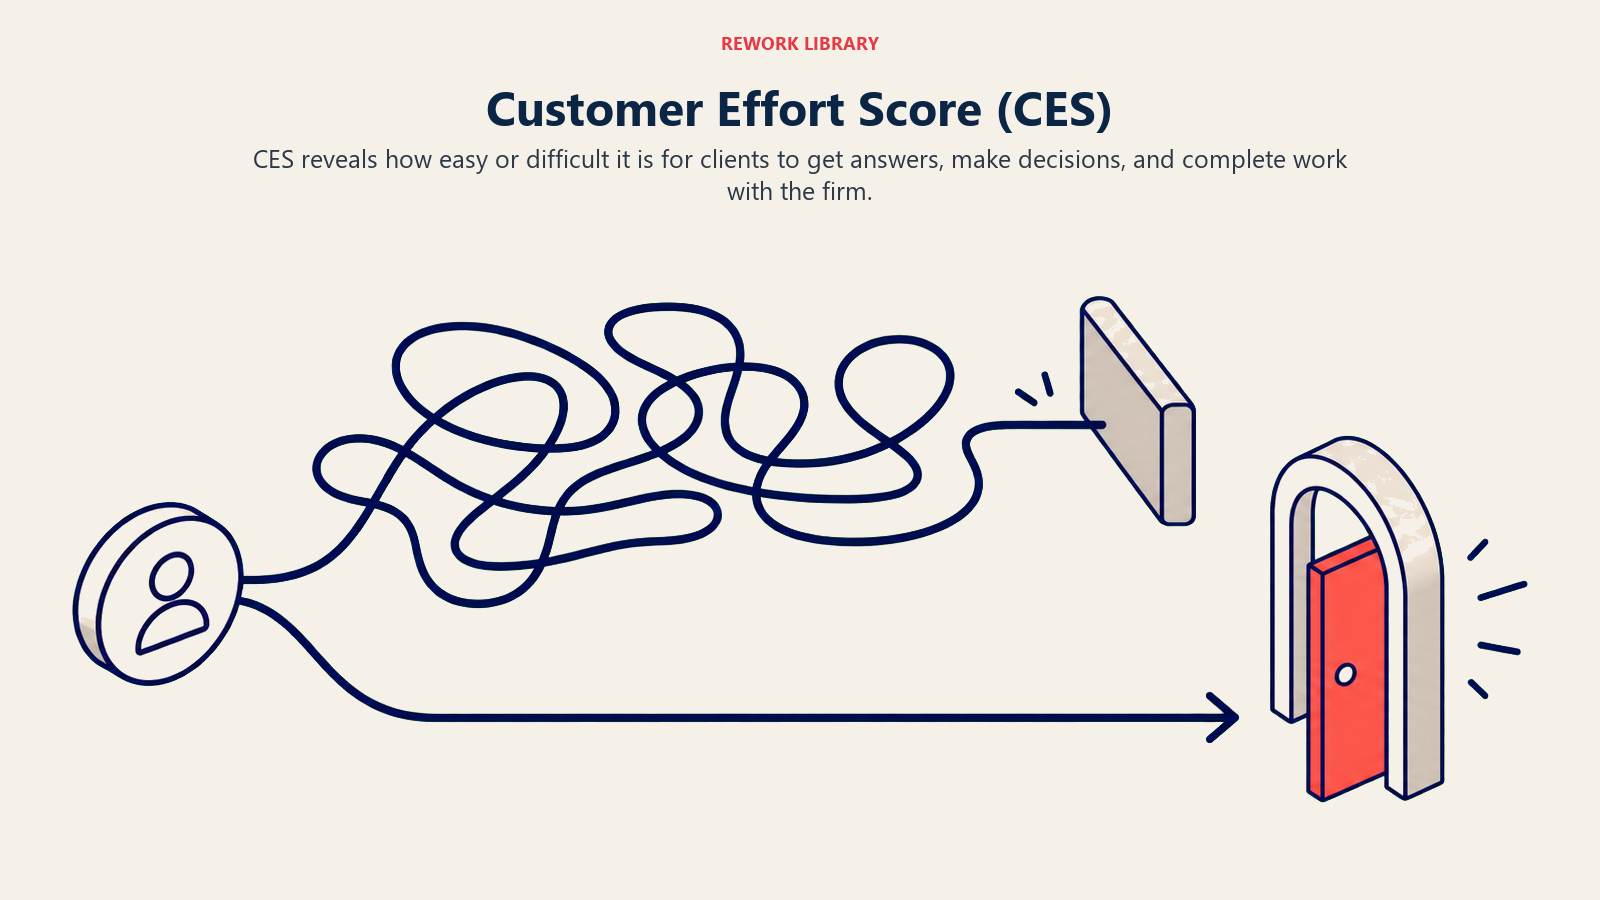
Customer Effort Score (CES): measuring friction and ease of working together
Here's a counterintuitive finding: reducing client effort matters more than exceeding expectations. Clients who have to work hard to get what they need - even if the final result is good - are much more likely to switch providers. CES measures how easy or difficult it is for clients to accomplish goals: "How easy was it to [complete this task / get this resolved / work with our team]?" rated on a 1-7 scale from very difficult to very easy. This is particularly relevant for operational aspects of the engagement:
- How hard is it to schedule meetings with your team?
- How many emails does it take to get a question answered?
- How much rework do you require from the client?
- How easy is your onboarding process?
- How complicated is your invoicing?
Professional services firms often optimize for expertise while creating massive friction. The consultant is brilliant but impossible to reach. The deliverable is insightful but requires three rounds of revisions because you didn't understand the requirements. The value is there but the client is exhausted.
Operational satisfaction metrics related to effort:
- Average response time to client emails/calls
- Number of status update requests from clients (if they're asking, you're not communicating enough)
- Revision cycles required per deliverable
- Meeting scheduling time (first request to confirmed meeting)
- Onboarding time to first value delivery
- Invoice dispute frequency
Behavioral indicators of effort problems:
- Clients stop engaging in optional touchpoints (they're tired of dealing with you)
- Escalations increase (they can't get answers through normal channels)
- Emails become shorter and more transactional (relationship fatigue)
- They start CCing more people (lack of trust in your responsiveness)
High-effort relationships are exhausting even when the work quality is good. Clients will pay premiums for low-effort partnerships because it saves them time and frustration.
To reduce effort:
- Build communication cadence that proactively updates clients before they have to ask
- Create clear escalation paths for urgent issues
- Streamline your processes - every form, approval, and handoff adds client effort
- Invest in client-facing tools that increase transparency
- Train teams on responsiveness as a core competency
Survey strategy: frequency, timing, and design
Bad survey strategy destroys response rates and data quality. Here's how to do it right. Frequency and timing: There are two survey approaches - relationship surveys and transactional surveys.
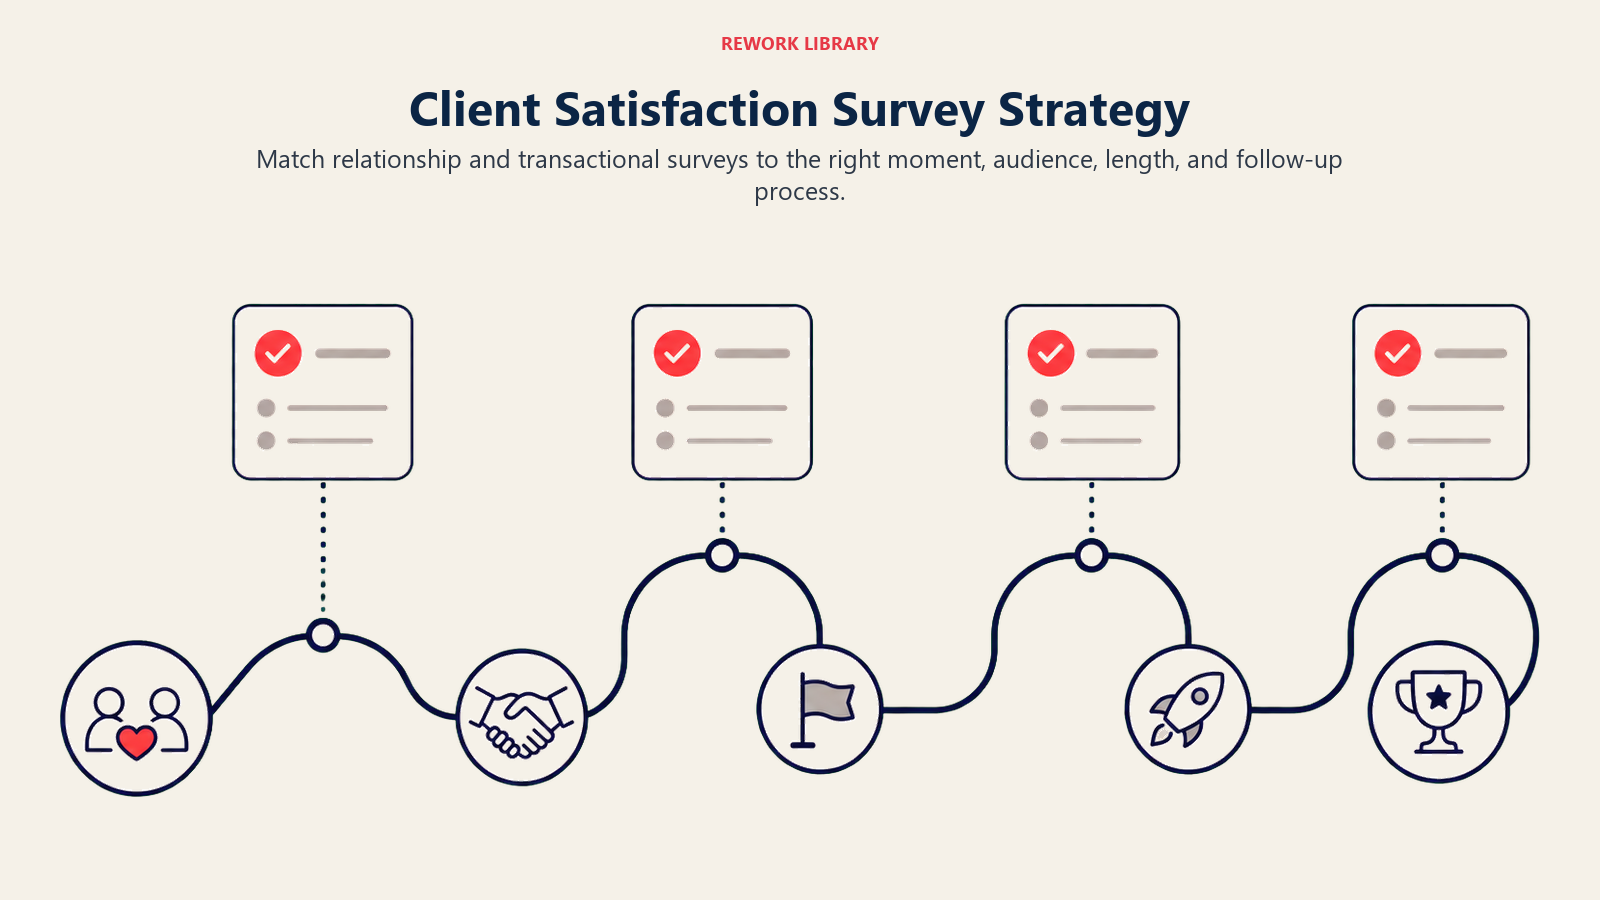
Relationship surveys (like NPS) measure overall satisfaction. Send these quarterly or semi-annually for active clients, and definitely at renewal time. Don't over-survey - more than quarterly feels like harassment.
Transactional surveys (like CSAT) measure specific interactions. Send these immediately after:
- Project milestones or completion
- Support tickets are resolved
- Onboarding finishes
- Major deliveries
- Issue escalations
The closer to the experience, the more accurate the feedback. Surveying someone six weeks after a project ends gets fuzzy recall.
Administration approaches: You have options for how to collect feedback:
Email surveys work well for transactional CSAT - quick, low-friction, easy to track. Keep them to 2-3 questions maximum.
Phone or video interviews work better for relationship NPS or deep-dive satisfaction reviews. You get richer qualitative data and can probe on interesting responses. But they're time-intensive and some clients won't participate.
In-meeting pulse checks work for active projects - spend five minutes at the end of status meetings getting quick feedback. Informal but valuable.
Annual business reviews should always include structured satisfaction discussion. Don't just present accomplishments - ask where you fell short and what to improve.
Design best practices:
- Start with the most important question (don't bury the NPS question on page 3)
- Use consistent scales (mixing 1-5, 1-10, and agree/disagree creates confusion)
- Ask one thing per question (not "How satisfied were you with quality and timeliness?")
- Include open-ended "why" questions for context
- Make surveys mobile-friendly
- Show progress indicators if the survey has multiple questions
- Explain what you'll do with the feedback
- Close the loop by sharing results and actions taken
Response rate optimization: If fewer than 30% of clients respond, your data is suspect. To boost response rates:
Send from the right person - surveys from the engagement partner get higher response than surveys from "feedback@firm.com"
Personalize - use names, reference specific projects, show you know who they are
Time it right - mid-week, mid-day performs better than Friday afternoon or Monday morning
Keep it short - every additional question reduces completion rates
Explain the why - "We use this feedback to improve how we serve you" beats "Please complete this survey"
Incentivize strategically - not cash, but "We'll share benchmarking insights with respondents"
Follow up once - a single reminder email after 3-5 days is fine, more is spam
Most importantly, show you acted on previous feedback. If clients see their input led to changes, they'll continue to participate.
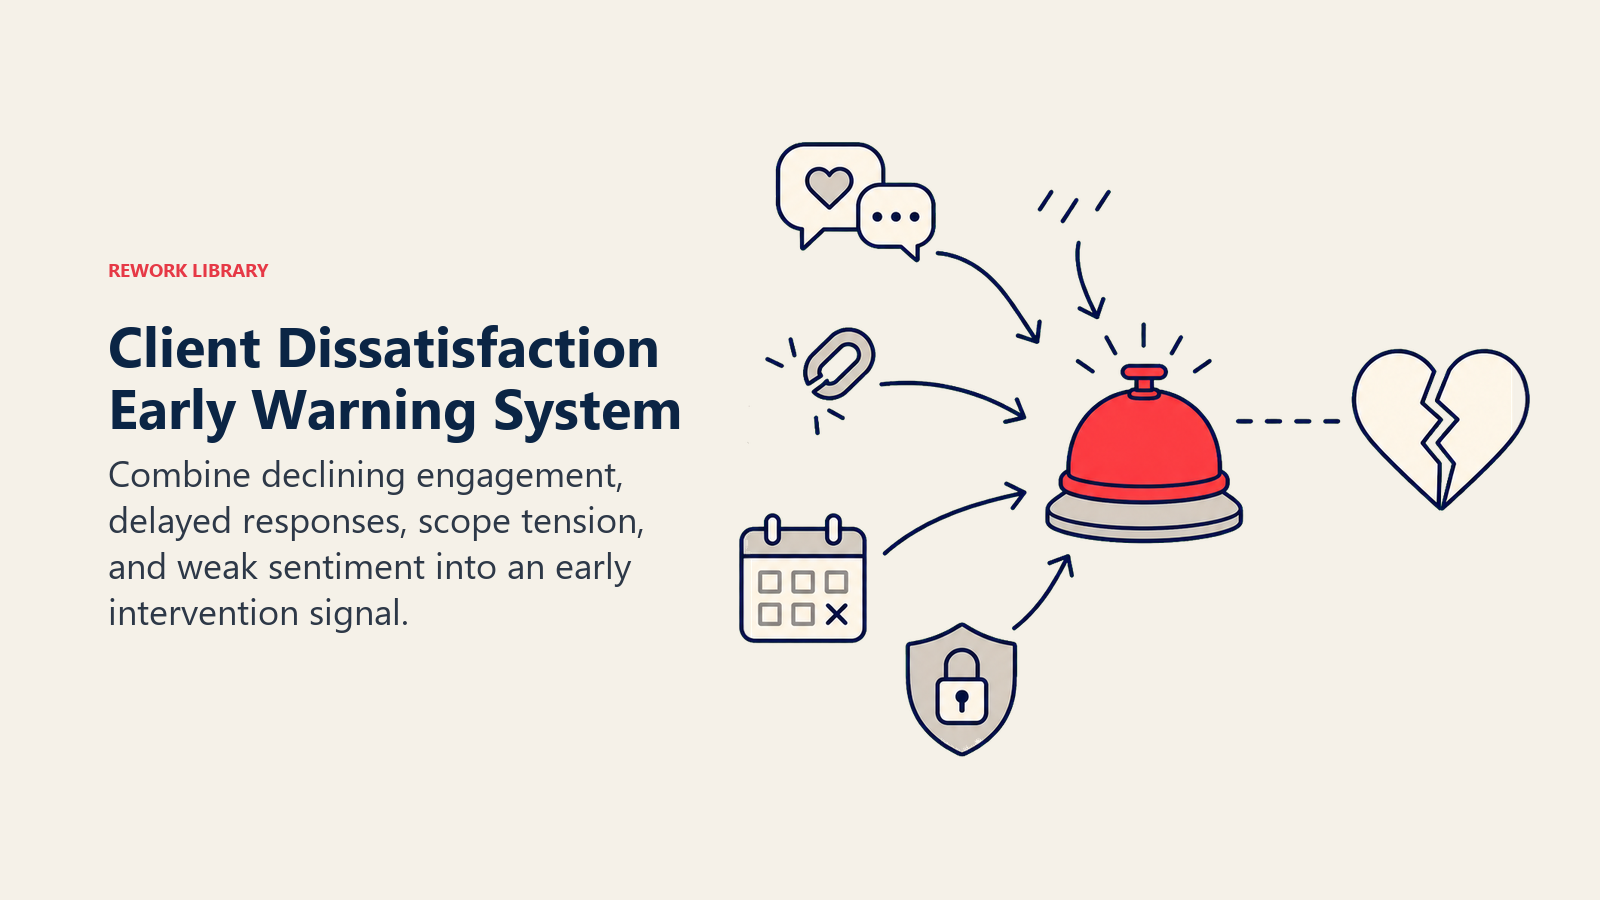
Identifying and managing dissatisfaction early
The biggest mistake firms make is treating satisfaction management as a rear-view mirror activity. By the time a formal survey reveals dissatisfaction, the damage is done. You need early warning systems that detect problems before they become crises. Here's what to monitor: Behavioral red flags:
- Client takes longer to respond to emails (engagement is dropping)
- Meeting attendance declines (they're deprioritizing you)
- They stop including you in strategic discussions (you're becoming tactical/transactional)
- New stakeholders appear without introduction (someone's questioning your value)
- Procurement gets more involved than usual (they're cost-shopping)
- Positive feedback stops (even "thanks" emails matter)
- They mention competitors in casual conversation
- Expansion opportunities you'd normally get go elsewhere
Operational indicators:
- Increase in change requests or scope clarifications (expectations aren't aligned)
- More questions about deliverable timing (trust is eroding)
- Invoice payment delays (satisfaction with value is questionable)
- Escalations increase in frequency or severity
- Your key champion seems less influential or has gone quiet
Formal check-ins that catch issues early:
- Monthly project health checks with delivery teams (they often see problems first)
- Quarterly executive sponsor check-ins (not just status updates - ask directly about satisfaction)
- Post-deliverable micro-surveys (catch issues before the project ends)
- Regular "what's one thing we could improve?" conversations
Structured client success reviews provide the perfect forum for these strategic conversations.
Root cause analysis when dissatisfaction surfaces: Don't just treat symptoms. Use the "5 whys" approach:
"Client is unhappy with deliverable quality." Why? "The deliverable didn't match their expectations." Why? "Our requirements gathering was incomplete." Why? "We didn't involve the right stakeholders early." Why? "Our kickoff process doesn't identify all decision-makers." Why? "We don't have a standardized stakeholder mapping step."
Now you've found the systemic issue to fix, not just the one-off problem.
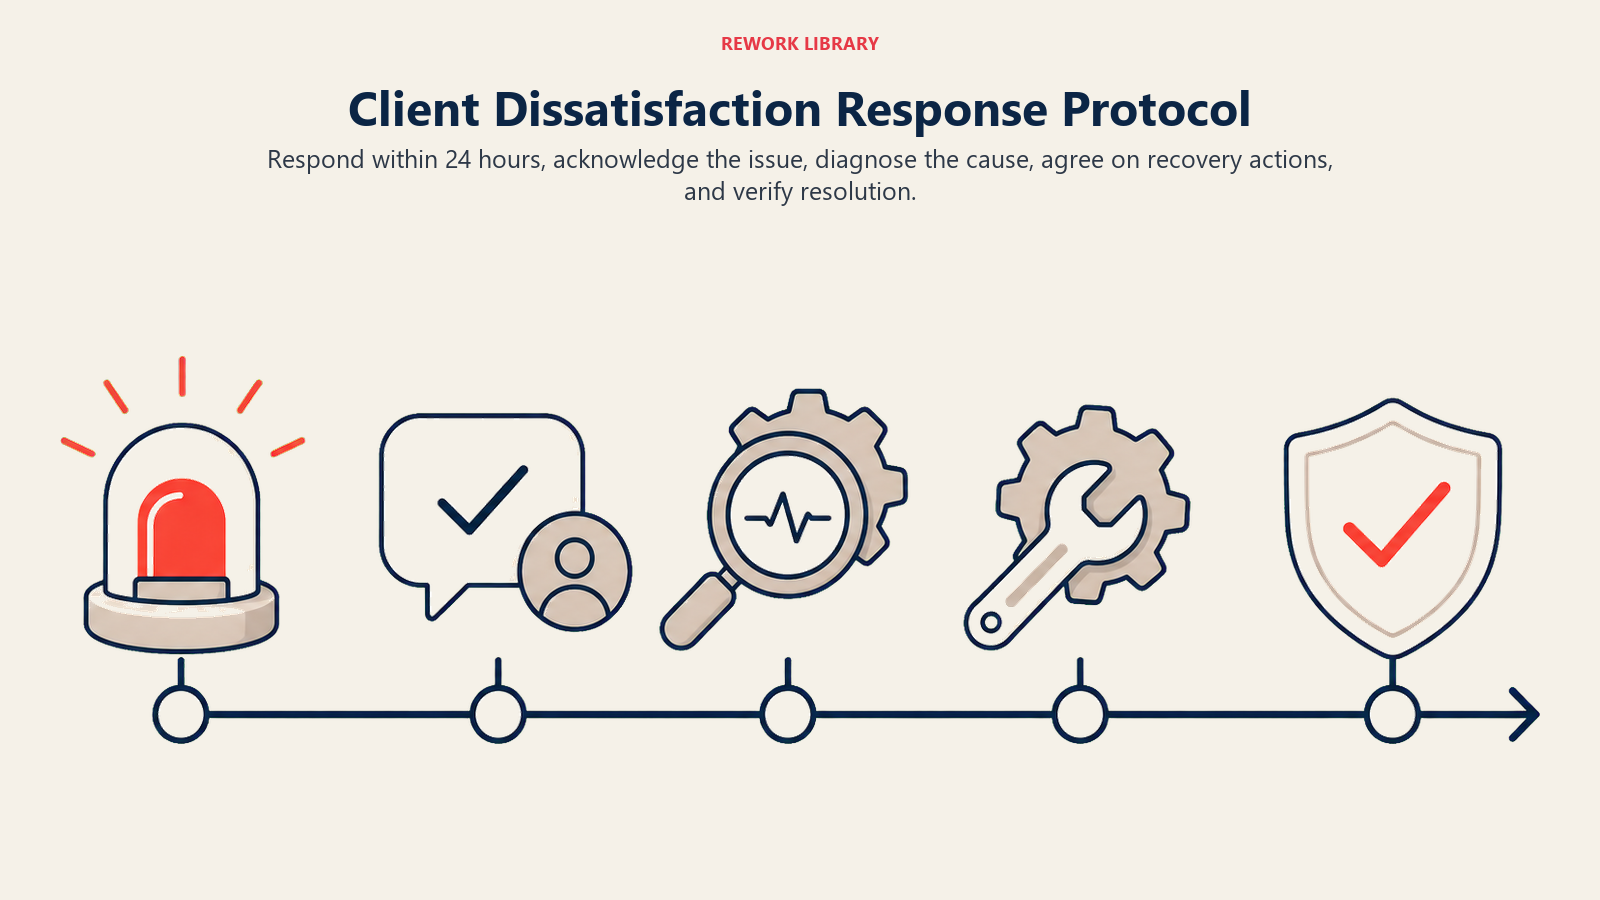
Dissatisfaction response protocol: When you detect a dissatisfied client:
- Acknowledge immediately (within 24 hours) - reach out to understand the issue
- Escalate appropriately - partner-level involvement for serious issues
- Create an action plan with specific commitments and timeline
- Communicate the plan to the client and get their buy-in
- Execute and follow up - do what you said, then confirm improvement
- Document learnings - what caused this and how do you prevent it?
Turning around dissatisfied clients is possible but requires genuine commitment. The clients most likely to turn around are those who:
- Feel heard and validated when they raise concerns
- See rapid, concrete action in response to their feedback
- Experience sustained improvement, not just a one-time fix
- Get accountability (not excuses) when things go wrong
The clients you'll lose are those who raised concerns that were ignored or minimized. Once they feel their feedback doesn't matter, the relationship is over.
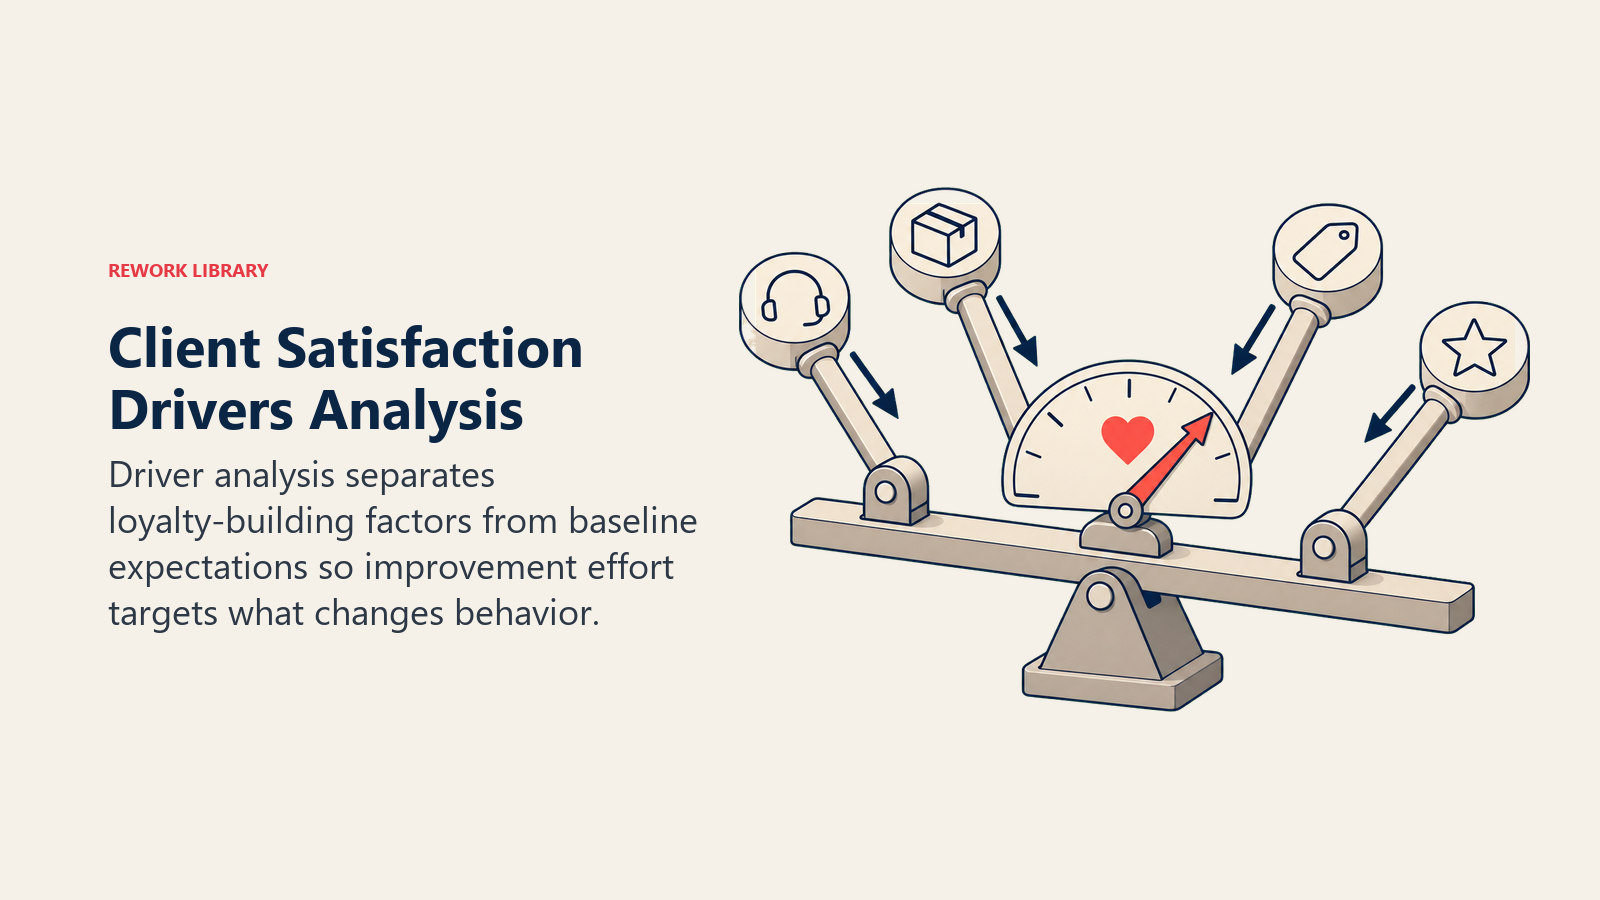
Satisfaction drivers analysis: what actually moves the needle
Not all satisfaction factors are created equal. Some drive loyalty and advocacy, others are just baseline expectations. You need to understand which is which. Identifying key drivers: Run correlation analysis on your satisfaction data. Which factors show the strongest relationship to overall NPS or renewal rates? Common satisfaction drivers in professional services:
- Outcome delivery: Did the work actually solve the business problem? (This is usually the #1 driver)
- Strategic insight: Did you bring ideas beyond the scope of work?
- Responsiveness: How quickly do you address questions and concerns?
- Relationship quality: Do clients feel like partners or vendors?
- Expertise credibility: Do they trust your knowledge and judgment?
- Communication clarity: Do they always understand status and next steps?
Less impactful factors (often assumed to matter more than they do):
- Pricing (if you're expensive but deliver value, satisfaction stays high)
- Individual deliverable polish (content matters more than formatting)
- Team tenure (new team members are fine if they're competent)
The analysis might surprise you. You might be investing heavily in beautifully designed reports when clients really just want faster response times and better strategic thinking.
Satisfaction by stakeholder role: Different roles care about different things.
Executives care about: business outcomes, strategic value, ROI visibility Project managers care about: communication, reliability, ease of working together Technical users care about: deliverable quality, methodology rigor, knowledge transfer Procurement cares about: budget adherence, transparent billing, contract compliance
If you measure satisfaction without segmenting by role, you'll average out these differences and miss important insights. The executive might be delighted while the project manager is frustrated, or vice versa.
Competitive differentiation: What drives satisfaction relative to competitors? Ask in your surveys: "What do we do better than other firms you've worked with?" and "What do other firms do better than us?"
This reveals your true differentiators. Maybe every firm in your space delivers on time, so timeliness doesn't differentiate you. But if you're the only firm that proactively identifies risks before clients notice them, that's a competitive advantage worth emphasizing.
Use satisfaction driver analysis to allocate improvement resources. If expertise credibility drives 40% of satisfaction variance but you're spending all your training budget on presentation skills, you're optimizing the wrong thing.
Continuous improvement systems: turning feedback into action
Collecting satisfaction data is pointless if it doesn't change behavior. You need structured feedback loops that turn insights into improvements. Feedback loop structure should follow this pattern:
- Collect: Gather satisfaction data through surveys, interviews, behavioral metrics
- Analyze: Look for patterns, segment by relevant dimensions, identify drivers
- Prioritize: Which issues impact the most clients or have the biggest impact?
- Act: Create improvement plans with owners and deadlines
- Measure: Track whether changes actually improve satisfaction
- Communicate: Share results with clients and teams to close the loop
Most firms stop after "analyze" or maybe "prioritize." The act and measure steps are where improvement happens.
Improvement planning needs to distinguish between:
Systemic improvements - changes to processes, standards, or capabilities that benefit all clients. Examples:
- Redesigning your onboarding process based on CES feedback
- Creating communication templates that ensure consistent updates
- Building deliverable quality assurance processes
- Training programs to address skill gaps
- Implementing better client feedback systems that capture input consistently
Client-specific improvements - fixes for individual relationship issues. Examples:
- Changing meeting cadence for a client who feels under-communicated with
- Staffing adjustments when team chemistry isn't working
- Custom reporting formats for specific client preferences
You need both, but systemic improvements have compound benefits. Fix the root cause once and it improves satisfaction across your entire client base.
Tracking satisfaction improvement over time:
- Monitor NPS/CSAT trends month-over-month and year-over-year
- Track specific improvement initiatives (did the new onboarding process increase satisfaction?)
- Measure satisfaction by cohort (are clients who started after the process change more satisfied?)
- Calculate satisfaction ROI (did retention or expansion increase after improvements?)
Common improvement patterns:
Communication improvements show up fast (within one quarter) - clients notice responsiveness changes immediately
Delivery quality improvements take longer (2-3 quarters) - you need to rebuild credibility
Strategic value improvements are hardest and slowest (6+ months) - this requires capability building and mindset shifts
Be patient but measure progress. If you've been "working on" the same satisfaction issue for a year with no measurable improvement, your approach isn't working.
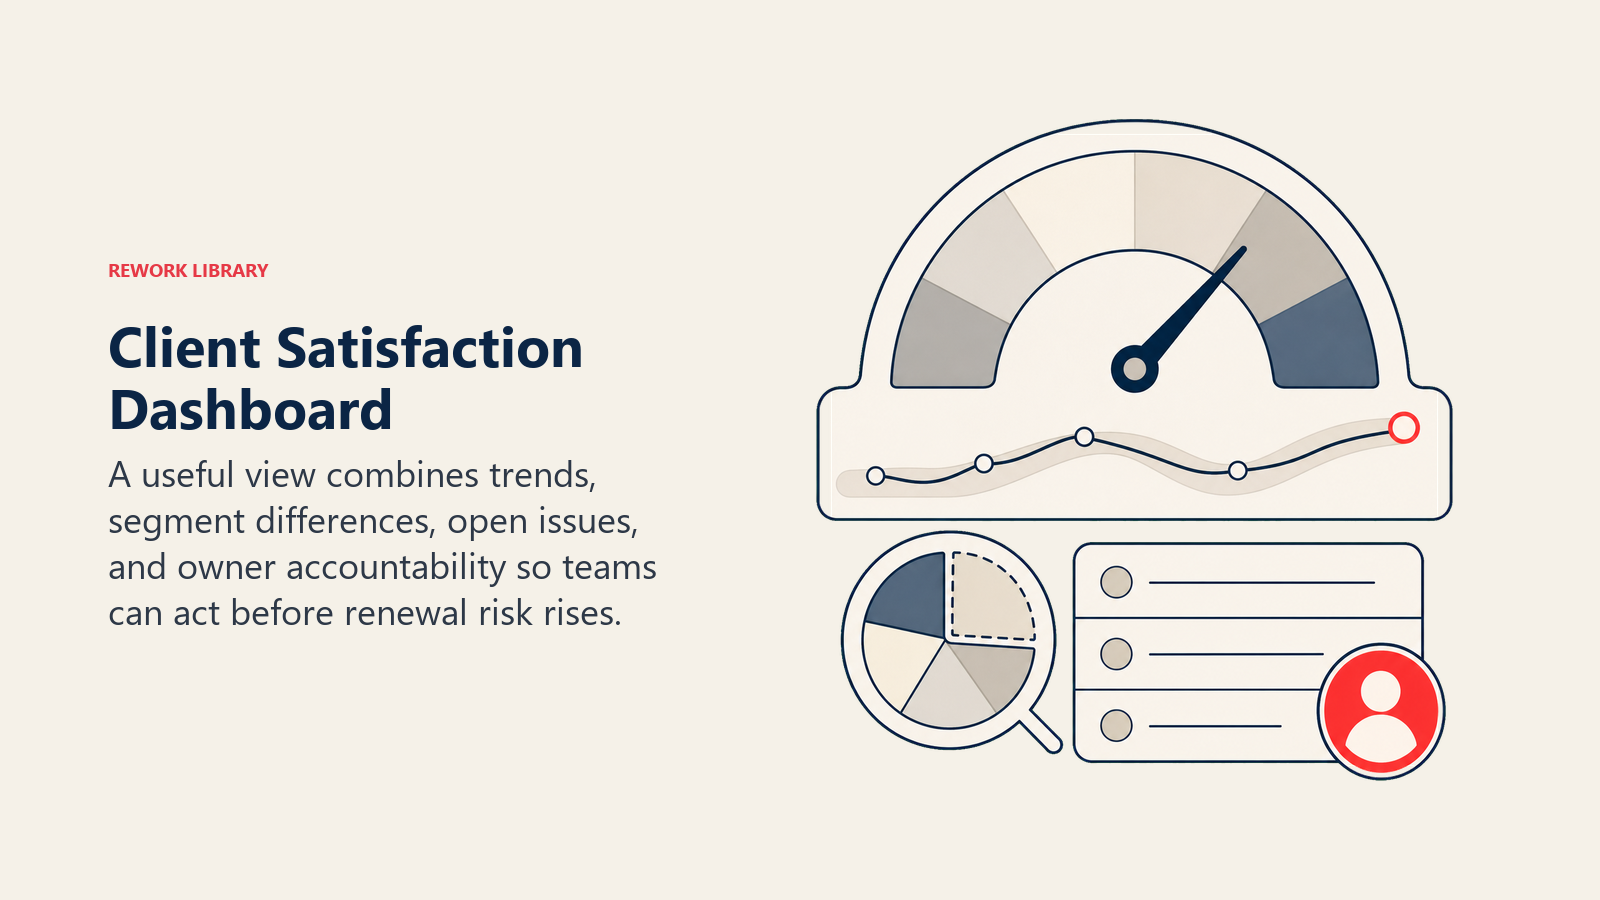
Analytics and reporting: making satisfaction visible
Satisfaction data is useless if it lives in spreadsheets nobody reads. You need dashboards and reports that drive action. Key metrics dashboard for operational teams:
- Overall NPS trend (monthly or quarterly)
- NPS by client segment (service line, size, tenure)
- CSAT scores by engagement
- CES scores for key processes
- Response rate to surveys
- Detractor count and escalation status
- Satisfaction vs profitability correlation
- Behavioral health indicators (renewal rate, expansion rate, referral rate)
This should be visible to delivery teams and updated regularly. When people can see the impact of their work on client satisfaction, behavior changes.
Leadership reporting should focus on:
- Executive summary (overall satisfaction trends and key insights)
- Satisfaction vs growth metrics (is there a relationship?)
- Competitive position (how do we compare to benchmarks?)
- Top satisfaction drivers and improvement priorities
- ROI of satisfaction initiatives
- Risk alerts (detractors, declining trends, at-risk renewals)
Keep it concise - leaders don't need 30 slides of survey results. They need the three most important insights and recommended actions.
Client-facing reporting can be powerful for transparency:
"Based on your feedback, here's what we've improved this quarter..."
- Implemented weekly status emails (you asked for better communication)
- Reduced deliverable revision cycles from 2.3 to 1.1 (you wanted faster iteration)
- Added strategic insights section to all reports (you wanted more proactive thinking)
This closes the loop and shows clients their feedback mattered. It also differentiates you from competitors who collect feedback and do nothing with it.
Reporting cadence:
- Real-time alerts for detractors (act immediately)
- Weekly operational metrics for delivery teams
- Monthly trend analysis for practice leaders
- Quarterly strategic reviews for executives
- Annual satisfaction reports for all clients
Technology and tools for satisfaction management
You can start with spreadsheets, but as you scale you'll need proper tools.
Survey platforms: Tools like Qualtrics, SurveyMonkey, Typeform, or Delighted handle survey distribution, response collection, and basic analysis. Look for:
- Customizable templates for NPS, CSAT, CES
- Automated distribution based on triggers (project completion, milestone reached)
- Response tracking and reminders
- Basic segmentation and trend analysis
- Integration with your CRM
CRM integration: Your satisfaction data should live in your CRM alongside client records. This lets you:
- View satisfaction scores on account pages
- Track satisfaction trends over engagement history
- Trigger workflows when scores drop below thresholds
- Correlate satisfaction with revenue, profitability, retention
- Include satisfaction in account health scoring
Most modern CRMs (Salesforce, HubSpot, Microsoft Dynamics) support custom fields and integration with survey platforms.
Text analytics for qualitative feedback: When you have hundreds of open-ended survey responses, reading them all manually is impractical. Text analytics tools can:
- Identify common themes across responses
- Track sentiment (positive, negative, neutral)
- Flag specific issues mentioned frequently
- Surface outlier responses that need attention
Even basic tools like word clouds or sentiment analysis add value. Advanced tools use NLP to categorize feedback automatically.
Predictive analytics: Once you have sufficient historical data, predictive models can forecast which clients are at risk based on satisfaction patterns. If you see NPS drop from 8 to 6 over two quarters, engagement decline, and slow payment, that's a client likely to churn. Early intervention can save the relationship.
You don't need enterprise-grade tools to start. Begin with simple survey distribution and manual analysis. Add sophistication as your program matures.
Satisfaction management by engagement type
Different service models require different satisfaction approaches.
Project-based engagements: Satisfaction measurement is straightforward - survey at key milestones and project completion. Focus on:
- Deliverable quality and relevance
- Meeting timelines and budgets
- Communication and responsiveness
- Knowledge transfer effectiveness
The challenge is maintaining relationships between projects. Don't go silent after project completion or you'll lose touch with satisfaction trends.
Retainer relationships: You need ongoing measurement, not just point-in-time surveys. Use:
- Quarterly NPS or relationship surveys
- Monthly pulse checks on recent work
- Regular business reviews with structured satisfaction discussion
- Behavioral monitoring (are they using their full retainer allocation?)
Retainer clients can become complacent - they're "satisfied enough" but not delighted. Push for continuous improvement.
Managed services: These are operational partnerships where satisfaction depends heavily on SLAs and performance metrics:
- Track operational KPIs (uptime, response time, resolution time)
- Measure CES for support interactions
- Monitor escalation patterns
- Survey quarterly on overall relationship health
The trap with managed services is focusing only on operational metrics while ignoring strategic satisfaction. Clients might be satisfied with your ticket response time but feel you're not adding strategic value.
Advisory relationships: These are relationship-intensive and satisfaction is subjective:
- Focus on strategic impact and insights quality
- Measure executive stakeholder satisfaction specifically
- Track advisory utilization (are they actually seeking your advice?)
- Monitor competitive references (do they mention you in strategic planning?)
Advisory satisfaction often correlates more with relationship quality than deliverable quality.
Building a satisfaction culture across your organization
Satisfaction management only works if the entire organization cares about it. That requires cultural change. Organizational alignment starts at the top. If partners don't care about satisfaction scores, nobody else will either. You need:
- Executive commitment (satisfaction as a strategic priority)
- Clear accountability (who owns satisfaction at the account level?)
- Resource allocation (time and budget for improvement)
- Consequences for poor performance (satisfaction tied to comp and promotion)
Client success programs formalize satisfaction management:
- Dedicated client success roles or teams
- Standardized onboarding processes
- Regular check-in cadences
- Escalation protocols for at-risk clients
- Success plans aligned with client outcomes
Even small firms can build lightweight client success processes. It doesn't require a full team - it requires discipline.
Training and enablement to build satisfaction capabilities:
- Communication skills training (active listening, expectation setting, difficult conversations)
- Relationship management training (building trust, reading client signals)
- Issue resolution process training (handling dissatisfaction, recovery strategies)
- Data literacy (understanding satisfaction metrics and how to improve them)
Most professional services training focuses on technical skills. Relationship and satisfaction skills get ignored. Flip that ratio.
Recognition and incentives: Celebrate teams and individuals who drive high satisfaction:
- Share client feedback (positive and constructive)
- Highlight satisfaction success stories in all-hands meetings
- Tie satisfaction metrics to bonuses or comp
- Include satisfaction in promotion criteria
- Create awards for client delight
When people see that satisfaction matters to their career progression, behavior changes.
Making satisfaction everyone's job: It's not just the account manager's responsibility. Everyone who touches a client impacts satisfaction:
- Delivery consultants affect quality and expertise perceptions
- Project managers affect communication and responsiveness
- Finance affects billing and invoicing experience
- Leadership affects strategic relationship strength
Create visibility into how each role impacts satisfaction and hold people accountable for their piece.
Common satisfaction management pitfalls
Measuring without action: The most common mistake. Firms send surveys, calculate scores, maybe create a PowerPoint, and then do nothing. Clients notice when their feedback is ignored, and they stop responding to future surveys.
Infrequent measurement: Only surveying annually or at renewal means you're finding out about problems way too late. By the time dissatisfaction shows up in an annual survey, the client might already be talking to competitors.
Single metric reliance: Using only NPS or only CSAT gives you a one-dimensional view. You need multiple metrics to understand the full picture: overall relationship health (NPS), specific experience quality (CSAT), and operational friction (CES).
Survey fatigue: Bombarding clients with constant feedback requests trains them to ignore all surveys. Be strategic about when and how often you ask.
Not segmenting stakeholders: Surveying only the account sponsor misses dissatisfaction among project teams or end users. Multi-stakeholder measurement is harder but more accurate. Your broader client retention strategy should account for all stakeholder perspectives.
Focusing on scores instead of drivers: Obsessing over whether your NPS is 47 or 51 misses the point. What matters is understanding why it's at that level and what would move it higher.
Defensive reactions to negative feedback: When clients share critical feedback, the natural response is to explain or justify. Resist that urge. Listen, acknowledge, and commit to improvement.
No closed-loop process: Collecting feedback but never telling clients what you did with it wastes an opportunity. Showing clients their input led to change builds trust and encourages future participation.
Where to go from here
Client satisfaction management is the foundation for long-term professional services success. Without systematic measurement and improvement, you're flying blind.
Start simple:
- Choose your core metric (NPS is a good starting point)
- Set up quarterly surveys for active clients
- Create a basic tracking dashboard
- Establish a response protocol for detractors
- Pick one improvement based on feedback and execute it
- Measure if satisfaction improves
Then expand:
- Add CSAT for project-level measurement
- Build behavioral indicators into your monitoring
- Create satisfaction reporting for leadership
- Develop continuous improvement processes
- Integrate satisfaction data into your CRM
The firms that win long-term are those that obsess over client experience. That means measuring it systematically, understanding what drives it, and continuously improving. Everything else - communication cadence, deliverable quality, issue resolution, project closeouts - ties back to satisfaction.
Your clients won't always tell you when they're unhappy. They'll just leave. Build the systems that surface dissatisfaction early and give you a chance to fix it before it's too late.
Frequently Asked Questions
Client Satisfaction Management FAQ
How does client satisfaction drive agency growth services?
Satisfied clients renew, buy more, and refer others, which are the three cheapest growth channels an agency has. Firms that measure and act on satisfaction see 25-40% higher retention, 2-3x more expansion revenue, and 50% more referrals, so satisfaction management functions as a growth engine, not just a service-quality check.
What's the difference between NPS, CSAT, and CES?
NPS measures overall relationship strength and advocacy (referral likelihood). CSAT measures satisfaction with a specific deliverable or touchpoint. CES measures how much effort it takes to work with you. You need all three: NPS predicts referrals, CSAT predicts repeat bookings, and CES predicts churn.
How often should an agency survey clients?
Use relationship surveys like NPS quarterly or semi-annually and always at renewal. Use transactional surveys like CSAT immediately after milestones, deliveries, or resolved issues. Surveying more than quarterly for relationship checks usually triggers survey fatigue and lower response rates.
Why do account managers misjudge how satisfied clients are?
Relationship managers consistently overrate satisfaction because they hear from the people who engage and miss the silent stakeholders planning to leave. One study found account managers rated relationships "excellent" in 89% of cases where the client was actually planning to leave, which is why behavioral signals and multi-stakeholder surveys matter more than gut feel.
What's the fastest way to start measuring satisfaction?
Pick one core metric (NPS is a good default), run quarterly surveys for active clients, build a simple tracking view, and set a 24-hour response protocol for detractors. Act on the first round of feedback, then expand to CSAT and behavioral indicators once the loop is working.
NPS Survey Template
Email Subject: Quick question: How likely would you recommend [Firm Name]?
Email Body:
Hi [Name],
We'd love your quick feedback on working with us.
On a scale of 0-10, how likely are you to recommend [Firm Name] to a colleague or peer?
[0] [1] [2] [3] [4] [5] [6] [7] [8] [9] [10]
Not at all likely → Extremely likely
What's the main reason for your score?
[Open text field]
This takes less than 60 seconds, and we use your feedback to improve how we serve you.
Thanks, [Partner Name]
Follow-up for Promoters (9-10):
Thank you for the high rating! We're glad to hear we're meeting your expectations.
Would you be willing to:
- Provide a brief testimonial we could share?
- Refer us to colleagues facing similar challenges?
- Participate in a case study about our work together?
[Links to relevant forms]
Follow-up for Passives (7-8):
Thank you for your feedback. We're glad the relationship is working, but we want to do even better.
What's one thing we could improve that would move your rating higher?
[Open text field]
We'll review your input and follow up on how we're addressing it.
Follow-up for Detractors (0-6):
Thank you for being honest with us. We take your feedback seriously.
[Engagement Partner Name] will reach out within 24 hours to discuss your concerns and create an action plan to address them.
In the meantime, if there's an urgent issue, please contact [Partner] directly at [phone/email].
CSAT Questionnaire (Post-Project)
Email Subject: How did we do on [Project Name]?
Email Body:
Hi [Name],
Now that [Project Name] is complete, we'd appreciate your feedback on the experience.
Overall, how satisfied were you with this project?
⭐ Very Dissatisfied ⭐⭐ Dissatisfied ⭐⭐⭐ Neutral ⭐⭐⭐⭐ Satisfied ⭐⭐⭐⭐⭐ Very Satisfied
Please rate the following aspects of the project (1=Very Dissatisfied, 5=Very Satisfied):
- Quality of deliverables: [1] [2] [3] [4] [5]
- Timeliness and meeting deadlines: [1] [2] [3] [4] [5]
- Communication and responsiveness: [1] [2] [3] [4] [5]
- Expertise and knowledge: [1] [2] [3] [4] [5]
- Value for investment: [1] [2] [3] [4] [5]
What did we do well?
[Open text field]
What could we have done better?
[Open text field]
Would you work with us again on future projects?
- Yes, definitely
- Probably
- Unsure
- Probably not
- No
Thank you for your time. We'll review your feedback and reach out if we need clarification or want to discuss improvements.
Dissatisfaction Response Protocol
When a client is identified as dissatisfied (NPS 0-6, CSAT 1-2, or behavioral red flags): Within 24 hours:
Engagement partner acknowledges the issue
- Personal outreach (phone call preferred over email)
- Express appreciation for the feedback
- Listen without defending or justifying
- Commit to understanding and addressing the issue
Schedule deep-dive conversation
- Within 3-5 business days
- Include relevant team members
- Prepare by reviewing account history and potential root causes
Within 1 week:
Conduct root cause analysis
- What specifically caused dissatisfaction?
- How long has this been an issue?
- What other factors might be contributing?
- Is this a systemic issue or unique situation?
Create action plan
- Specific commitments with owners and deadlines
- Address both immediate issue and prevent recurrence
- Include client in plan validation
Within 2 weeks:
- Present and execute action plan
- Share plan with client and get buy-in
- Execute commitments on timeline
- Communicate progress proactively
- Don't wait for client to ask for updates
Within 1 month:
- Follow up and validate improvement
- Check in with client on whether they see improvement
- Re-survey if appropriate
- Document lessons learned
- Share insights with broader team to prevent similar issues
Escalation criteria:
- Client threatens to terminate or not renew → Immediate practice leader involvement
- Multiple stakeholders express dissatisfaction → Full account review with leadership
- Issue stems from team behavior or ethics → HR/leadership involvement
- Financial dispute involved → Include finance/contracts team
Communication templates:
Initial outreach (phone script):
"Hi [Name], I saw your feedback on [survey/project] and wanted to reach out personally. First, thank you for being honest with us. I know it's not always easy to share critical feedback. I'd like to understand what happened from your perspective so we can make this right. Do you have 15 minutes this week to walk me through what went wrong?"
Action plan presentation (email):
"Hi [Name],
Thank you for taking time to discuss the issues with [project/relationship]. I want to follow up on our conversation with specific commitments:
What went wrong: [Brief acknowledgment of the issue]
What we're doing about it:
- [Specific action, owner, deadline]
- [Specific action, owner, deadline]
- [Specific action, owner, deadline]
How we'll prevent this in the future: [Systemic change]
I'll check in with you [specific date] to ensure we're addressing your concerns effectively. If anything else comes up before then, please reach out to me directly.
Thanks again for your patience as we work through this.
[Partner Name]"
Follow-up validation (phone script):
"Hi [Name], I wanted to check in on the improvements we committed to [timeframe] ago. Have you seen the changes we discussed? Is the situation better from your perspective? What else do we need to address?"
Satisfaction Trend Dashboard
Dashboard Components:
Overall Health Score (Top KPI)
- Current NPS: [Score]
- Change from last quarter: [+/- X points]
- % Promoters | % Passives | % Detractors
- Trend line (12-month rolling)
Satisfaction by Segment | Segment | NPS | CSAT | Change | At-Risk Count | |---------|-----|------|---------|---------------| | Enterprise Clients | 58 | 4.2/5 | +3 | 2 | | Mid-Market Clients | 45 | 3.8/5 | -2 | 5 | | Practice Area 1 | 62 | 4.4/5 | +5 | 1 | | Practice Area 2 | 38 | 3.5/5 | -8 | 7 |
Top Satisfaction Drivers (Correlation Analysis)
- Strategic insight delivery (r=0.72)
- Responsiveness to requests (r=0.68)
- Outcome achievement (r=0.65)
- Relationship quality (r=0.61)
- Communication clarity (r=0.58)
Detractor Watch List | Client | Current NPS | Trend | Issue Summary | Owner | Action Status | |--------|-------------|-------|---------------|-------|---------------| | Acme Corp | 4 | ↓ | Communication gaps, missed deadline | Partner A | Action plan in progress | | Beta Inc | 5 | → | Deliverable quality concerns | Partner B | Meeting scheduled |
Behavioral Health Indicators
- Retention rate: [X%] (vs [Y%] target)
- Expansion rate: [X%] (vs [Y%] target)
- Referral rate: [X%] (vs [Y%] target)
- Average project profitability (Promoters vs Detractors): [Comparison]
Survey Response Metrics
- Response rate (last 30 days): [X%]
- Responses by type: NPS | CSAT [Y] | CES [Z]
- Average time to response: [X days]
Improvement Initiative Tracking | Initiative | Target Metric | Baseline | Current | Goal | Status | |------------|---------------|----------|---------|------|--------| | Improve onboarding CES | CES Score | 5.2/7 | 5.8/7 | 6.2/7 | On track | | Increase strategic insight | NPS Driver Score | 3.8/5 | 4.1/5 | 4.5/5 | On track | | Reduce response time | Avg Response Time | 18 hrs | 12 hrs | 8 hrs | Ahead |
Alerts & Actions Required 🚨 3 clients below NPS 6 requiring immediate outreach ⚠️ Mid-market segment trending down (-2 points this quarter) ✅ Practice Area 1 trending up (+5 points this quarter) - document best practices
Usage Notes:
- Update monthly minimum, weekly ideal
- Share with all partners and practice leaders
- Review in monthly leadership meetings
- Drill down by clicking segment rows for detailed client lists
- Export detractor list for CRM integration and workflow triggers

Senior Operations & Growth Strategist
On this page
- Defining client satisfaction beyond simple happiness
- Satisfaction measurement framework: choosing your approach
- Net Promoter Score (NPS): measuring advocacy and referral likelihood
- Customer Satisfaction Score (CSAT): project and touchpoint measurement
- Customer Effort Score (CES): measuring friction and ease of working together
- Survey strategy: frequency, timing, and design
- Identifying and managing dissatisfaction early
- Satisfaction drivers analysis: what actually moves the needle
- Continuous improvement systems: turning feedback into action
- Analytics and reporting: making satisfaction visible
- Technology and tools for satisfaction management
- Satisfaction management by engagement type
- Building a satisfaction culture across your organization
- Common satisfaction management pitfalls
- Where to go from here
- Frequently Asked Questions
- NPS Survey Template
- CSAT Questionnaire (Post-Project)
- Dissatisfaction Response Protocol
- Satisfaction Trend Dashboard