Campaign Results Reporting: Demonstrating Value to Clients Through Data-Driven Storytelling
Turn this article into takeaways for your work.
Each assistant summarizes the article only for you and suggests best practices for your work.
Here's something most agencies learn the hard way: you can run the most brilliant campaign in history, but if you can't explain the results in a way that makes the client feel smart for hiring you, none of it matters. The campaign report isn't just a data dump. It's your case for renewal, your proof of value, and your best shot at turning a project client into a long-term retainer.
Bad reporting costs agencies millions in lost renewals. Clients who don't understand what you delivered won't renew, won't refer, and definitely won't expand the scope. Yet most agencies treat reporting like homework, something to rush through and send off at the last minute.
This guide shows you how to design results reporting that translates metrics into business impact, builds client confidence, and positions you as a strategic partner who actually moves the needle. We'll cover measurement frameworks, storytelling techniques, and presentation strategies that turn numbers into narratives clients care about. Effective reporting is essential to the marketing agency growth model.
Why results reporting drives client retention
Client retention in agency work boils down to one question: "What did we get for our money?" If clients can't answer that clearly, they'll find someone else next quarter.
Results reporting is your opportunity to control that narrative. A strong report doesn't just show what happened. It explains why it happened, what it means for the business, and what comes next. That's the difference between clients who see you as a vendor executing tasks and clients who see you as a partner driving outcomes.
The agencies that master reporting have retention rates above 90%. The ones that don't lose clients even when the campaigns perform well, because nobody can see the performance clearly enough to appreciate it.
Think about it from the client's perspective. They're spending real budget on your work. Their boss is asking what they got for it. If your report makes them look good in that conversation, you've just become indispensable. If your report leaves them scrambling to explain the value, you're on borrowed time.
The strategic role of reporting in client relationships
Reporting isn't a deliverable. It's relationship management. Every report is an opportunity to:
Reinforce your strategic value: When you connect campaign metrics to business outcomes, you're showing that you understand their goals, not just your tactics. A report that says "we drove 2,000 website visits" is tactical. A report that says "we drove 2,000 website visits from your target accounts, resulting in 47 sales-qualified leads worth an estimated $470K in pipeline" is strategic.
Build trust through transparency: The agencies clients trust most are the ones who share bad news early and with context. If part of the campaign underperformed, say so, then explain why and what you're doing about it. Clients respect honesty more than they respect perfection.
Educate clients on what success looks like: Many clients don't understand marketing metrics. Your reports train them on what to pay attention to. When you consistently show how engagement metrics predict pipeline, you're teaching them to value the right things.
Set up the next conversation: Every report should end with recommendations. What's working that deserves more investment? What needs adjustment? What new opportunity did the data reveal? Reports that stop at "here's what we did" miss the chance to drive the relationship forward.
The best agency-client relationships have reporting built into regular check-ins, not treated as a separate obligation. When reporting is integrated into your communication rhythm, it becomes a strategic conversation instead of a compliance exercise.
Pre-campaign measurement planning
If you want reporting to be easy and impactful, you need to plan for it before the campaign starts. Too many agencies launch campaigns, then scramble later to figure out what to measure. That's backwards.
Establish baseline metrics: Before you change anything, document the current state. What's the conversion rate now? What's the average deal size? What's the cost per lead? If you can't show before/after, you can't prove impact.
Align on success criteria: Get the client to define what success looks like in their own words. "Increase brand awareness" is too vague. "Achieve 30% aided recall among target accounts within 90 days" is measurable. Document these agreed-upon goals because they become your reporting north star.
Set measurement infrastructure: Make sure tracking is in place before launch. UTM parameters configured. Conversion pixels fired. CRM integration tested. The worst reporting problems happen when you realize three weeks in that you're not capturing the data you need.
Define reporting cadence and format: Agree upfront on how often you'll report and in what format. Weekly dashboard reviews? Monthly written reports? Quarterly business reviews? Setting expectations early prevents the client from demanding custom reports on random schedules.
Pre-campaign alignment takes maybe two hours but saves dozens of hours over the campaign life. It also dramatically reduces "but we thought success meant X" conversations later. This alignment should be documented in your creative brief.
KPI alignment with client goals
Not all metrics matter equally. The KPIs you report should map directly to what the client cares about, and that varies based on their business stage, industry, and specific challenges.
For awareness campaigns: Reach, impressions, and engagement among target audiences matter. But connect them to outcomes. Don't just report "500K impressions" - report "500K impressions delivered to decision-makers at target accounts, with 12% engagement rate vs 4% industry average."
For consideration campaigns: Content consumption, time on site, return visits, and nurture progression. The client wants to know if people are actually learning about their solution. Track progression through the funnel, not just top-of-funnel volume.
For conversion campaigns: Lead volume, lead quality, cost per acquisition, and conversion rates at each stage. But go deeper - break down performance by segment, channel, and creative approach to show what's working.
For retention campaigns: Engagement metrics, customer satisfaction scores, repeat purchase rates, and lifetime value trends. Show how the campaign impacts customer behavior over time.
The mistake most agencies make is reporting every metric they track. That's information overload. Pick the 5-8 KPIs that actually tell the story of whether the campaign achieved its goal. Everything else is supporting detail.
And this matters: always report metrics in the context the client understands. If they run their business on pipeline dollars and close rates, translate your metrics into pipeline impact. If they care about customer lifetime value, connect your metrics to LTV trends. Speak their language, not yours.
Strategic vs tactical metrics
There's a hierarchy to metrics, and knowing which level to emphasize changes everything.
Strategic metrics connect to business outcomes. Revenue generated. Pipeline created. Market share gained. Customer acquisition cost. Lifetime value. These are the metrics executives care about because they directly impact business performance.
Tactical metrics show campaign execution. Click-through rates. Engagement rates. Impressions delivered. Ad frequency. These prove you did the work, but they don't prove the work mattered.
Your reports need both, but they need to be layered correctly. Lead with strategic metrics. That's what the client hired you for. Then use tactical metrics to explain how you achieved the strategic results.
Here's the structure that works: Start your report with the business impact summary. "This campaign generated 78 qualified leads worth an estimated $780K in pipeline, at a customer acquisition cost 23% below target." That's the headline.
Then break down how you got there. "We achieved this through a multi-channel approach that delivered 45K impressions to target accounts, drove 2,300 website visits, and converted at 3.4% - significantly above the 1.8% baseline."
When clients see strategic impact first, they trust the tactical execution. When you lead with tactical metrics and hope they connect the dots to business value, you're making them do the work. Don't do that. This approach aligns with value-based pricing principles.
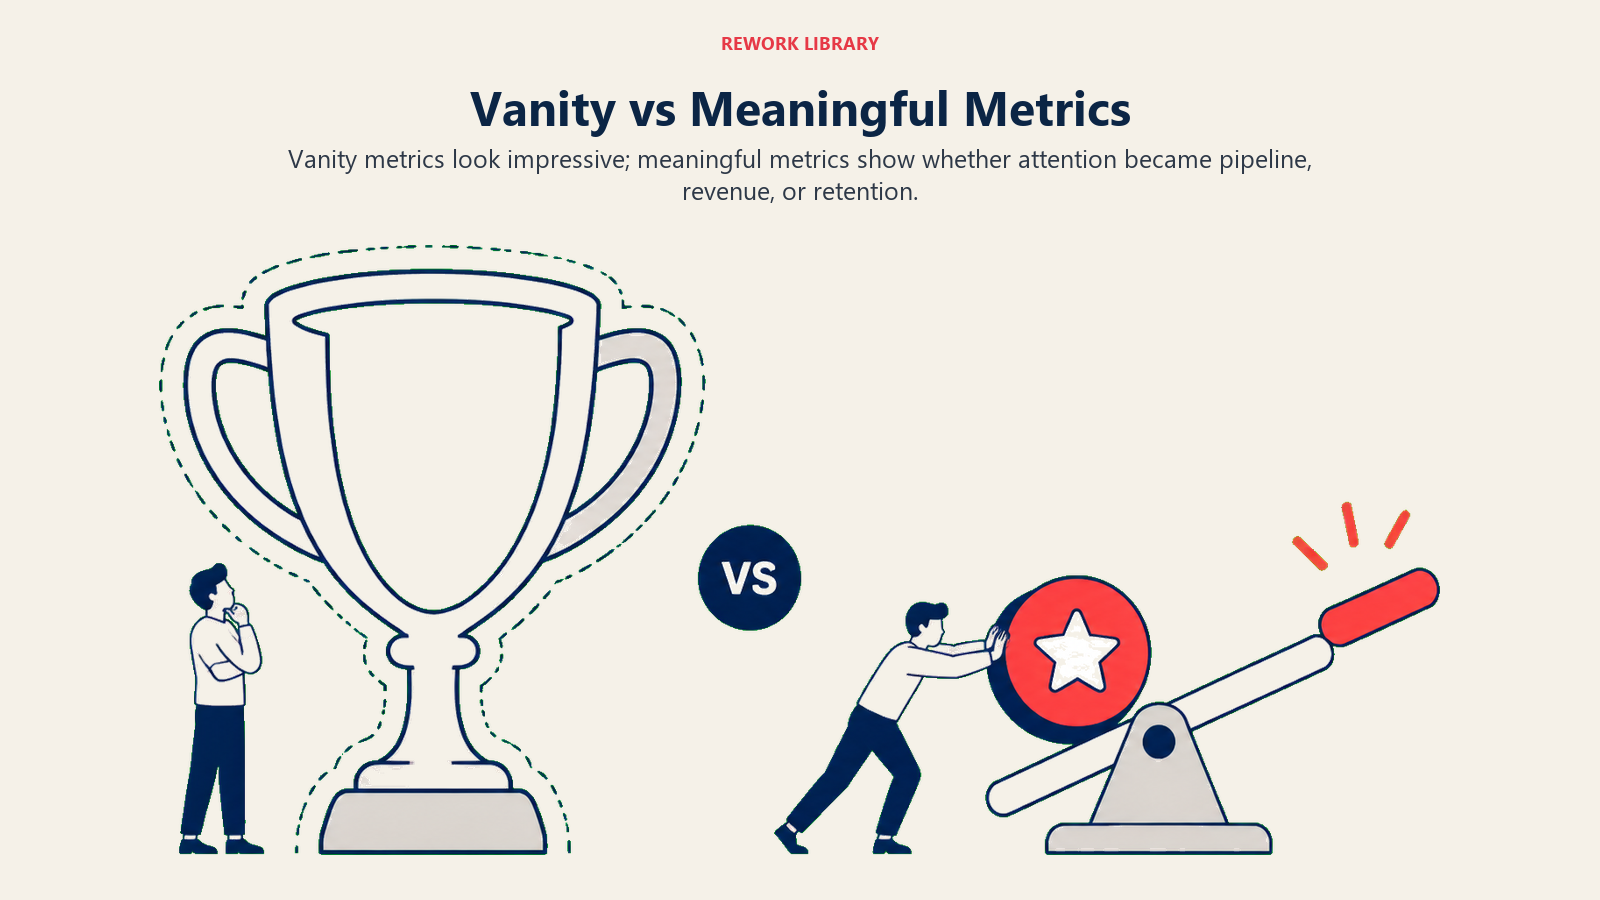
Vanity vs meaningful metrics
Let's talk about the metrics that feel impressive but mean nothing. Vanity metrics make your charts look good without proving actual value.
Classic vanity metrics: Total impressions without reach. Social media followers without engagement. Email subscribers without open rates. Website traffic without conversion tracking. These numbers can grow while business results stagnate.
Why clients fall for them: Big numbers feel good. "500K people saw our ad!" sounds impressive in a meeting. But if those 500K people weren't potential buyers, the impressions are worthless.
How to spot vanity metrics: Ask "so what?" If the metric goes up but nothing else changes about the business, it's vanity. If followers double but sales stay flat, follower count is vanity in your context.
Meaningful alternatives: Replace vanity metrics with outcome-connected versions:
- Instead of "total impressions," report "impressions among target accounts"
- Instead of "follower growth," report "engagement rate from target audience segments"
- Instead of "website traffic," report "traffic from target personas with conversion intent signals"
Here's the test: Can you tie the metric to revenue or strategic goals? If not, it's probably vanity. There are exceptions - early-stage awareness campaigns might track reach before they can track conversions. But even then, you should be qualifying that reach. Not all eyeballs are equal.
The agencies that build long-term client relationships are the ones who educate clients away from vanity metrics and toward meaningful ones. It might mean smaller numbers in your reports, but those numbers will correlate with business success - and that's what drives renewals.
Dashboard design principles
Raw data doesn't communicate. You need visualization that makes insights obvious at a glance.
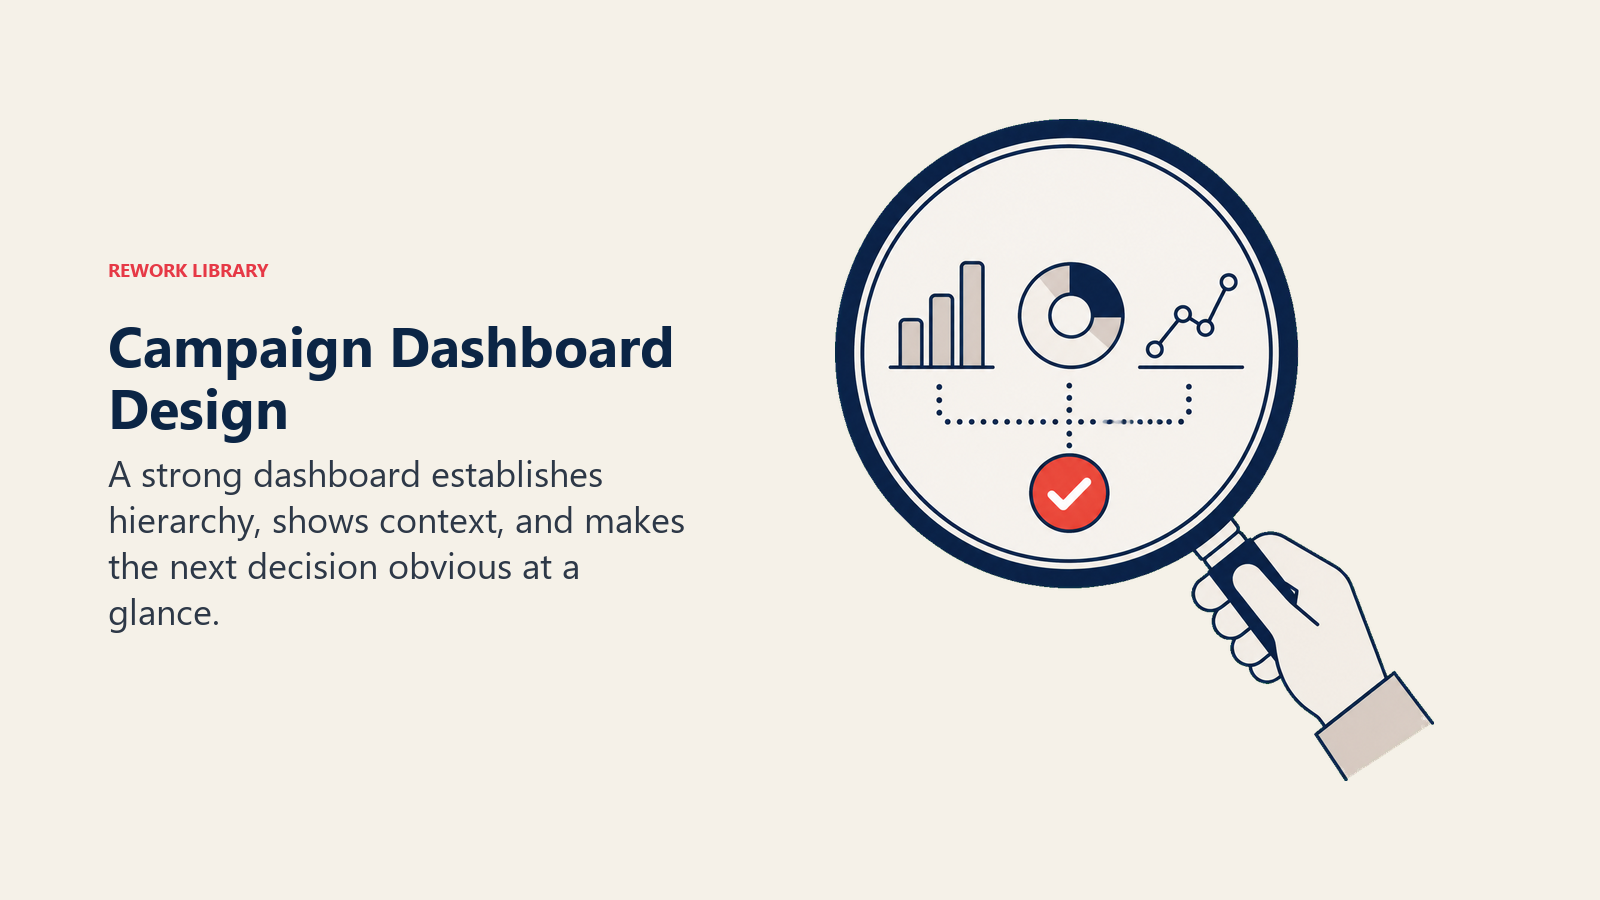
Start with the hierarchy: Most important metrics go at the top, largest size, with clear comparison context. If lead generation is the primary goal, lead volume and quality should dominate the first screen. Everything else supports that story.
Use visual encoding correctly: Color means something. Red for below target, green for exceeding, gray for neutral. Be consistent across all reports. Don't make clients relearn your color coding each time.
Show trends, not just snapshots: A single number tells you where you are. A trend line tells you where you're going. Always include time-series comparison - week over week, month over month, or against the baseline.
Provide context for interpretation: "1,200 leads" means nothing without context. "1,200 leads (target was 1,000)" tells the client if that's good. "1,200 leads at $42 CPL vs $65 target CPL" tells them it's not just good, it's efficient.
Limit charts per view: If a dashboard has 20 charts, nobody knows where to look. Aim for 6-8 key visualizations per view. Create separate views for deep dives, but the executive summary should fit on one screen.
Make it scannable: Busy executives will glance at your dashboard for 30 seconds. What do you want them to see in that time? Put that front and center. Everything else can be a click deeper.
Mobile-friendly matters: Clients review dashboards on phones. If your layout requires a 27-inch monitor to parse, you've lost them. Test your dashboards on mobile devices.
And a practical tip: avoid overly clever visualizations. Pie charts, radar charts, and 3D effects look fancy but take cognitive effort to decode. Bar charts, line graphs, and simple tables communicate faster. Boring is fine if it's clear.
Executive vs operational views
Not everyone needs the same report. Your contact at the client might love diving into channel-level attribution, but their CMO wants the three-sentence version.
Executive view: High-level summary focused on business outcomes. Total pipeline generated, cost efficiency vs target, strategic insights. One page maximum. This is for the person who needs to report up or justify the budget.
Manager view: Campaign performance by channel, segment, and tactic. What's working and what's not. Recommendations for optimization. This is for the person making day-to-day decisions.
Analyst view: Granular data for people who need to dig into specifics. Raw numbers, detailed attribution, cohort analysis. This is for the person trying to understand the "why" behind performance.
Create templates for each audience level. Don't make executives wade through 40 pages to find the summary. Don't make analysts work with dumbed-down data.
A smart structure is a tiered report: executive summary on page one, manager details in the following sections, analyst appendix at the end. Everyone gets what they need without scrolling past what they don't.
Data collection and quality assurance
Great reporting starts with trustworthy data. If clients catch errors in your reports, they'll question everything you deliver.
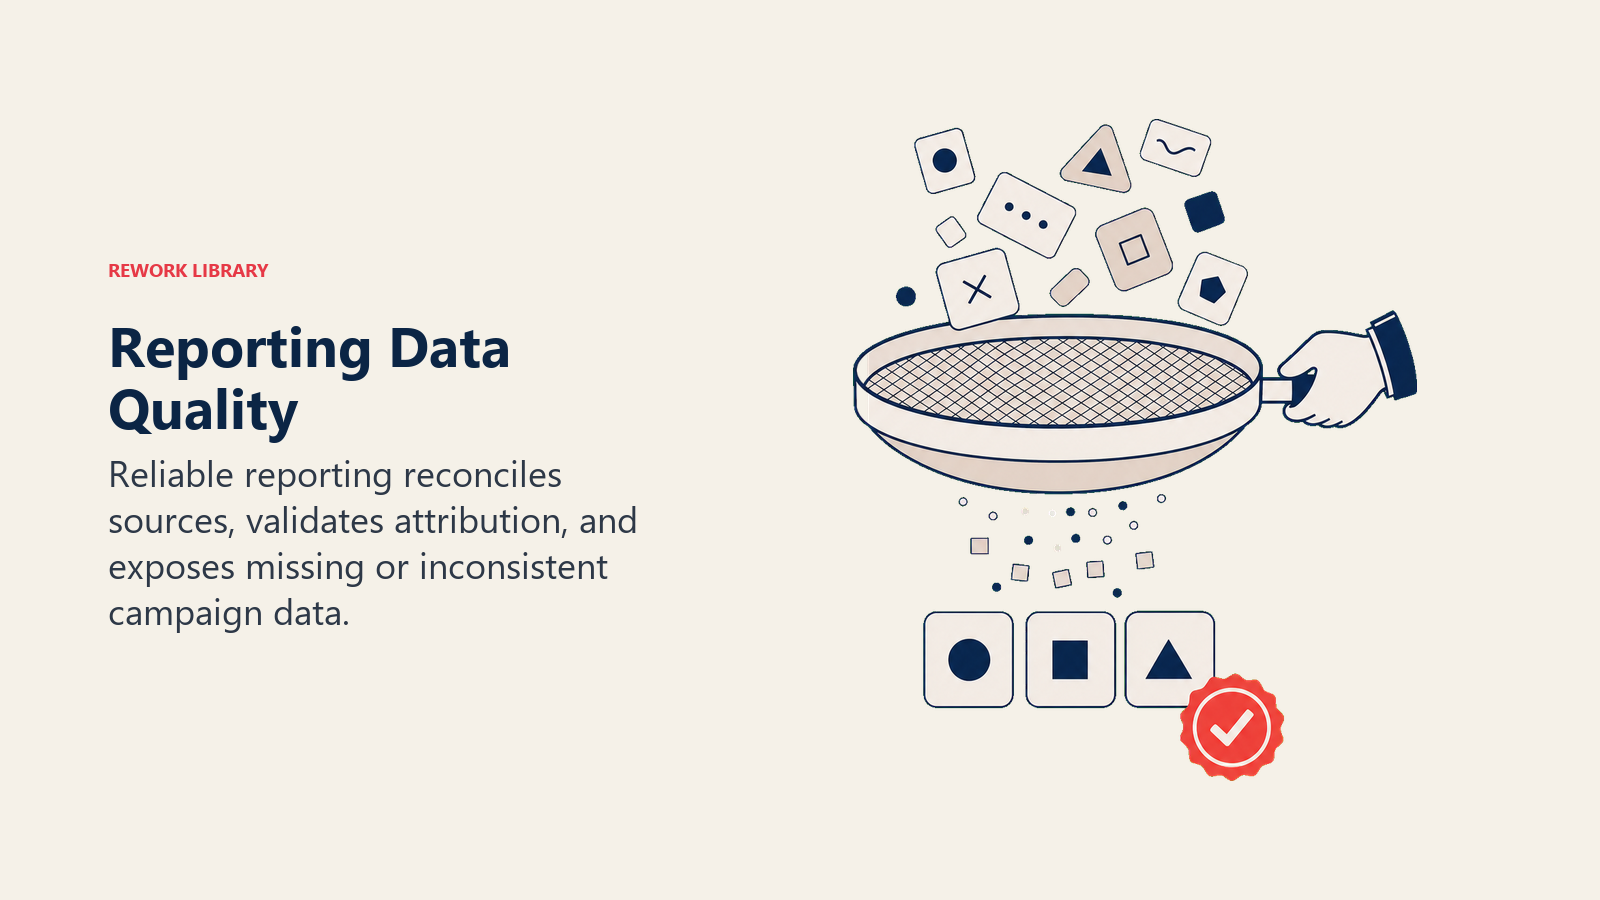
Multi-platform integration: Campaigns run across multiple channels - social, search, display, email, CRM. Your reporting needs to pull from all sources into a unified view. That usually means integrating platforms through APIs, data connectors, or centralized analytics tools.
Attribution challenges: When a lead touches five different channels before converting, which one gets credit? Last-touch attribution is easy but misleading. First-touch ignores the nurture journey. Multi-touch attribution is more accurate but complex to implement. Pick an attribution model, document it clearly, and stick with it consistently so clients can compare periods.
Data validation protocols: Before you send a report, check it. Do the totals add up? Do the percentages make sense? Does this month's data connect logically to last month's? Spot-check numbers against source platforms to catch integration errors.
Privacy and compliance: With GDPR, CCPA, and other regulations, you can't track everything you used to. Be transparent about data limitations. If you're missing conversion data due to iOS privacy changes, say so. Clients appreciate honesty about constraints.
Quality assurance checklist: Before publishing any report, verify:
- Data sources are connected and refreshed
- Date ranges are correct and consistent
- Calculations are accurate (manually verify a sample)
- Visualizations match the underlying data
- Comparisons use like-for-like periods
- Spelling, grammar, and client name are correct (yes, agencies have sent reports with the wrong client name)
Invest in data infrastructure early. The agencies that build robust data pipelines save hours per report and deliver more reliable insights. The ones that manually copy-paste data from platforms into spreadsheets make errors and burn time.
Storytelling with data
Data without narrative is just numbers. Your job is to make the data tell a story that clients remember.
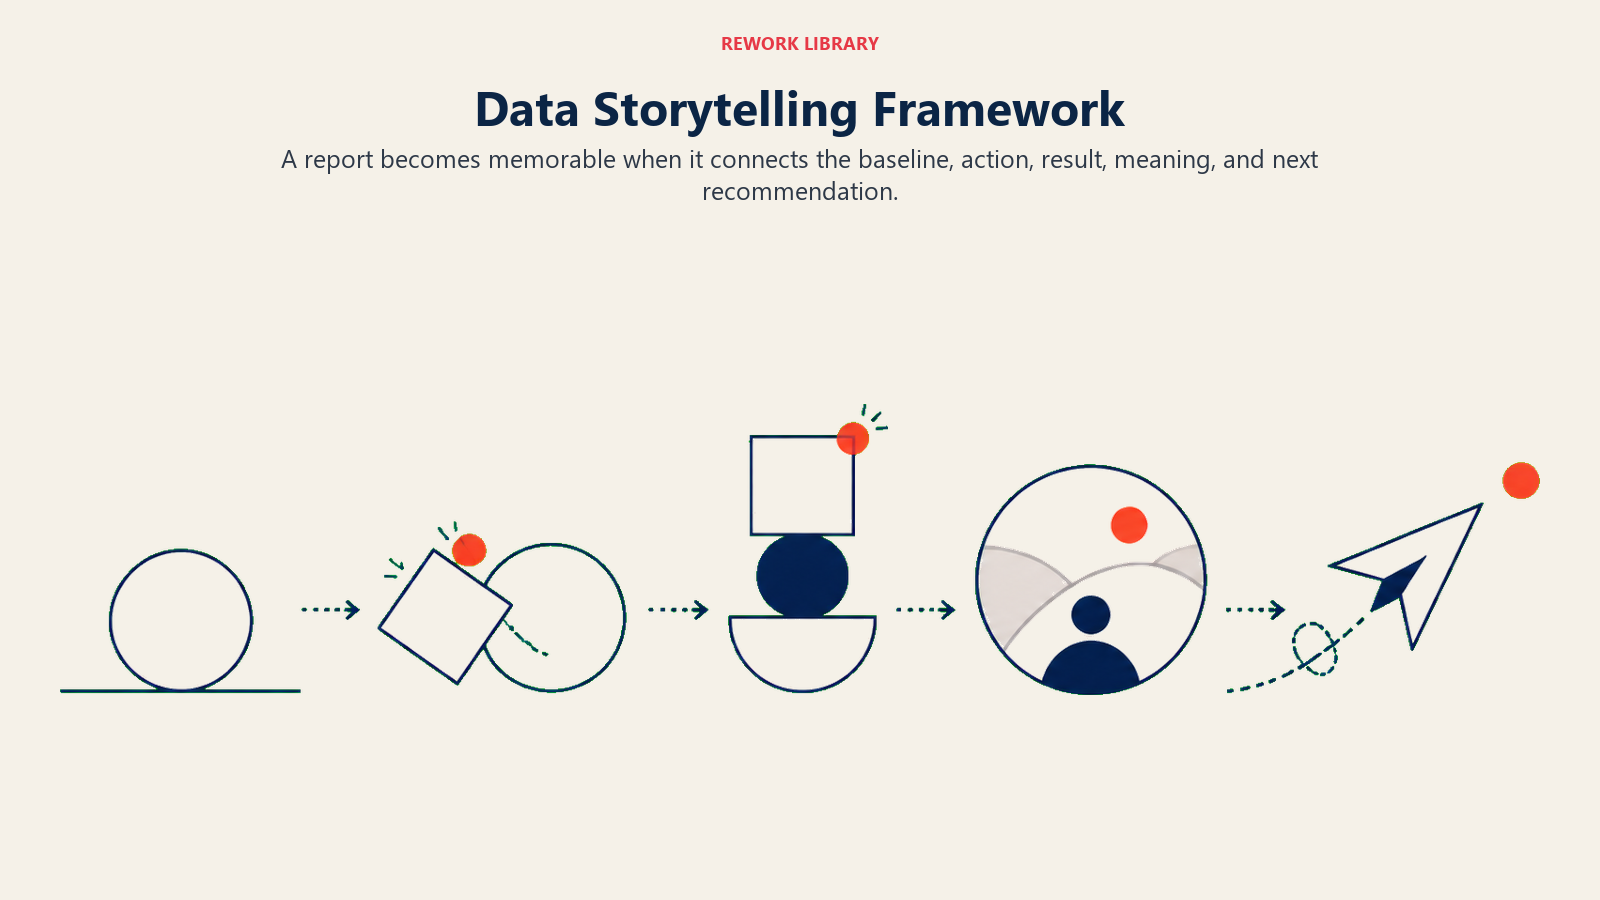
The narrative framework: Every report should follow a story arc:
- Where we started (baseline or goal)
- What we did (campaign tactics)
- What happened (results with context)
- What it means (business impact)
- What comes next (recommendations)
Moving from metrics to insights: An insight explains why a metric changed or what the client should do about it. "Click-through rate increased 15%" is a metric. "Click-through rate increased 15% after we refined our audience targeting to focus on mid-market IT buyers, suggesting this segment is more responsive to our messaging" is an insight.
Before/after transformations: Clients love seeing the journey. Show where they were before the campaign, where they are now, and where they're heading. Visual before/after comparisons make impact tangible.
Highlight unexpected findings: The best reports don't just confirm what everyone expected - they reveal something new. "We discovered that leads from organic social convert at 2x the rate of paid social, suggesting we should shift budget allocation." That's the kind of insight that makes clients lean in.
Use specific examples: Instead of "the campaign drove engagement," say "the campaign drove 342 comments, 89 email replies, and 23 LinkedIn messages from target accounts." Specificity is believable. Generalities sound like spin.
Create a throughline: Each section of your report should connect to the next. Don't just list metrics - explain how one result led to another. "High engagement on thought leadership content drove traffic to product pages, which then converted to demo requests at 4.2%."
Addressing underperformance transparently
This is where most agencies panic. Something didn't work. What do you tell the client?
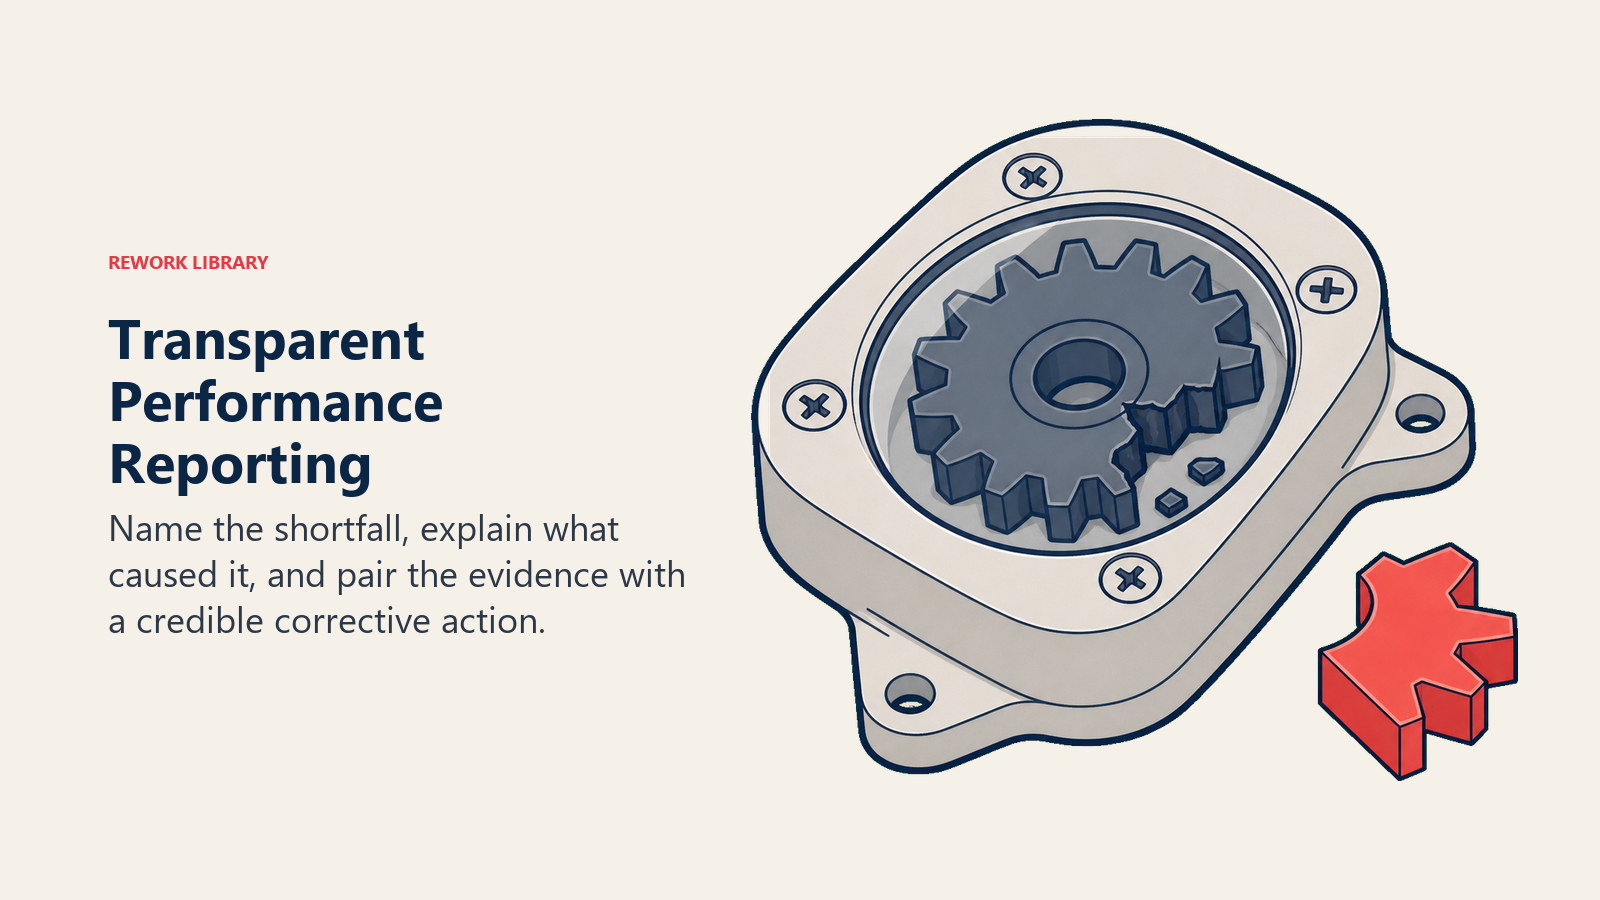
The answer: the truth, with context and a plan.
Name the problem directly: "The paid search campaign underperformed our lead generation target by 30%." Don't bury bad news or hope they don't notice. Lead with it.
Explain what you learned: "Analysis shows that our keyword targeting was too broad, resulting in clicks from people outside our target persona. We've since refined the keyword list and tightened audience parameters." Show that you understand why it happened.
Share what you're doing about it: "We've paused the underperforming ad groups, reallocated that budget to the high-performing segments, and implemented new negative keywords. Early results from the first week show a 22% improvement in lead quality." Action plans rebuild confidence.
Keep it in context: "While paid search missed targets, the overall campaign exceeded lead generation goals by 15% due to strong performance in organic and email channels." Bad news is easier to hear when it's part of a balanced story.
Clients fire agencies who make excuses or hide problems. They keep agencies who take ownership, learn fast, and adjust quickly. Transparent reporting builds the trust that makes clients forgive the occasional miss. This transparency is core to strong client relationship strategy.
Forward-looking recommendations
Every report should end with "what's next." That's how you turn reporting into strategy.
What's working that deserves more investment: "The LinkedIn thought leadership campaign is generating leads at half the cost of other channels and those leads convert at 2x the rate. We recommend shifting 20% of the paid budget to expand this tactic." Give clients clear actions they can approve.
What needs adjustment: "Display advertising is driving awareness but not converting. We recommend testing new creative approaches focused on specific pain points rather than general brand messages." Show you're actively optimizing.
New opportunities the data revealed: "We noticed that existing customers engage heavily with educational content but rarely see our case studies. We should test an upsell nurture campaign targeting this segment." Use insights to expand scope.
Risks and concerns: "Our cost per lead is below target now, but we're seeing early signs of audience saturation in our core segments. We should start testing adjacent personas to maintain growth." Proactive risk identification shows strategic thinking.
Test recommendations: "Based on performance data, we recommend A/B testing longer-form video content against our current static image ads. If the pilot shows promise, we can scale in Q2." Make it easy for clients to say yes to small experiments.
Structure recommendations as options when possible. "We see three paths forward: expand the current approach, test new channels, or shift focus to conversion optimization. Here's what each would deliver." Giving clients choices makes them feel in control.
Client presentation strategy
How you deliver the report matters as much as what's in it.
Presentation planning: Don't just email a PDF. Schedule a live walkthrough, even if it's only 15 minutes. That gives you control over the narrative and lets you read the room. If they're confused about a metric, you can clarify immediately. If they're excited about a result, you can lean into that enthusiasm.
Customize for the audience: If you're presenting to the CFO, lead with cost efficiency and ROI. If you're presenting to the marketing team, lead with performance insights and optimization opportunities. Same data, different emphasis.
Delivery formats matter: Live presentations for strategic reviews. Dashboard access for operational monitoring. PDF reports for executives who want something to forward. Offer multiple formats so clients can consume the information in whatever way works for them.
Handling difficult conversations: If results are disappointing, address it head-on at the start of the meeting. "I want to start with the fact that we missed our lead target this month. Here's what happened, what we learned, and what we're doing about it." Get past the anxiety quickly so you can focus on the path forward.
Engagement techniques: Ask questions during the presentation. "Does this align with what you're seeing in sales conversations?" or "Which of these insights surprises you?" Turn it into a dialogue, not a monologue.
Clear next steps: End every presentation with specific actions. "We'll implement the recommended audience refinements this week, and you'll see updated performance in next week's dashboard. We'll plan the expanded content campaign for February pending your approval on the budget increase." Everyone should leave the meeting knowing what happens next.
Follow-up documentation: Send a summary email after the presentation. "As discussed, here are the key takeaways and agreed-upon action items." This creates a paper trail and ensures alignment.
Communication cadence
Different campaigns need different reporting rhythms.
For active campaigns: Weekly dashboard updates keep everyone aligned on performance. These can be lightweight - just the key metrics and any significant changes. Save deep analysis for monthly reviews.
Monthly reviews: This is where you dig into performance, share insights, and make optimization recommendations. Monthly cadence balances staying informed with giving the campaign time to generate meaningful data.
Quarterly business reviews: Step back from campaign tactics and assess strategic impact. How has the agency relationship contributed to business goals over the quarter? What should the focus be next quarter? These conversations renew relationships and expand scope.
Crisis reporting protocols: Sometimes you need to communicate outside the regular schedule. If something breaks - a campaign overspent, a metric tanked, or an unexpected opportunity emerged - tell the client immediately. Don't wait for the next scheduled report. Fast communication on problems prevents small issues from becoming relationship-enders.
Automated vs custom reports: Use automated dashboards for routine updates. Clients can check them whenever they want without waiting for you. Reserve custom reports for significant milestones, strategic reviews, or when you have a specific story to tell that automated reports can't capture.
Balance is key. Too much reporting creates noise and desensitizes clients to your updates. Too little leaves them wondering what you're doing. Match the cadence to the campaign intensity and client preferences.
Advanced attribution modeling
For complex B2B campaigns where buyers touch multiple channels over months, simple attribution doesn't cut it.
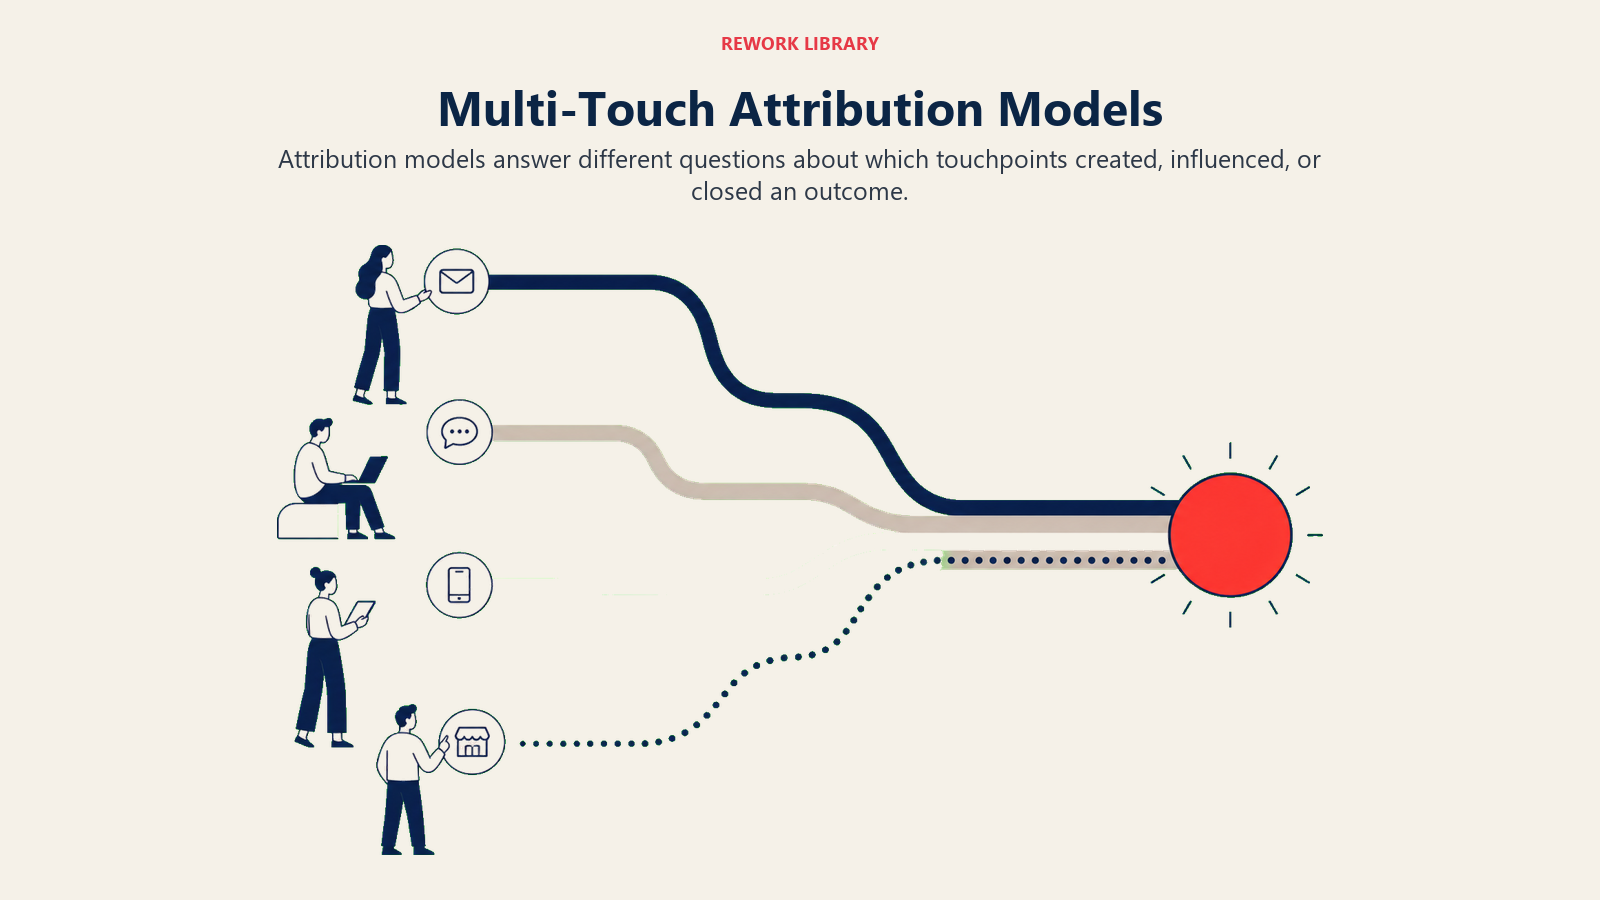
First-touch attribution: Credits the first interaction. Useful for understanding what drives initial awareness, but ignores everything that happened to nurture the lead.
Last-touch attribution: Credits the final interaction before conversion. Easy to implement and tracks what closes deals, but ignores the journey that built interest.
Linear attribution: Spreads credit equally across all touchpoints. Fair but assumes every interaction contributes equally, which is rarely true.
Time-decay attribution: Gives more credit to recent interactions. Makes sense for understanding what drives immediate action, but undervalues early awareness building.
Position-based attribution: Splits credit between first and last touch, with smaller amounts to middle touches. Recognizes that both awareness and closing matter.
Custom algorithmic attribution: Uses data science to determine which touchpoints actually influence conversions based on historical patterns. Most accurate but requires sophisticated analytics infrastructure.
Most agencies should start with last-touch for simplicity, then move to position-based as they mature. Reserve algorithmic models for enterprise clients with enough data volume to make them meaningful.
Whatever model you use, document it clearly in your reports so clients understand how you're calculating impact.
Competitive benchmarking
Context makes metrics meaningful. Showing how performance compares to competitors or industry standards makes good results look great and helps clients understand what's realistic.
Industry benchmarks: "Your email open rate of 24% exceeds the industry average of 18% for B2B software companies." This validates that the campaign is performing well, not just differently.
Competitive comparisons: "Share of voice analysis shows your brand now appears in 32% of target account search results, up from 18% and gaining on the market leader at 41%." This frames progress in competitive terms clients care about.
Historical benchmarks: "Lead volume is up 45% compared to the same period last year, and lead quality has improved with a 23% higher SQL rate." Year-over-year comparison shows trajectory.
Peer group analysis: For clients in networks or associations, showing how they perform relative to similar companies is powerful. "Your content engagement rate places you in the top quartile of similar-sized firms in your industry."
Get benchmark data from industry reports, marketing platform benchmarks, or your own aggregated client data (anonymized and with permission). Clients who see they're outperforming competitors feel confident. Clients who see they're lagging gain urgency to improve.
Predictive analytics and forecasting
Historical reporting tells you what happened. Predictive reporting tells you what's likely to happen next - and that's where you become indispensable.
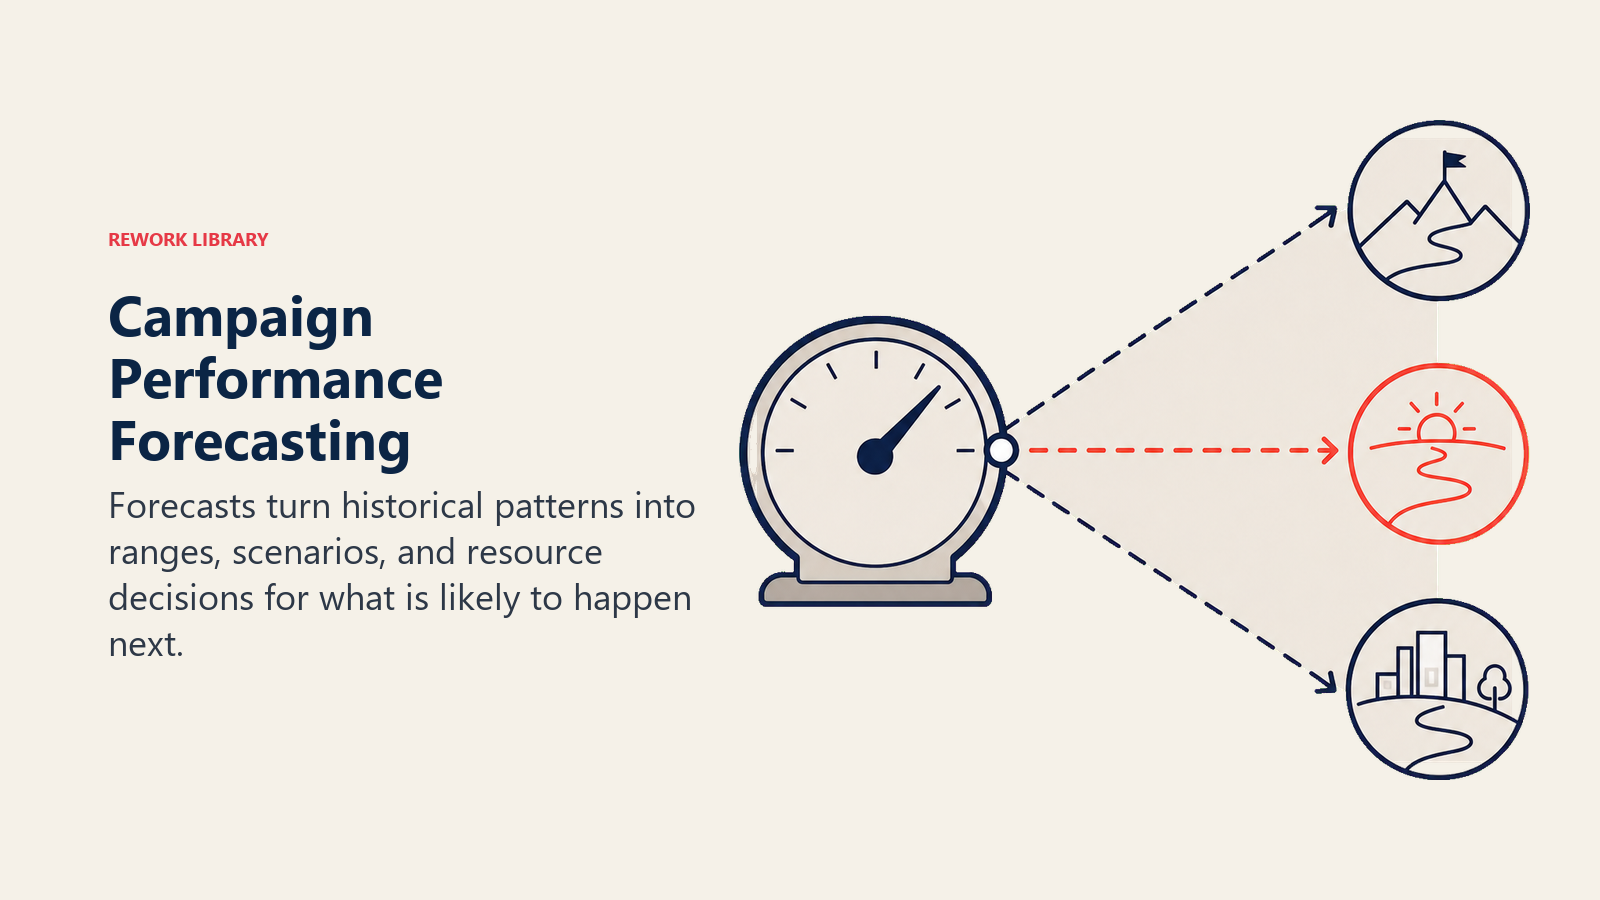
Trend forecasting: "Based on current performance trends, we project 2,400 leads in Q1 vs the 2,000 target, assuming no major market changes." This helps clients plan resources.
Scenario modeling: "If we increase budget by 30%, historical data suggests we'd generate 400 additional leads at a slightly higher CPL due to audience expansion." This helps clients make investment decisions.
Cohort analysis: "Leads generated in Q4 are converting to opportunities at a 15% higher rate than Q3 leads, suggesting improving lead quality. If this trend continues, we should see revenue impact in Q2." This connects current activity to future revenue.
Early warning indicators: "We're seeing declining engagement in our core audience segment, which historically predicts a 20% lead volume drop within 60 days unless we refresh creative." This gives clients time to act.
Pipeline contribution modeling: "The campaigns we launched in September are now generating pipeline. Based on historical conversion timing, we expect to see closed revenue impact in January." This helps clients attribute revenue correctly.
Predictive reporting requires historical data and pattern recognition. Start simple - basic trend lines and what-if scenarios. As you build data history with a client, you can get more sophisticated.
ROI and financial impact reporting
At the end of the day, clients want to know one thing: did this make us money?
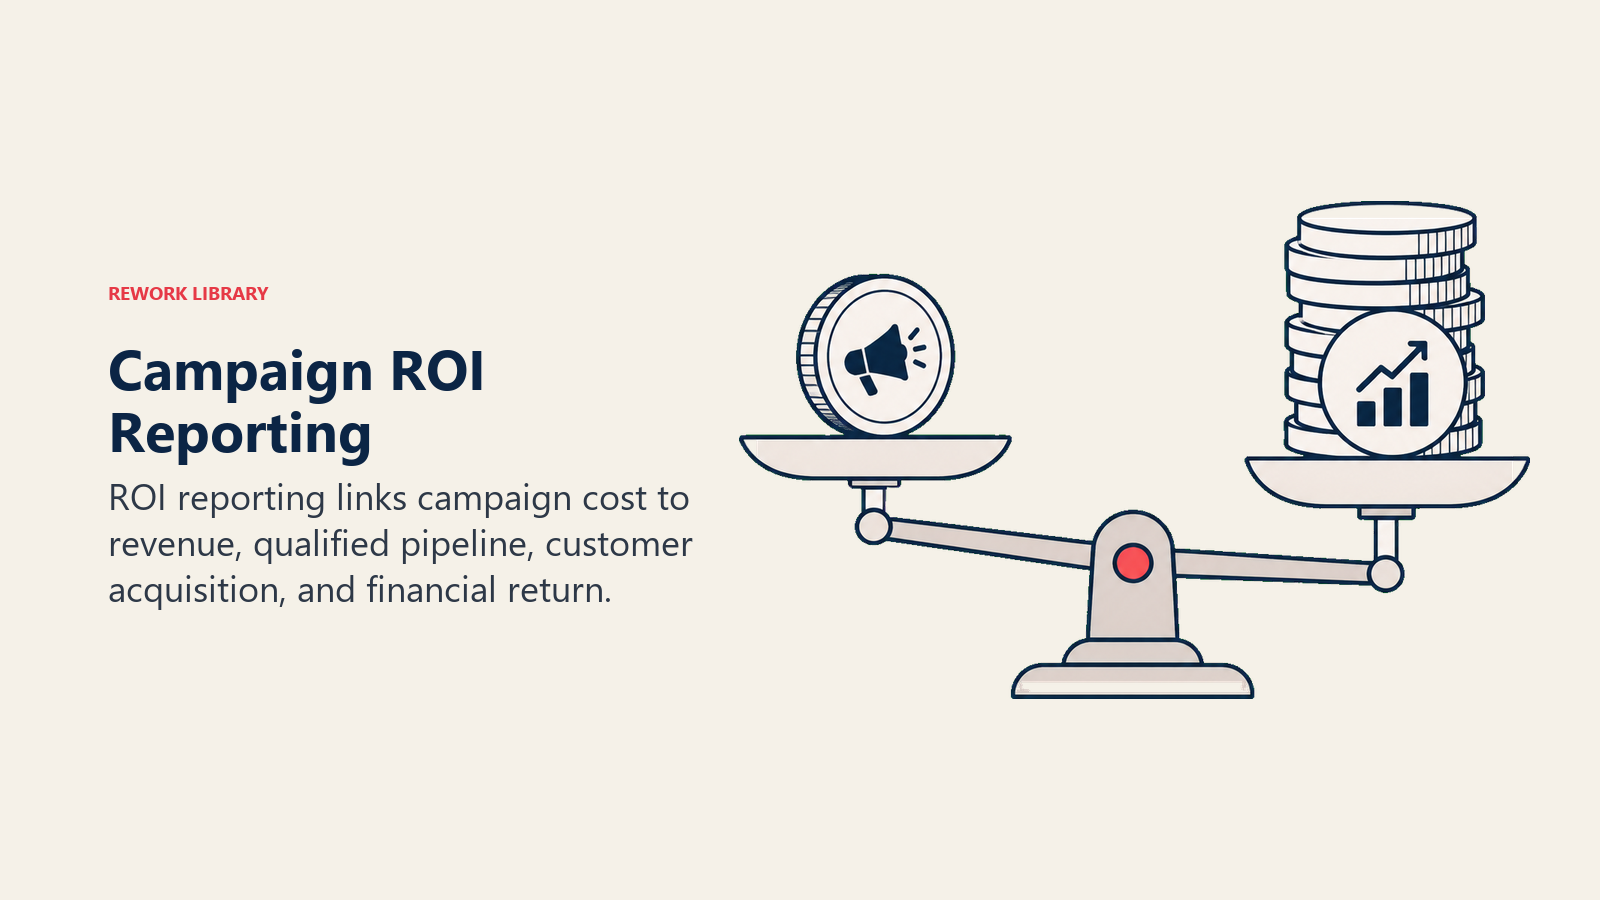
ROAS calculations: Return on ad spend is straightforward for e-commerce. "For every dollar spent on ads, we generated $4.20 in revenue." For B2B with longer sales cycles, you might track pipeline ROAS: "For every dollar spent, we generated $12 in qualified pipeline."
Customer acquisition cost: "We acquired 42 new customers at an average CAC of $2,400, which is 18% below your target of $2,950 and well within the $4,500 lifetime value threshold." This proves efficiency.
Pipeline contribution analysis: "The campaign generated $1.2M in qualified pipeline. Based on your historical close rate of 28%, this represents approximately $336K in projected revenue." This connects marketing to sales outcomes.
Cost efficiency metrics: "We reduced cost per lead by 31% while maintaining lead quality, resulting in $47K in budget savings that can be reallocated to expansion tactics." Efficiency gains are real value.
Lifetime value impact: "The campaign targeted high-value customer segments with 40% higher lifetime value than average. Even with a slightly higher CAC, the LTV:CAC ratio improved from 3.2:1 to 4.1:1." This shows strategic thinking beyond immediate cost.
Investment justification: "Based on Q4 performance, increasing the budget by $50K per month would generate an estimated additional $180K in pipeline per month, maintaining the current 3.6:1 ROAS." This makes the case for growth.
Financial impact reporting is where you prove you're not a cost center - you're a profit driver. Master this, and budget conversations become about how much to invest, not whether to keep investing.
Tools and technology for reporting
You can't build sophisticated reporting with spreadsheets alone. Here's what agencies actually use.
Analytics platforms: Google Analytics 4 for website behavior, Adobe Analytics for enterprise complexity. These track user journeys, conversions, and attribution across touchpoints.
Dashboard and visualization tools: Looker Studio (formerly Data Studio) for budget-friendly visualization. Tableau or Power BI for advanced analytics. Klipfolio or Databox for client-facing dashboards. These transform raw data into visual stories.
Reporting automation: Supermetrics or Funnel.io to pull data from multiple platforms into centralized reporting. This eliminates manual data collection and reduces errors.
CRM integration: Salesforce, HubSpot, or Pipedrive integration lets you track campaigns through to closed revenue. Essential for proving pipeline impact.
Attribution platforms: Bizible, Ruler Analytics, or HubSpot Attribution for multi-touch attribution tracking. These solve the "which channel drove the conversion" question for complex B2B journeys.
Presentation tools: Beyond PowerPoint - tools like Pitch, Beautiful.ai, or Prezi for more engaging presentations. Or use interactive dashboards instead of static slides.
Most agencies should start with Google Analytics 4, Looker Studio, and a spreadsheet for manual calculations. As you scale, invest in automation tools that save time and improve accuracy. The best reporting stack is the one your team will actually use consistently.
Common reporting mistakes to avoid
Even experienced agencies fall into these traps.
Vanity metrics focus: Reporting followers, impressions, and traffic without connecting to business outcomes. Clients get bored fast when nothing ties to their goals.
Cherry-picking data: Highlighting what worked while quietly ignoring what didn't. Clients aren't stupid. When you only share good news, they stop trusting all news.
Misaligned KPIs: Reporting metrics the client doesn't care about. If they want pipeline and you're showing engagement rates, you're not speaking the same language.
Poor visualization choices: Using complicated charts that require a PhD to interpret. Or cramming so much data on one page that nothing stands out.
Inconsistent methodology: Changing how you calculate or display metrics from month to month. This makes trends impossible to track and clients confused.
Missing the "so what": Presenting data without interpretation. Clients hire you for expertise. Tell them what the data means, don't make them figure it out.
Delayed reporting: Sending last month's report three weeks into the current month. By then, the insights are stale and optimization opportunities are missed.
One-size-fits-all reports: Using the exact same report template for every client regardless of their industry, goals, or preferences. Customization shows you care.
No action steps: Ending reports with data but no recommendations. Clients want to know what to do next, not just what happened.
The fix for all of these: Put yourself in the client's shoes. What question are they trying to answer? What decision will this report help them make? Build reports that serve their needs, not just document your work.
Putting it into practice
Results reporting transforms from obligation to opportunity when you treat it as strategic communication instead of administrative task.
Start here:
Before the campaign: Establish baselines, align on KPIs, and set reporting expectations. Get agreement on what success looks like so you're measuring the right things.
Build your infrastructure: Set up tracking, integrate platforms, and create dashboard templates. Invest time upfront to save hours per report later.
Layer your metrics: Strategic outcomes first, tactical execution details second. Always connect metrics to business impact the client cares about.
Tell stories, not just numbers: Use narrative structure to explain what happened, why it matters, and what comes next. Make the data memorable.
Be transparent: Share good news and bad news with equal honesty. Trust is built through transparency, not perfection.
Make it actionable: Every report should end with clear recommendations. Give clients something to approve, not just information to absorb.
Customize for the audience: Executives need summaries, managers need details, analysts need data. Serve multiple formats so everyone gets what they need.
Results reporting is your most powerful retention tool. Master it, and you'll rarely lose clients to "we're trying someone new." You'll have proven your value so clearly that leaving feels like a step backward.
For more on building strong client relationships through effective communication:
- Professional Services Metrics - The complete guide to metrics that matter in professional services
- Client Communication Cadence - Structuring regular client touchpoints that build trust
- Proposal Presentation - Presenting your value proposition persuasively
- Project Management Methodology - Delivering projects clients love
The agencies that win long-term aren't always the ones with the best creative or the lowest prices. They're the ones who make clients feel confident, informed, and proud of the partnership. That's what great reporting delivers.

Senior Operations & Growth Strategist
On this page
- Why results reporting drives client retention
- The strategic role of reporting in client relationships
- Pre-campaign measurement planning
- KPI alignment with client goals
- Strategic vs tactical metrics
- Vanity vs meaningful metrics
- Dashboard design principles
- Executive vs operational views
- Data collection and quality assurance
- Storytelling with data
- Addressing underperformance transparently
- Forward-looking recommendations
- Client presentation strategy
- Communication cadence
- Advanced attribution modeling
- Competitive benchmarking
- Predictive analytics and forecasting
- ROI and financial impact reporting
- Tools and technology for reporting
- Common reporting mistakes to avoid
- Putting it into practice