Solar Pipeline and Funnel Analytics: Seeing Where Deals Are Won and Lost
Turn this article into takeaways for your work.


Each assistant summarizes the article only for you and suggests best practices for your work.
Most solar sales managers know their close rate. Fewer know their stage-by-stage conversion. Almost none can pull those numbers by rep, by lead source, and by time period in under five minutes.
That gap matters. Your overall close rate is an output. It tells you how things went, not why, or where in the funnel the problem lives, or which reps are losing deals at the pricing stage versus the objection-handling stage.
Pipeline and funnel analytics give you that granularity. They turn a single number into a diagnostic tool.
Why Funnel-Level Data Changes Decisions
When a sales manager sees that their team's close rate dropped from 28% to 21%, the natural response is to increase pressure, add training, or question lead quality. All three responses might be wrong, because the close rate doesn't tell you what changed. McKinsey's research on sales analytics consistently finds that most pipeline visibility problems trace back to incomplete stage data: opportunities entered late, stages skipped, or loss reasons never recorded. Without that structure, managers make interventions based on symptoms rather than causes.
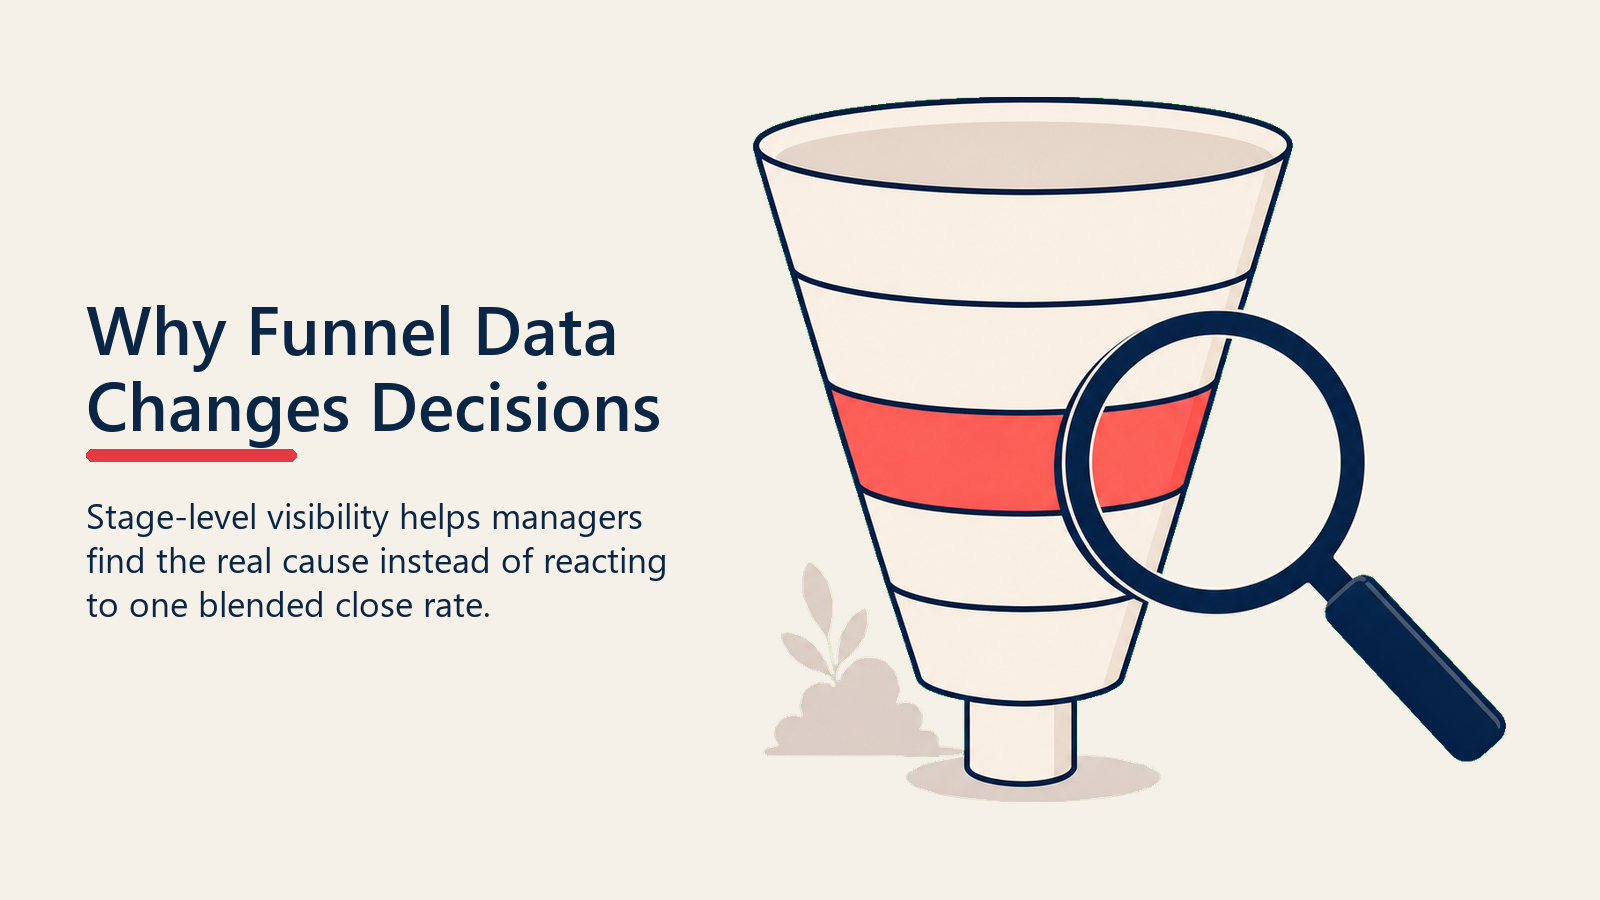
Funnel analytics break that single number into the sequence of conversion rates that produce it. In residential solar, the core funnel looks like this:
Lead in > Appointment set > Appointment completed > Proposal presented > Decision reached > Deal closed
Each transition between stages has a conversion rate. When overall close rate drops, one of those rates changed. Maybe fewer appointments are completing (a confirmation process problem). Maybe more proposals are being presented but fewer decisions are reached (a confidence or urgency problem at the close stage). Maybe the close-to-no-decision ratio held, but the proportion of "get other quotes" objections increased (a competitive positioning problem).
Each diagnosis points to a different fix. You can't find the right fix without seeing which stage rate moved.
Key Facts
- The U.S. surpassed 6 million cumulative solar installations in Q1 2026, with 97% of all installations on residential rooftops. (SEIA, Solar Market Insight Q2 2026)
- Only 19% of B2B field sales organizations achieve sustainable success, consistently hitting quota while keeping annual turnover under control. (SPOTIO, State of Field Sales 2026)
- Organizations integrating digital analytics into their sales process can achieve 5 to 10% revenue growth above market rate, largely by improving visibility into where deals stall. (McKinsey, Boosting Your Sales ROI)
The Core Pipeline Stages in Residential Solar
Different companies use different stage names, but the underlying structure is similar. Here's a practical set of pipeline stages that map to the real events in the in-home solar sale:
| Stage | Entry Trigger | Exit Trigger |
|---|---|---|
| Lead | Contact record created | Qualified and appointment set |
| Appointment Set | Appointment booked in CRM | Appointment held or cancelled/rescheduled |
| Appointment Completed | Rep marks as run | Proposal presented or not |
| Proposal Presented | Proposal generated and shown | Decision point reached |
| Decision Pending | Homeowner asked for time | Deal closed, lost, or timed out |
| Closed Won | Contract signed | Moves to install handoff |
| Closed Lost | Rep marks as lost with reason | Archived |
This structure gives you six meaningful conversion metrics: lead-to-appointment, appointment-to-completion, completion-to-proposal, proposal-to-decision, decision-to-close, and overall lead-to-close.
If your CRM stages don't mirror your actual process this clearly, the first step is to align them. You can't measure what you haven't defined.
Setting Up Stage Definitions That Actually Work
The quality of your analytics depends entirely on the quality of your data, which depends on how consistently reps update pipeline stages and why they move deals.
Common data quality problems in solar CRM pipelines:
Reps leaving deals in "Appointment Set" after the appointment runs. If a rep doesn't update the stage, the appointment appears to still be upcoming. The appointment-to-completion rate looks artificially low, and you can't trust any downstream metric.
Moving deals to "Closed Lost" immediately after a no-decision, without a "Decision Pending" stage. This hides the population of deals that are re-engageable versus genuinely lost. Some percentage of "think about it" decisions close on a follow-up visit. If they go straight to lost, you can't track that.
No required loss reason. When a rep marks a deal lost without specifying why, you lose the most valuable data in the pipeline: what's actually causing you to not win. "Price," "competitor," "not a good fit," "homeowner changed mind," and "credit issue" are all different problems that require different responses.
Fix these with CRM configuration, not training. Require a loss reason to exit the lost stage. Build an automation that alerts a manager when a deal sits in a stage for more than seven days without an update. Add a "Follow-up scheduled" sub-status to Decision Pending so you know which pending deals have active follow-up versus which are cold.
The Key Conversion Metrics to Track Weekly
Not all funnel metrics need the same review frequency. Some you want in front of you every week; others are better reviewed monthly.
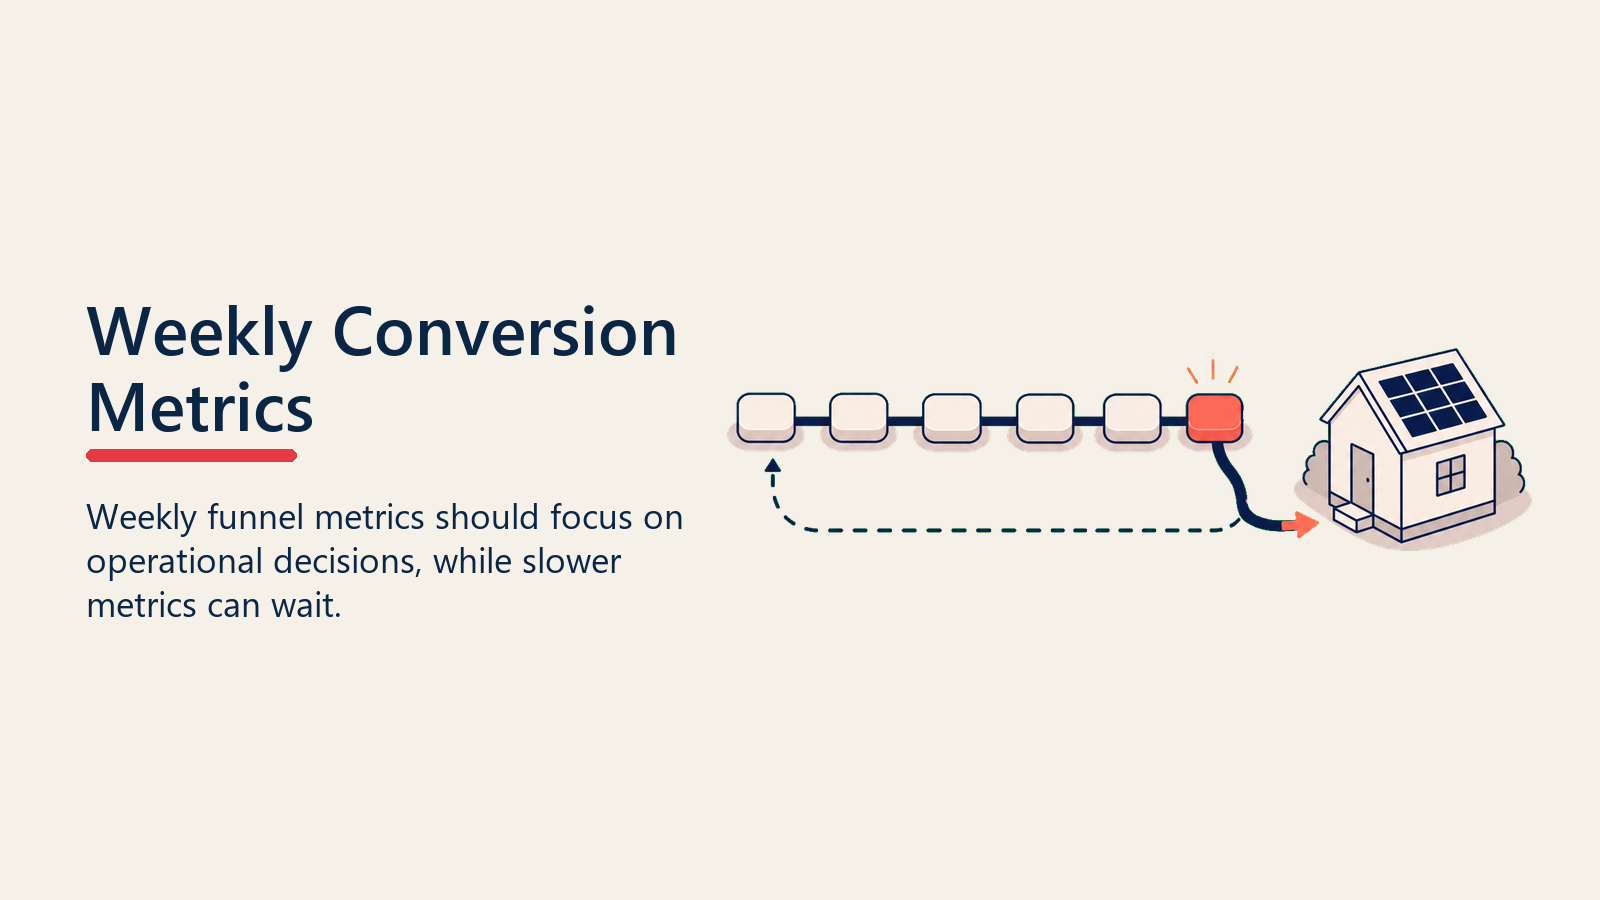
Weekly review (operational decisions):
- Appointment completion rate: appointments run / appointments set. Target: 70-80% for well-confirmed teams. Below 65% is a process problem.
- Proposal rate: proposals presented / appointments completed. Target: 85-90%. A rep who runs appointments but doesn't present proposals has a qualification or consultation problem.
- Same-day close rate: deals closed at first appointment / proposals presented. This is your one-call close metric. Varies widely by company and market; know your baseline.
- Deals in Decision Pending older than 14 days: these are at risk of going cold. Flag them for manager review.
Monthly review (strategic decisions):
- Lead-to-appointment conversion by source: are your referral leads setting at 60% and your purchased leads setting at 20%? That's a lead quality and economics story.
- Overall close rate by rep: adjusted for lead source mix, so you're comparing like-to-like.
- Average days in each stage: long average times in certain stages reveal bottlenecks.
- Loss reason distribution: where are deals being lost and why?
This connects to the broader metrics framework covered in solar sales KPIs and metrics. Funnel analytics are the operational expression of those KPIs.
Revenue Forecasting from Pipeline Data
Most solar companies forecast revenue by multiplying the number of active reps by their expected monthly output. That works as a rough floor estimate, but it misses the actual pipeline.
A better approach uses weighted pipeline value:
- Pull all deals currently in active pipeline stages
- Assign a close probability to each stage (example: Appointment Set = 15%, Appointment Completed = 25%, Proposal Presented = 45%, Decision Pending = 60%)
- Multiply each deal's contract value by its stage probability
- Sum across all active deals
This gives you a probabilistically weighted revenue forecast based on what's actually in the funnel, not just what you hope reps will generate.
Run this calculation at the start of each week. Compare actual closed revenue to the prior week's forecast. Over time, you'll calibrate your stage probabilities to match your actual close rates, and the forecast gets progressively more accurate.
For a team with average deal values around $30,000 and 40 active deals across stages, a 5% improvement in forecast accuracy can mean the difference between correct resource allocation and hiring decisions made on wishful thinking.
Funnel Analytics by Lead Source
Not all leads convert at the same rate, and treating them as equivalent distorts every metric in your funnel.
Build a lead source dimension into your pipeline analysis. Pull conversion rates for each source separately:
| Lead Source | Lead-to-Appt | Appt-to-Close | Overall Close |
|---|---|---|---|
| Referral from customer | 72% | 38% | 27% |
| Canvassing | 18% | 24% | 4.3% |
| Digital paid ads | 31% | 19% | 5.9% |
| Community events | 45% | 29% | 13% |
| Purchased lists | 11% | 14% | 1.5% |
The numbers above are illustrative, but the pattern is consistent: self-generated and referral leads convert at dramatically higher rates than purchased leads. When you blend these into a single funnel metric, you can't see it.
Segmenting by source tells you where your acquisition investment is actually returning. It also tells you which leads to prioritize for in-home appointment confirmation, which affects show rates and the quality of your closer's appointment day.
See solar buying vs self-generated leads for a deeper look at how to evaluate lead source economics.
Funnel Analytics by Rep
After lead source, rep-level funnel analysis is the most valuable dimension you can add.
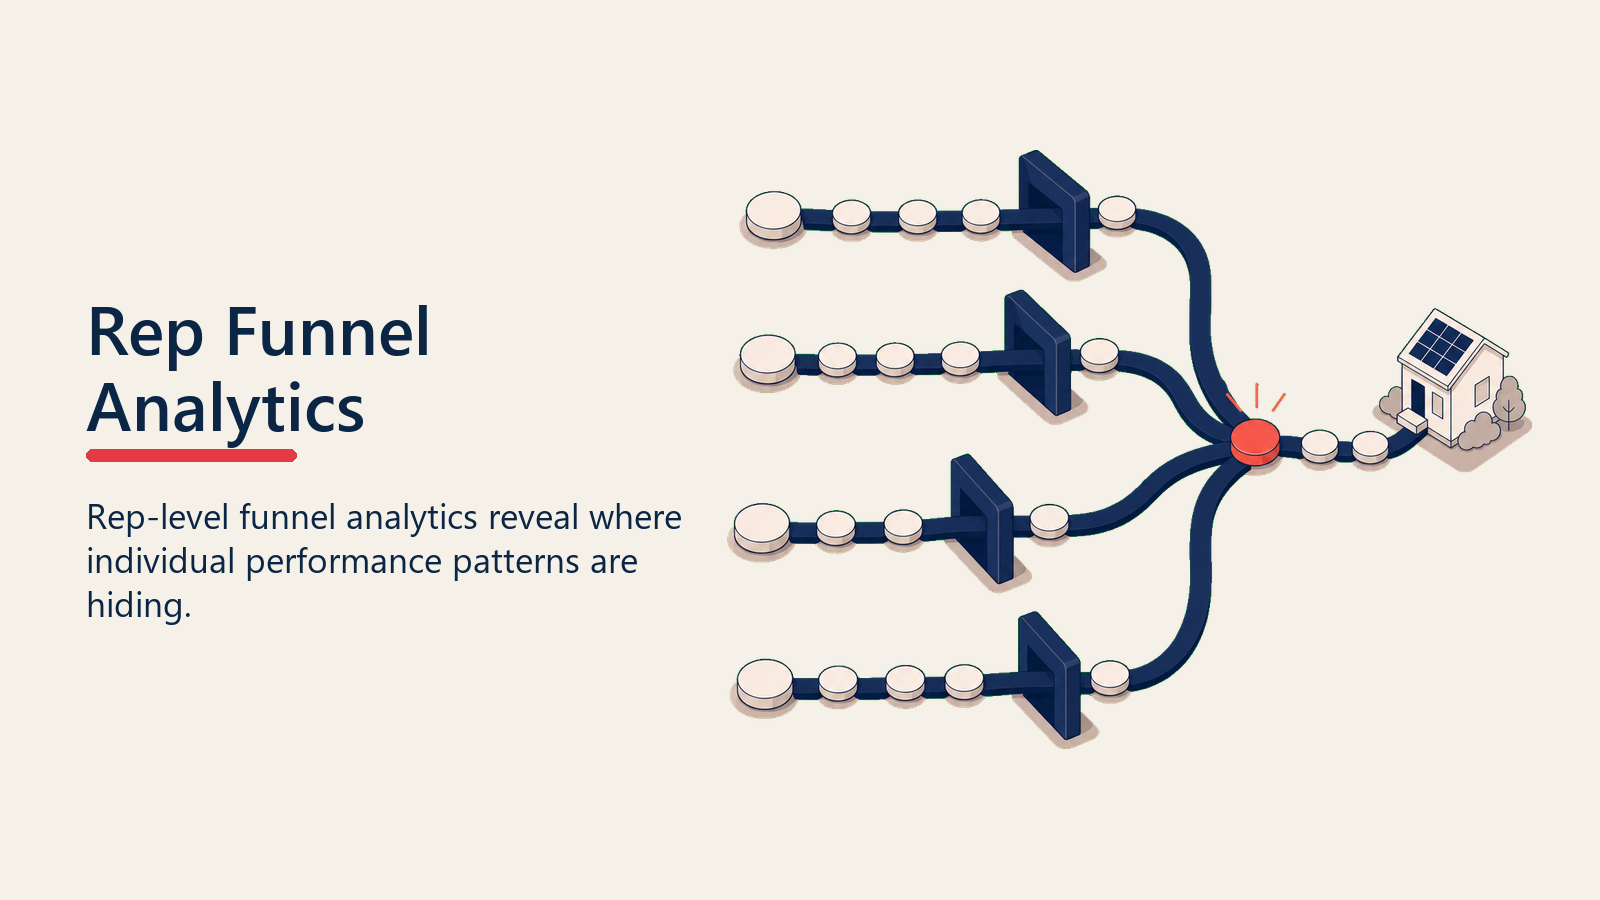
When you pull funnel conversion rates by rep, you stop averaging away individual performance patterns. You might find:
- Rep A has a 90% appointment completion rate but a 15% proposal rate. They're running appointments but not getting to the proposal. That's a consultation framework problem.
- Rep B has a 75% proposal rate but a 10% same-day close rate. They're presenting proposals but not closing. That's an objection-handling or urgency problem.
- Rep C has a 25% same-day close rate but their average deal value is 20% below the team average. They're closing, but possibly discounting or undersizing to win decisions.
Each of these reps looks different in an overall close rate comparison, but the pattern becomes actionable only when you see the stage-by-stage breakdown.
This is exactly the data you bring into coaching conversations. When you sit down with Rep A, you don't say "your numbers need to improve." You say "I've been looking at your funnel data and I'm seeing a gap between appointments run and proposals presented. What's happening in your consultations when you decide not to present a proposal?"
That's a conversation grounded in fact, not impression.
For the management layer that connects these rep-level analytics to daily operations, see lead and setter performance dashboards.
Identifying Stuck Deals and Pipeline Velocity
Pipeline velocity is the measure of how fast deals move through your funnel. A deal that takes 90 days from lead to close versus one that takes 21 days represents very different productivity, even if both count the same in your close rate.
Track average days in each stage over time. When average days in "Decision Pending" starts increasing, it usually means one of three things: reps are classifying stalled deals as pending rather than lost, follow-up processes are weakening, or competitive alternatives are emerging that make homeowners more hesitant to commit.
Set a maximum time threshold for each stage. Deals that exceed the threshold should surface automatically in a manager dashboard or daily report for active review. A deal sitting in "Proposal Presented" for 21 days with no activity isn't really a pipeline deal; it's a risk.
Build a weekly "pipeline hygiene" review into your manager rhythm. The goal is to clear out deals that reps are holding in active stages out of optimism rather than realism, and to identify deals that need intervention before they go completely cold. This is also where opportunity qualification discipline pays off: deals that should never have entered "Decision Pending" in the first place inflate your pipeline and distort every forecast you run.
Setting Up Funnel Reports in Your CRM
If you're using a general-purpose CRM like Salesforce or HubSpot, funnel reports are built-in, but they require correct pipeline stage configuration to be useful.
If you're using a solar-native platform, funnel reporting is often pre-configured for common solar stages. The question is whether those stages match your actual process and whether you can filter by the dimensions you need (rep, lead source, time period, deal value range).
At minimum, build these three reports and put them on a manager dashboard:
Active pipeline by stage: a count and total value of deals in each stage right now. This is your operational view.
Conversion rates by stage, rolling 30 days: percentage of deals moving from each stage to the next. This is your funnel health view.
Loss reasons, last 30 days: a breakdown of why deals are being marked lost. This is your improvement priority view.
If your CRM can't produce all three without exporting to Excel, that's a configuration gap, not a tool gap. Work with your admin to build them before assuming you need a new tool.
Using Analytics to Qualify Pipeline Interventions
Not every underperforming metric calls for the same response. Funnel analytics help you match the intervention to the actual problem.
Use this diagnostic logic:
If appointment completion rate is low: the problem is in the confirmation process, setter quality, or lead quality. Don't coach closers; fix confirmation and lead qualification.
If proposal rate is low: the problem is in the in-home consultation. Reps are running appointments but not getting to a proposal. This is a consultation framework, rapport, or pre-qualification problem. See in-home consultation framework for the consultation structure.
If proposal-to-decision rate is low: the problem is in how reps present proposals and create urgency. This is a training and coaching issue at the price-presentation and urgency stages.
If decision-to-close rate is low: the problem is in objection handling and one-call close execution. This is also where lead scoring systems matter upstream: when homeowners entering the funnel are better pre-qualified, the decision-to-close conversion is far less dependent on objection technique.
Each diagnosis points to a specific intervention. And each intervention should be evaluated over the following 30 days using the same funnel metric that surfaced the problem. That's how you know whether the fix worked.
Quotable Nuggets
"Your overall close rate is an output. It tells you how things went. It doesn't tell you why, or where in the funnel the problem lives." A single number can't drive a coaching decision. Stage-by-stage conversion can.
"A deal sitting in 'Proposal Presented' for 21 days with no activity isn't really a pipeline deal. It's a risk." Pipeline hygiene isn't just a reporting exercise. It's how you distinguish real revenue from optimistic noise.
McKinsey research found that B2B companies integrating digital analytics into their sales process can achieve 5 to 10% revenue growth above market rate, largely by improving visibility into where deals stall. (McKinsey, Boosting Your Sales ROI)
How Do You Build a Funnel Review Into Your Weekly Rhythm?
The Monday-Wednesday-Friday Pipeline Cadence: Most managers look at funnel data reactively, at end-of-month when problems are already compounded. A structured weekly rhythm changes that. Monday (15 minutes): pull active pipeline by stage and flag any deal over-threshold for time. Wednesday (20 minutes): pull rep-level stage conversion for the past 30 days and put any rep more than 10 points below baseline on the coaching calendar. Friday (20 minutes): review outcomes for the week and note any trend that needs investigation before it becomes a pattern. Monthly (60 minutes): full funnel review with lead source attribution, loss reason analysis, and pipeline velocity. Three specific operational decisions must come out of the monthly review. If you can't name three, you haven't looked closely enough.
Analytics only create value if they're reviewed and acted on. Build the review into a regular cadence before you need it for a crisis.
A practical weekly analytics rhythm for a solar sales manager:
Monday morning (15 minutes): pull active pipeline by stage. Identify any deals in critical stages that need follow-up this week. Check for any stage-over-14-days alerts.
Wednesday (20 minutes): pull rep-level funnel conversion for the past 30 days. Identify any rep with a stage conversion rate more than 10 points below team baseline. Those reps go on the coaching calendar.
Friday (20 minutes): review the week's outcomes. Deals closed, proposals presented, appointments run. Compare to prior week. Note any trend that needs investigation.
Monthly (60 minutes): full funnel review including lead source attribution, loss reason analysis, and pipeline velocity. Identify three specific operational decisions that come from the data.
The monthly review is where strategy comes from. The weekly reviews are where operations run. You need both.
When to Bring in External Benchmarks
Internal funnel data tells you whether you're improving. External benchmarks tell you whether you're competitive.
For residential solar, published conversion benchmarks vary significantly by market, company size, and lead mix. A market that recently surpassed 6 million cumulative installations (SEIA, 2026) is a fundamentally different competitive environment than the early-adopter market of five years ago. Penetrated geographies have different funnel dynamics than those still in early expansion. General ranges:
- Appointment-set-to-appointment-completed: 65-80%
- Appointment-to-proposal: 75-90%
- Proposal-to-close (first visit): 20-35%
- Overall lead-to-close: 5-15% depending heavily on lead source
These are wide ranges because solar sales performance is highly market-dependent. A company running canvassing-heavy lead generation in a competitive market will have very different funnel metrics than one relying on referrals in an under-penetrated geography.
Use external benchmarks as orientation, not as targets. Your targets should come from your own best-period performance and from what your top reps achieve. What your top 20% closes at is what's possible for your market and product mix. That's your internal benchmark, and it's more useful than an industry average.
When deals are being lost consistently at the proposal stage, the issue often isn't pricing alone. A rep who frames value poorly will lose deals that a better-prepared colleague would have closed. Value selling training gives reps the language to anchor homeowners on savings and system performance before price ever comes up, which changes how funnel data reads at that stage.
The foundation of any improvement in solar sales operations is the ability to see clearly what's happening at each stage of the funnel. Analytics aren't a reporting exercise. They're the mechanism by which a manager turns field experience into scalable organizational knowledge.

Senior Implementation Consultant
On this page
- Why Funnel-Level Data Changes Decisions
- The Core Pipeline Stages in Residential Solar
- Setting Up Stage Definitions That Actually Work
- The Key Conversion Metrics to Track Weekly
- Revenue Forecasting from Pipeline Data
- Funnel Analytics by Lead Source
- Funnel Analytics by Rep
- Identifying Stuck Deals and Pipeline Velocity
- Setting Up Funnel Reports in Your CRM
- Using Analytics to Qualify Pipeline Interventions
- How Do You Build a Funnel Review Into Your Weekly Rhythm?
- When to Bring in External Benchmarks