Solar Sales KPIs and Metrics: The Numbers Every Solar Sales Manager Must Track
Turn this article into takeaways for your work.


Each assistant summarizes the article only for you and suggests best practices for your work.
Most solar sales managers run their teams on two numbers: appointments set and deals closed. Those two metrics tell you what happened. They don't tell you why, where the leak is, or what's about to happen next week.
The teams that scale past $20M in residential solar revenue have real-time visibility into seven to twelve metrics across four categories: funnel conversion, rep performance, pipeline health, and financial efficiency. When any metric moves, they know which lever to pull. This article maps the full metric set, explains what each number actually measures, and shows how to build a dashboard that drives real decisions. For industry-wide context, the SEIA Solar Industry Research Data publishes quarterly and annual residential solar volumes that let you benchmark your company's growth rate against the broader market.
Which Metrics Actually Predict Solar Revenue?
The short answer: funnel conversion rates predict revenue better than lagging numbers like total deals closed. Here's what that looks like in practice.
Category 1: Funnel Conversion Metrics
Key Facts
- US residential solar installations totaled 4,710 MW in 2024, per SEIA Solar Market Insight 2024 Year in Review, making detailed funnel visibility critical as competition increases.
- LBNL's Tracking the Sun 2024 report documents ownership and financing structure trends across millions of installed residential systems, providing context on how customer satisfaction and third-party ownership rates interact with referral dynamics.
- NREL's Q1-2024 benchmark puts the modeled market price for a residential rooftop system at $3.15 per watt (DC), per the DOE Solar PV System Cost Benchmarks, making per-deal economics more predictable as companies standardize system sizing.
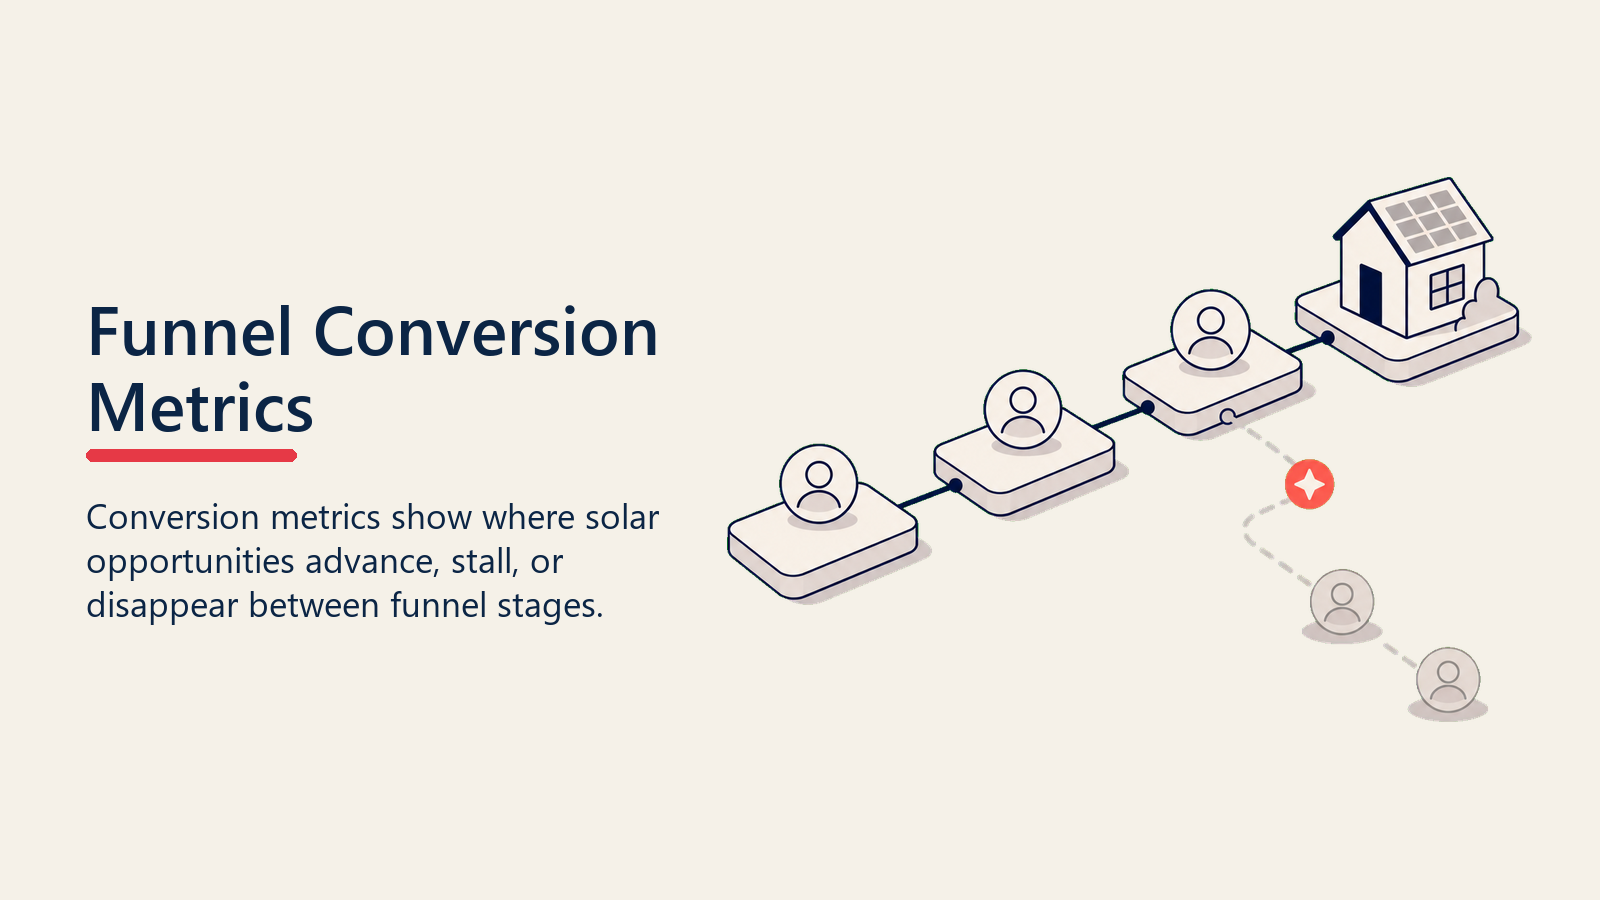
These metrics track how volume moves through each stage of the sales process. They're the most important numbers in the system because they reveal exactly where deals are being lost.
Appointment Set Rate
Definition: Appointments set divided by total leads contacted (or total doors knocked for canvassing teams)
Benchmark: 40-60% for qualified leads; 15-25% for cold D2D canvassing; 30-45% for digital inbound
What it tells you: Setter skill and lead quality. A drop in set rate from a specific lead source usually means the lead quality declined. A drop across all sources usually means setter performance.
Watch out for: Inflated set rates from unqualified bookings. A setter booking 70% of contacts but producing 45% show rates is booking unqualified leads and creating downstream waste.
Appointment Confirmation Rate
Definition: Appointments confirmed (homeowner actively responds to confirmation outreach) divided by appointments set
Benchmark: 78-90%
What it tells you: Whether your confirmation sequence is working. Below 75% usually means the process is too passive (one text, no call) or the lead quality at booking was poor.
Show Rate (Appointment Keep Rate)
Definition: Consultations that actually happen divided by appointments set
Benchmark: 65-80% for well-qualified, well-confirmed leads
What it tells you: The combined quality of qualification and confirmation. This is one of the highest-leverage metrics to improve because every percentage point of show rate is directly additive to deal volume without any increase in lead cost.
A team running 100 appointments/month at 60% show rate runs 60 consultations. At 75% show rate, they run 75. At the same close rate, that's 25% more deals from the same lead investment.
Close Rate (on Consultations Run)
Definition: Contracts signed divided by consultations completed
Benchmark: 22-38% for residential solar; best-in-class teams hit 35-45% on self-gen leads
What it tells you: Closer effectiveness, proposal quality, and financing alignment. Close rate varies significantly by lead source: referral leads typically close at 35-55%, D2D self-gen at 25-35%, and purchased digital leads at 15-25%.
Always track close rate by lead source, not just overall. A team with a 28% overall close rate might be at 42% on referrals and 18% on purchased leads. That distinction shapes where to invest.
Lead-to-Close Rate
Definition: Contracts signed divided by total leads generated
Benchmark: 7-14% across all channels combined
What it tells you: Full-funnel efficiency. This is the number you use to forecast how many leads you need to hit a revenue target. If you need 30 deals and your lead-to-close rate is 9%, you need ~333 leads.
This metric ties directly to the residential solar sales growth model for capacity planning. But knowing the funnel aggregate only tells you the team average. To know who's pulling and who's dragging, you need rep-level metrics.
Category 2: Rep Performance Metrics
Individual rep metrics let you identify who's performing, who needs coaching, and where in the process the gaps are. Don't just track total deals per rep; that aggregates too many variables.
Consultations Per Week (Volume)
Definition: Number of completed in-home consultations per rep per week
Benchmark: 6-12 per week for a full-time closer
What it tells you: Activity level. Low consultation volume usually indicates scheduling problems, high no-show rates, or territory/availability issues, not just rep laziness.
Close Rate Per Rep
Definition: Deals signed divided by consultations run, per rep
Benchmark: Target above 25%; top performers reach 35-45%
What it tells you: Closing skill independent of volume. A rep running 15 consultations/week at 18% close rate is less efficient than one running 10/week at 35%. Track this separately from volume to identify true performance gaps.
Average Contract Value (ACV) Per Rep
Definition: Total contract value divided by number of deals, per rep
Benchmark: Varies by market; typically $26,000-$38,000 per deal in most markets
What it tells you: Whether reps are positioning larger systems, selling battery add-ons, and maintaining price discipline, or whether they're discounting to close. A rep with a 32% close rate and a $23,000 ACV may be less profitable than one closing at 25% with a $34,000 ACV, depending on your margin structure.
This connects directly to the unit economics in solar unit economics and commissions.
Days to Close Per Rep
Definition: Average calendar days from first contact to signed contract, per rep
Benchmark: Under 7 days for one-call-close model; 14-21 days for two-visit model
What it tells you: Whether reps are disciplined about same-day close or drifting into multi-visit patterns. Extended sales cycles increase cancellation risk and reduce rep capacity.
Rep Ramp Time
Definition: Days from hire to first closed deal; days to reach target production (typically 4+ deals/month)
Benchmark: First deal within 30-45 days; target production within 60-90 days
What it tells you: Onboarding effectiveness. Ramp time is a leading indicator of training quality, manager support, and territory assignment. Teams with structured coaching and ride-along programs hit ramp targets; teams without them see wide variance and high 90-day attrition.
Category 3: Pipeline Health Metrics
Pipeline health metrics look forward. They tell you what's likely to close in the next two to four weeks, where your pipeline is fragile, and whether your lead generation is keeping up with team capacity.

Pipeline Coverage Ratio
Definition: Total contract value of open opportunities divided by monthly revenue target
Benchmark: 2.5x to 4x (if you need $500K/month in signed contracts, you should have $1.25M-$2M in active pipeline)
What it tells you: Whether there are enough deals in the system to hit your number. A coverage ratio below 2x is a red flag. Even if everything in the pipeline closes (it won't), you still may not hit target.
Solar pipeline and funnel analytics (linked in the Learn More section) covers the CRM setup that makes pipeline visible.
Cancellation Rate
Definition: Deals cancelled after signing divided by total deals signed, in a given period
Benchmark: Below 12%; under 8% is strong; above 18% signals a serious ops or sales quality problem
What it tells you: Two very different things depending on when cancellation happens. Cancellations within 72 hours of signing usually indicate buyer's remorse or high-pressure close tactics. Cancellations 30-90 days later usually indicate install delay frustration or operations issues. Segment by timing. The same proactive interventions that drive churn prevention in subscription businesses work here: early touchpoints, clear status communication, and catching dissatisfaction before it hardens into a cancellation request.
The specific intervention playbook is in the Learn More section below.
Lead Velocity
Definition: Week-over-week change in new leads entering the funnel
What it tells you: Whether lead generation is accelerating or decelerating. This is a leading indicator: if lead velocity drops today, deals will drop in 3-4 weeks. Tracking this weekly rather than monthly lets you intervene before it hits revenue.
Financing Denial Rate
Definition: Financing applications denied divided by financing applications submitted
Benchmark: Below 15%; above 25% signals qualification problems
What it tells you: Whether your setter qualification is screening for credit appropriately. A high financing denial rate means closers are wasting consultation time with homeowners who can't qualify for the financing product. Sales and finance credit alignment addresses the prescreening solution.
Category 4: Financial Efficiency Metrics
These metrics connect sales activity to business profitability. They're the link between your funnel data and your P&L.
Cost Per Sold Deal (CPA)
Definition: Total variable sales costs in a period divided by deals closed
Benchmark: $2,500-$5,500 depending on channel mix; referral-heavy teams run lower, digital-heavy teams run higher
What it tells you: Sales efficiency across your full cost structure. Track this by channel to understand which lead sources are economically viable at scale.
Revenue Per Rep Per Month
Definition: Total signed contract value per closer per month
Benchmark: $120,000-$280,000/month for a producing closer in a well-run team
What it tells you: Individual productivity and whether your comp plan is sustainable. A closer generating $150,000/month in contracts on a 10% commission earns $15,000/month. Viable. One generating $80,000/month on the same plan earns $8,000/month and is unlikely to stay.
Gross Margin Per Deal
Definition: Contract price minus dealer fees minus COGS (equipment + install)
Benchmark: 45-58% gross margin for a well-run residential solar company
What it tells you: Whether deal economics are sound before sales costs. Gross margin below 40% usually means dealer fees are too high, install costs are out of control, or average deal size is too small.
Referral Rate
Definition: Referral leads generated divided by total installed customers in the same period
Benchmark: 8-18% per year; top-performing operators generate 25%+ referral rate from installed base
What it tells you: Post-install satisfaction and referral program effectiveness. Referral rate is the metric that most directly measures whether your customers would buy again. It's also the cheapest lead source in the business. A poor referral rate is an early warning signal for install quality, customer experience, or onboarding issues.
For the referral program design, see referral generation after install.
Quotable Nuggets
"A team running 100 appointments/month at 60% show rate runs 60 consultations. At 75% show rate, they run 75. At the same close rate, that's 25% more deals from the same lead investment without hiring another closer."
"A 30% close rate on referral leads might be underperforming. A 30% close rate on purchased internet leads might be excellent. Close rate without lead source context is almost meaningless."
"Revenue is a vanity metric in solar if you're not tracking what's underneath it. $2M in monthly contracts at 12% net margin is not the same business as $1.5M at 28% net."
The Four-Category KPI Stack Framework
The Four-Category Solar KPI Stack: a structured dashboard model that organizes residential solar sales metrics into four tiers: (1) Funnel Conversion (where deals move or stall), (2) Rep Performance (individual effectiveness independent of volume), (3) Pipeline Health (forward-looking deal flow and coverage), and (4) Financial Efficiency (connecting activity to P&L outcomes). Running all four in parallel prevents the common failure of optimizing one tier while a different tier quietly collapses.
Building Your Dashboard: What to Show Whom
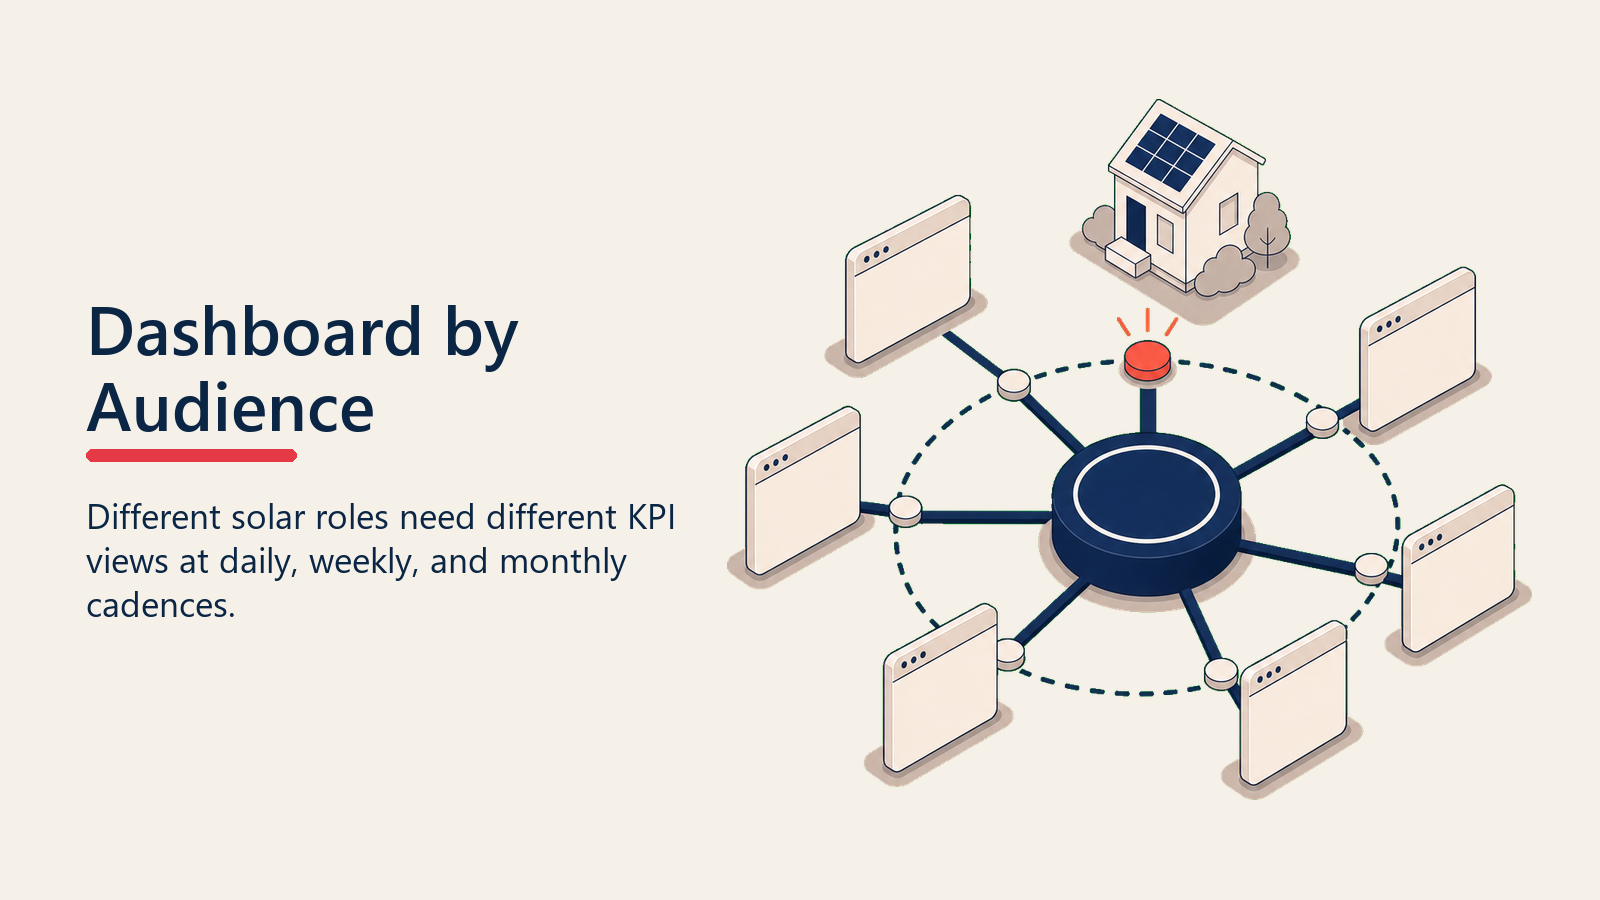
Different roles need different data at different frequencies:
Daily dashboard (sales managers and setters)
- Appointments set today vs. target
- Show rate for yesterday's appointments
- Deals closed today
- Open appointments for next 48 hours
- No-shows / reschedules
Weekly dashboard (sales directors)
- Consultations run vs. target
- Close rate by rep and by channel
- Pipeline coverage ratio
- New leads by source
- Cancellations and reasons
- Financing denial rate
Monthly dashboard (owners and GMs)
- Revenue vs. target
- Cost per sold deal by channel
- Gross margin per deal
- Rep performance ranking (volume, close rate, ACV)
- Lead velocity trend
- Referral rate from installed base
- Cancellation rate trend
The solar CRM and proposal tools article (linked in Learn More) covers the CRM configuration that makes most of these metrics trackable without manual spreadsheet work.
The Three Metrics Most Solar Companies Read Wrong
Close Rate in Isolation
A 30% close rate sounds good. But 30% on referral leads might be underperforming, while 30% on purchased internet leads might be excellent. Close rate without lead source context is almost meaningless.
Revenue Without Margin
$2M in monthly contracts at 12% net margin is not the same business as $1.5M at 28% net. Revenue is a vanity metric in solar if you're not tracking what's underneath it.
Show Rate as a Setter Metric Only
Show rate is often blamed entirely on setters. But show rate is also a function of closer behavior: closers who fail to build rapport during the confirmation call, who arrive 20 minutes late, or who run long in other appointments create their own no-shows. Attribution matters.
The KPI Set That Scales With You
Early-stage solar companies (under 20 deals/month) can manage with five metrics: leads, appointments, shows, close rate, and cancellations. At 20-80 deals/month, add cost per deal, ACV, and financing denial rate. Past 80 deals/month, add pipeline coverage, rep ramp time, referral rate, and gross margin per deal.
Don't try to instrument everything at once. Start with the metrics that answer your biggest current question, and add instrumentation as you add complexity.
Good metrics don't run your business. But they do tell you, before it's too late, exactly which part of the machine needs attention.
Learn More
- Lead qualification frameworks
- Solar pipeline and funnel analytics
- Solar CRM and proposal tools
- Managing install wait and cancellations
- Post-install customer onboarding
Frequently Asked Questions about Solar Sales KPIs and Metrics
What are the most important KPIs for a residential solar sales team?
For teams under 20 deals per month, start with five: leads, appointments set, show rate, close rate, and cancellation rate. From 20 to 80 deals per month, add cost per sold deal, average contract value, and financing denial rate. Above 80 deals per month, add pipeline coverage ratio, rep ramp time, referral rate, and gross margin per deal.
What is a good show rate for residential solar appointments?
A well-qualified, well-confirmed appointment pool should show at 65 to 80 percent. Below 60 percent consistently signals a qualification or confirmation process problem, not just unlucky weeks.
How should close rate be tracked in residential solar?
Always by lead source, not just as a blended average. A team with a 28% overall close rate might be at 42% on referrals and 18% on purchased leads. The distinction shapes channel investment decisions.
What is the pipeline coverage ratio and what does it mean?
Pipeline coverage is total open deal value divided by monthly revenue target. A healthy range is 2.5x to 4x. Below 2x means you almost certainly will not hit target even if everything closes, because it never does. It is a leading indicator, not a lagging one.
What does a high financing denial rate signal?
Financing denial rates above 25 percent typically indicate that setter qualification is not screening for credit fit effectively. The fix is introducing a soft-pull credit check at the setter stage before a closer drives to the appointment.
What is the referral rate benchmark for a well-run solar company?
Top-performing operators generate referral leads from 15 to 25 percent of their installed base annually. A referral rate below 8 percent is an early warning signal for post-install satisfaction, onboarding quality, or the absence of a systematic referral ask process.
Why is cancellation rate important to segment by timing?
Cancellations within 72 hours of signing usually reflect buyer's remorse or high-pressure close tactics. Cancellations 30 to 90 days after signing usually reflect install delay frustration. The same metric with two very different root causes needs different interventions, so segmenting by timing is the only way to prescribe the right fix.

Senior Implementation Consultant
On this page
- Which Metrics Actually Predict Solar Revenue?
- Category 1: Funnel Conversion Metrics
- Appointment Set Rate
- Appointment Confirmation Rate
- Show Rate (Appointment Keep Rate)
- Close Rate (on Consultations Run)
- Lead-to-Close Rate
- Category 2: Rep Performance Metrics
- Consultations Per Week (Volume)
- Close Rate Per Rep
- Average Contract Value (ACV) Per Rep
- Days to Close Per Rep
- Rep Ramp Time
- Category 3: Pipeline Health Metrics
- Pipeline Coverage Ratio
- Cancellation Rate
- Lead Velocity
- Financing Denial Rate
- Category 4: Financial Efficiency Metrics
- Cost Per Sold Deal (CPA)
- Revenue Per Rep Per Month
- Gross Margin Per Deal
- Referral Rate
- Quotable Nuggets
- The Four-Category KPI Stack Framework
- Building Your Dashboard: What to Show Whom
- Daily dashboard (sales managers and setters)
- Weekly dashboard (sales directors)
- Monthly dashboard (owners and GMs)
- The Three Metrics Most Solar Companies Read Wrong
- Close Rate in Isolation
- Revenue Without Margin
- Show Rate as a Setter Metric Only
- The KPI Set That Scales With You
- Learn More