Lead and Setter Performance Dashboards: Managing the Top of Your Solar Funnel
Turn this article into takeaways for your work.


Each assistant summarizes the article only for you and suggests best practices for your work.
In residential solar, the in-home consultation gets most of the attention. Training programs focus on closers. Coaching sessions center on the proposal presentation. Commission plans are built around signed contracts.
But the closer can only work with what the top of the funnel produces. When setters are booking low-quality appointments, or when lead sources are generating contacts with no real purchasing intent, even the best in-home closer can't fix it. They're just running more appointments with worse outcomes.
Lead and setter performance dashboards shift management attention to where outcomes are actually determined. They tell you how many appointments are being set, which setters are setting them, how many show up, and whether the appointments that do show are worth a closer's time.
What a Setter Dashboard Needs to Measure
A setter's job has two outputs: the volume of appointments set and the quality of those appointments. Both matter. A setter who books 30 appointments a week where 12 show up and 4 qualify is a different problem than one who books 10 but 9 show up and 8 qualify.
Volume and quality together define setter productivity. Most dashboards track volume. Fewer track quality. The ones that track both are the ones that actually improve outcomes.
Volume metrics for setters:
- Contacts reached per day (calls, doors knocked, messages sent)
- Appointments set per day/week
- Appointment-set-to-contact ratio (booking rate)
Quality metrics for setters:
- Show rate: appointments completed / appointments set
- Sit rate: percentage of completed appointments where the closer stayed for a full consultation
- Qualified rate: percentage of set appointments where the homeowner met pre-screening criteria (owns home, roof under 15 years, electric bill above threshold)
- Close rate of setter-sourced appointments (tracked to the closer's outcome)
The close rate of setter-sourced appointments is the most lagging of these metrics, but it's the one that ultimately connects setter behavior to revenue. When setter A's appointments close at 28% and setter B's close at 14%, that's a lead quality story that none of the volume metrics will reveal.
Key Facts
- 32% of low-turnover field sales teams say they cannot operate without real-time field data, compared to just 10% of high-turnover teams. (SPOTIO, State of Field Sales 2026)
- The U.S. surpassed 6 million cumulative solar installations in Q1 2026, with 97% of all installations on residential rooftops, signaling a mature but competitive market where appointment quality directly determines which companies win the conversion. (SEIA, Solar Market Insight Q2 2026)
- 41% of field sales teams report annual rep turnover of 50% or higher. (SPOTIO, 140+ Sales Statistics)
Building the Setter Dashboard
The setter dashboard should be visible to both managers and setters. Setters who can see their own metrics in real time adjust behavior faster than those who receive weekly reports.
A practical setter dashboard layout:
Today's numbers (live):
- Contacts reached today
- Appointments set today
- Appointments confirmed for tomorrow
Weekly performance:
- Appointments set this week vs. target
- Show rate for appointments that ran this week
- Qualified rate for this week's appointments
30-day trend:
- Booking rate trend (are they getting better or worse at converting contacts to appointments?)
- Show rate trend (are the appointments they book actually showing up?)
- Closer outcome rate for their appointments (lagging, but tracked monthly)
Leaderboard view (team):
- All setters ranked by appointments set this week
- All setters ranked by show rate this week
The leaderboard creates healthy competition. But display it thoughtfully: a setter at the top of volume who is at the bottom of show rate is gaming the metric. The manager needs to see both columns side by side.
Lead Source Quality Tracking
Not all leads are equal, and your setter dashboard should reflect that. A setter working high-quality referral leads from past customers will have a very different booking rate than one working purchased internet leads or cold canvassing lists.
Build lead source into your dashboard as a filter dimension so you can see setter performance within lead source, not just overall. This lets you answer questions like:
- Are all setters performing similarly on our digital leads, or are some converting those leads at dramatically different rates?
- What's the show rate difference between appointments set from canvassing versus appointments from referral calls?
- Which lead source produces the highest-value appointments for our closers?
The answers to these questions drive resource allocation decisions. If digital leads are setting at 18% but canvassing leads are setting at 35%, that's an input into your solar digital lead generation investment decisions.
For a deeper look at how lead source economics affect which leads you should buy vs. generate, see solar buying vs self-generated leads.
Show Rate: The Most Important Top-of-Funnel Metric
Show rate is the percentage of set appointments where the homeowner actually opens the door when the closer arrives.
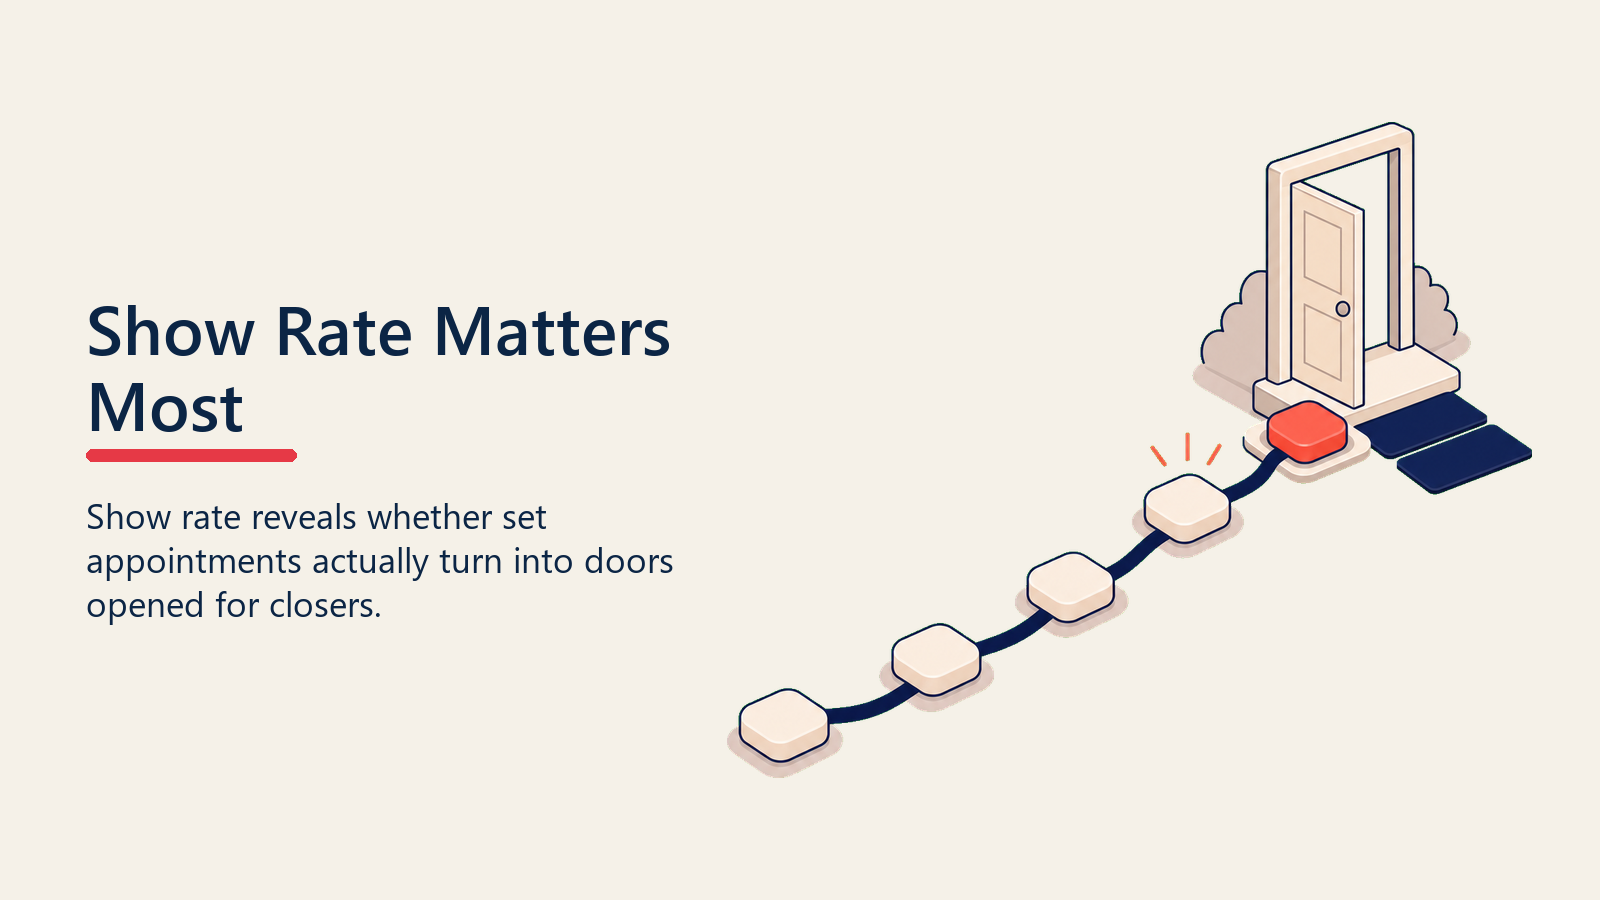
In residential solar, industry show rates range from 60-80% for well-managed teams. Below 60% is a significant problem. Every no-show costs a closer time that could have been spent on a real appointment, and it costs the company the fuel and travel overhead of a wasted trip. The scale of the opportunity matters: with the U.S. surpassing 6 million cumulative installations by Q1 2026 (SEIA) and surveys showing roughly 4 in 10 American homeowners have seriously considered going solar, setter teams are competing for a large but increasingly contested pool of prospects. Appointment quality, not just volume, is what determines which company converts them.
Show rate problems have several causes, and your dashboard should help you distinguish between them:
Setter-specific low show rate: when one setter's show rate is consistently below team average, the problem is usually in how they're qualifying appointments. They may be setting appointments with low commitment, using language that creates ambiguity ("we'll swing by around 2") rather than confirmed scheduled visits.
Lead source low show rate: when a specific lead source shows consistently low show rates across all setters, the problem is the lead quality itself. Purchased leads from certain vendors may have incorrect contact information or low intent. Your dashboard should surface this comparison automatically.
Day-of-week or time-of-day patterns: if show rates are consistently lower for appointments set on Mondays or for appointments scheduled after 6 PM, that's an operational adjustment you can make. Dashboards that break down show rate by appointment time slot reveal these patterns.
Confirmation process failure: when show rates drop suddenly without a change in setter or lead source, check whether your confirmation process is working. If your automated confirmation texts aren't sending, or if the confirmation call cadence has slipped, show rates will fall across the board.
For tactics to improve appointment completion, see no-show and reschedule reduction and confirming and prepping the appointment.
The Setter-to-Closer Handoff Quality Metric
One of the least-tracked but most valuable setter metrics is handoff quality: how well the setter documented the appointment and prepared the closer.
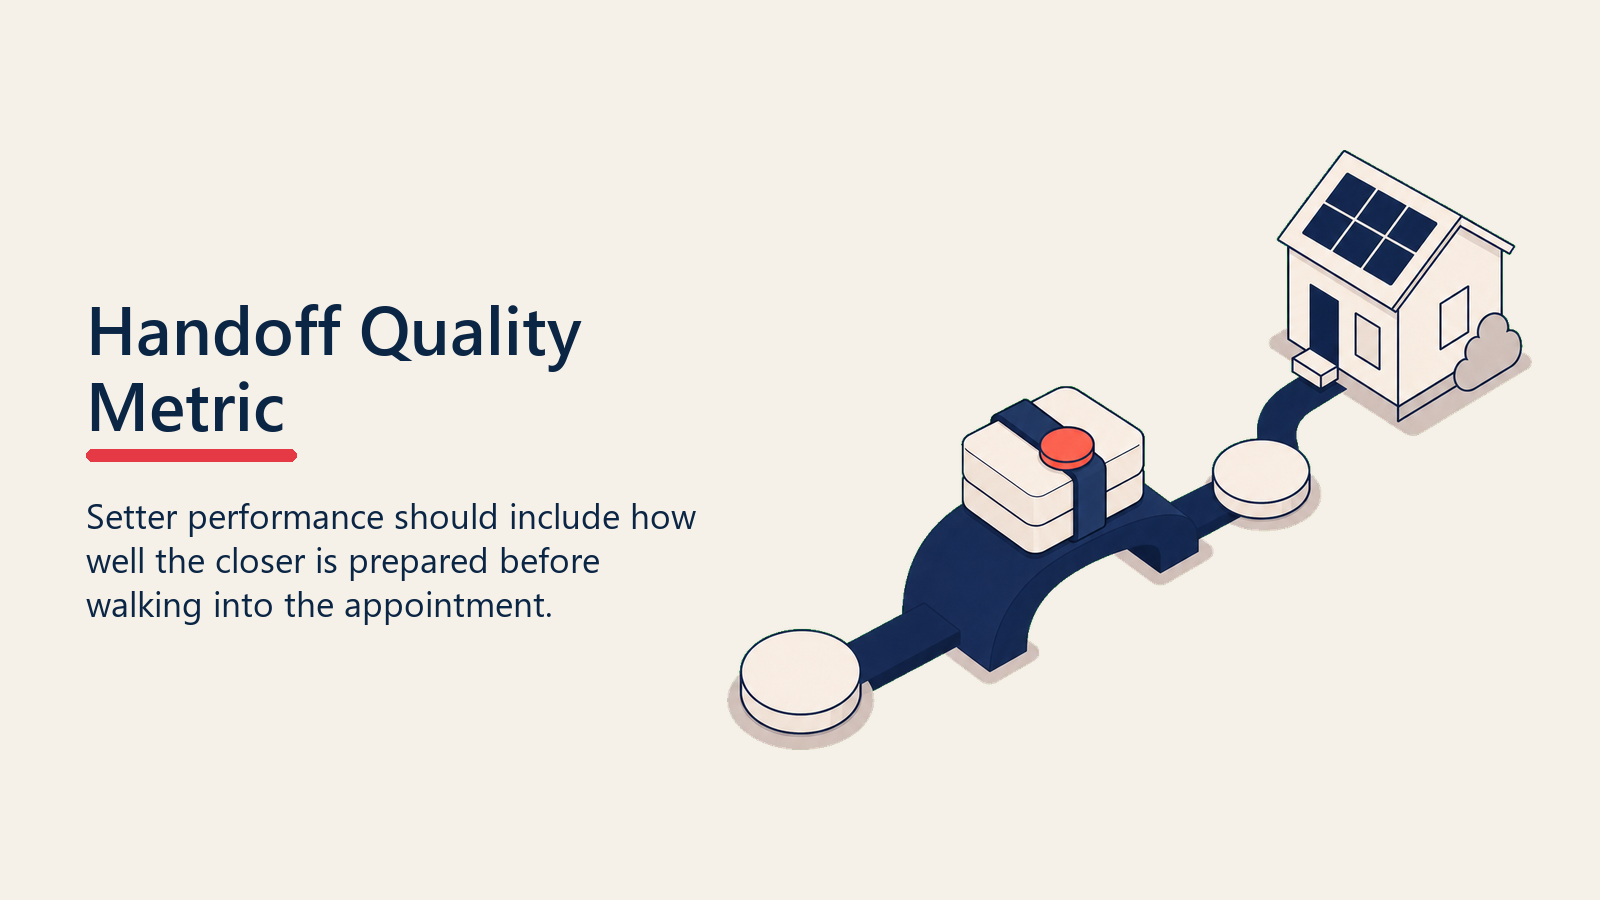
When a closer walks into an appointment, they should know:
- Which homeowners will be present
- The monthly utility bill amount
- Roof age (if known)
- Whether the homeowner has gotten quotes from competitors
- Any stated objections or concerns from the setter call
- The lead source and any context about how the lead came in
When that information is missing, the closer spends the first 10-15 minutes re-discovering what the setter already found out. The appointment loses momentum before it starts.
Track handoff quality by building a simple CRM validation: when a setter marks an appointment as confirmed, require specific fields to be completed (utility bill amount, decision-maker list, qualification status). The completion rate on those fields is your handoff quality score.
Review handoff quality as part of setter performance monthly. A setter who consistently books appointments but leaves fields blank is creating an invisible drag on closer performance.
See setter-to-closer handoff for the full handoff protocol and checklist.
Lead Quality Scoring and Dashboard Integration
Lead scoring lets you prioritize the contacts your setters work and gives managers visibility into the quality of the pipeline before it becomes appointments.
A simple lead score for residential solar assigns points based on:
| Factor | Points |
|---|---|
| Homeowner (vs. renter) | +30 |
| Electric bill $150+ monthly | +20 |
| Electric bill $250+ monthly | +30 (instead of +20) |
| Roof age under 10 years | +15 |
| South-facing roof available | +10 |
| No HOA restrictions | +10 |
| Prior solar inquiry or quote | +15 |
| Referred by existing customer | +25 |
| Financing pre-qualified | +20 |
Leads scoring 70+ are "A" tier. These get same-day setter contact and priority appointment scheduling. Leads scoring 40-69 are "B" tier. Below 40 are "C" tier and may be worked by canvassing setters or lower-priority follow-up sequences.
When lead score is visible on the setter dashboard alongside booking rate and show rate, you can test whether higher-scored leads actually convert at better rates in your market. They usually do, but the magnitude varies. Tracking it tells you how much to weight scoring in your setter prioritization.
For the full framework on lead pre-qualification and scoring, see solar lead qualification and prescreening and the broader qualification principles in lead scoring systems.
Daily Setter Management Using Dashboard Signals
The setter dashboard isn't just for weekly reporting. It should drive daily management decisions.
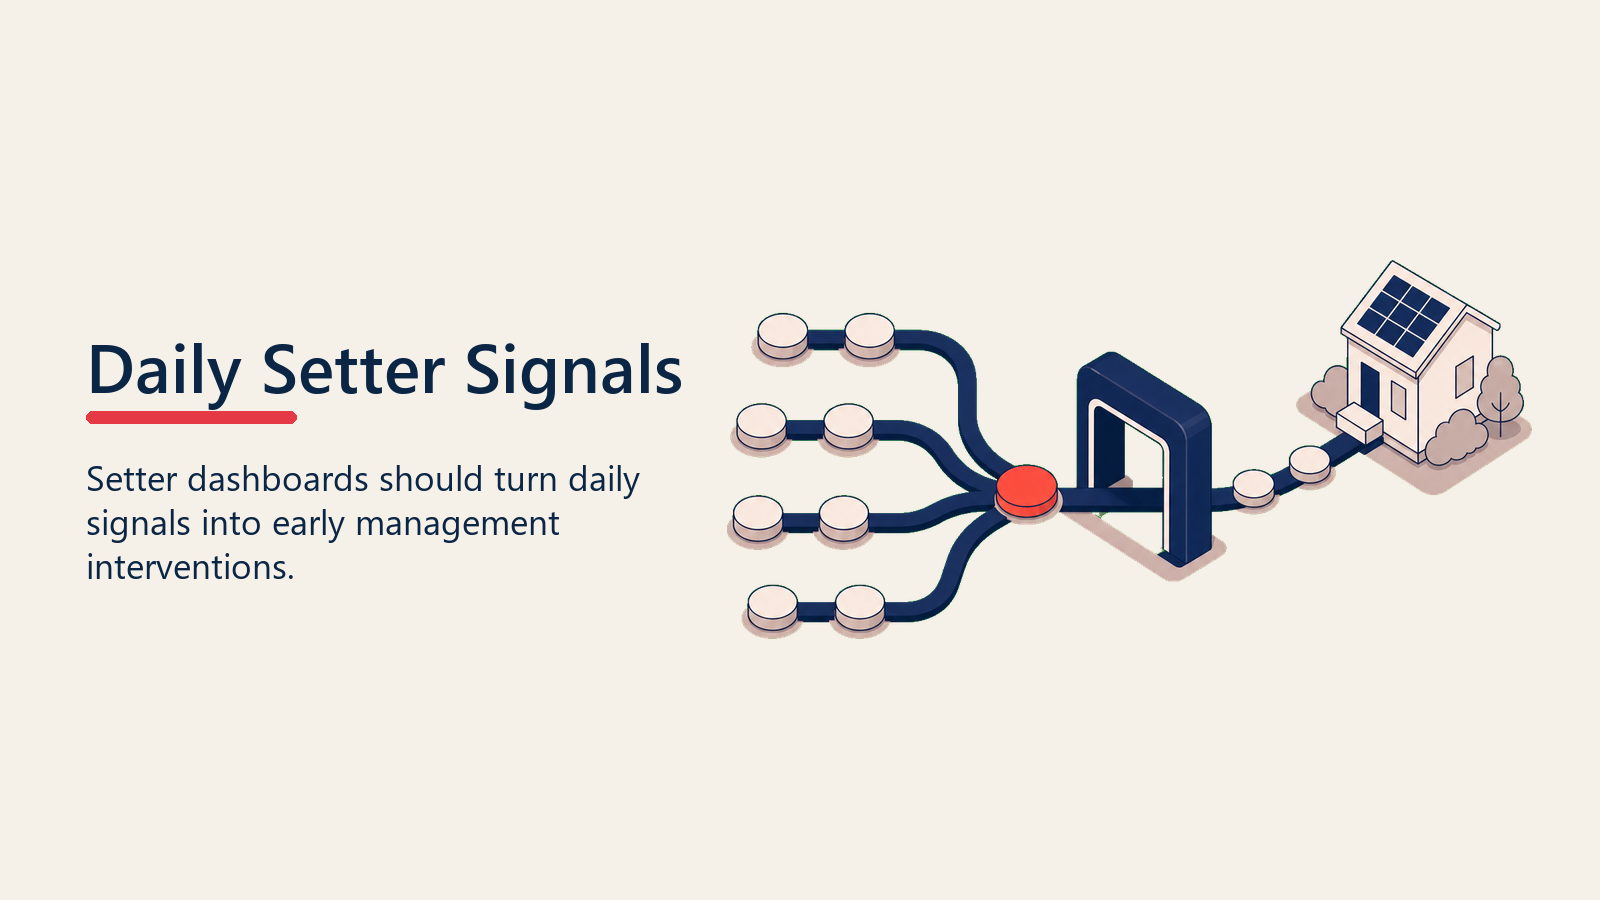
A solar setter manager checking the dashboard at 9 AM should be able to answer in under two minutes:
- How many appointments have been set so far this week versus the target pace?
- Which setters are behind pace for the week?
- Are any setters showing a drop in show rate compared to their 30-day average?
- How many appointments are confirmed for tomorrow's schedule?
- Any appointments on tomorrow's calendar that haven't been confirmed yet?
When a setter is behind pace mid-week, the manager can intervene early: check in on what they're working, identify if they're stuck on a bad lead list, or listen to call recordings to identify script or qualification problems.
When show rate drops for a specific setter, the manager can pull a sample of their recent appointment notes and listen to recordings to find out whether the problem is in how they're setting commitment ("I'll try to stop by") versus confirming it ("I have you down for Tuesday at 5 PM, and I'll be calling you Monday to confirm both of you will be home").
These interventions are only possible when the data is visible in real time and the manager has a habit of checking it daily. A dashboard reviewed weekly is a reporting tool. One reviewed daily is a management tool.
Connecting Setter Performance to Closer Outcomes
The most complete picture of setter performance comes from tracking what happens to their appointments all the way to close.
Set up your CRM to link every appointment back to the setter who booked it. Then pull, monthly, the close rate of each setter's appointments.
This tells you things that no setter-level metric alone can reveal:
- Setter A books 25 appointments a month. Their show rate is 78%. But their closer close rate is 12%. Their appointments are showing up, but the homeowners aren't interested in solar. Setter A may be booking appointments by misrepresenting what the consultation is for.
- Setter B books 15 appointments a month. Their show rate is 65%. But their closer close rate is 31%. The appointments that do show are genuinely qualified. Setter B is being conservative with their commitments but delivering high-value opportunities.
On volume alone, Setter A looks better. On economics, Setter B is generating more revenue per appointment run. If you're paying setters per appointment set, Setter A's incentive structure is working against you.
This analysis feeds directly into commission and quota design decisions. See solar commission and comp design for the comp structures that align setter behavior with closer outcomes.
When setter appointments are genuinely well-qualified, closers can engage retention thinking from the very first consultation: a homeowner who feels well-served from the setter call through the proposal is far more likely to refer neighbors and become a repeat customer for battery or HVAC additions. The setter's pre-qualification is the first link in that chain. See retention fundamentals for how that post-sale relationship compounds.
Quotable Nuggets
"On volume alone, Setter A looks better. On economics, Setter B is generating more revenue per appointment run." Volume and close rate of setter-sourced appointments tell opposite stories. You need both columns visible side by side before making any setter management decision.
32% of low-turnover field sales teams say they cannot operate without real-time field data, versus just 10% of high-turnover teams. (SPOTIO, State of Field Sales 2026) The gap points to dashboard access as a cultural signal, not just an operational tool.
"A dashboard reviewed weekly is a reporting tool. One reviewed daily is a management tool." The difference in outcome between those two behaviors is compounded over an entire quarter.
Which Tool Should You Build Your Setter Dashboard In?
The Volume-Quality Matrix: Plot every setter on a 2x2 with appointments set (volume) on one axis and show rate or closer close rate (quality) on the other. This produces four setter profiles. High volume and high quality: protect and replicate their process. High volume and low quality: investigate whether they're booking genuine interest or just filling time slots. Low volume and high quality: understand what's capping their output and remove the constraint. Low volume and low quality: this is your highest coaching priority. The matrix makes the management conversation precise instead of vague.
Lead and setter dashboards can be built in several ways, depending on your tech stack:
Inside your CRM (simplest): Most solar CRMs and general CRMs like HubSpot and Salesforce have built-in dashboard features. You can build setter-level views, show rate tracking, and pipeline-by-stage views without additional tools. This works if your CRM data is clean and your reps update stages consistently. Dashboard access is a management tool and a cultural signal. Teams that use real-time data daily perform differently from those that review it weekly.
BI tools (most flexible): Tools like Looker, Power BI, or Metabase connect directly to your CRM database and let you build more custom views, including cross-source lead quality analysis and historical trend charts. Better for teams with more complex reporting needs or multiple data sources.
Solar-native dashboards: Some solar-specific platforms (Sunbase, Solar Success, JobNimbus) include setter tracking and funnel visibility built in. These are faster to deploy but less customizable.
Spreadsheet-based (smallest teams): For teams under 10 setters with simpler operations, a weekly Google Sheet updated from CRM exports can cover the basics. The limit is that it requires manual work and is only as current as the last export.
Whatever tool you use, the dashboard has to be built for the person who needs to act on it. A setter's dashboard should show their own numbers prominently. A manager's dashboard should show the team view with the ability to drill into any individual. An owner's dashboard should show revenue forecast and pipeline health at a glance.
The Feedback Loop: Setter Dashboard to Training to Performance
Dashboards create value only when they connect to action. The most common failure mode is building a great dashboard and then using it only for retrospective reporting.
Build a feedback loop between your setter dashboard and your training program:
- Dashboard surfaces a pattern: show rate for canvassing-sourced appointments is 12 points below referral-sourced appointments.
- Manager investigates: pulls recordings of canvassing appointment-setting calls. Identifies that canvassing setters are not verifying homeowner presence at time of appointment.
- Training response: add a call verification step to the canvassing setter script. "I want to make sure we get the most out of your time. Can you confirm you'll be home at 5 PM on Tuesday, and is your spouse or partner usually home then too?"
- Dashboard tracks: over the next 30 days, does the show rate for canvassing appointments improve?
That's a closed-loop improvement cycle. The dashboard surfaced the hypothesis. The investigation found the specific behavior. The training addressed it. The dashboard confirmed whether it worked.
Qualifying which leads deserve setter time also connects to opportunity qualification: the same signal-reading that sales teams apply to pipeline deals applies to pre-appointment leads. A setter who learns to read early qualification signals accurately sets fewer appointments but produces more revenue per appointment run.
This is how data transforms setter management from gut-feel coaching to systematic improvement. It applies equally to lead quality decisions, appointment scheduling, and the handoff process that delivers qualified, prepared opportunities to your closers.
The top of your funnel is where the game is won or lost before the closer ever rings the doorbell. Lead and setter dashboards are how managers stay ahead of problems rather than reacting to them at the end of the month.
Frequently Asked Questions about Lead and Setter Performance Dashboards
What metrics should a solar setter dashboard include?
At minimum: contacts reached per day, appointments set per day and week, booking rate (appointments set divided by contacts reached), show rate (appointments completed divided by appointments set), and the close rate of setter-sourced appointments tracked back through the closer's outcome. Volume metrics tell you how productive a setter is. Quality metrics tell you how valuable their productivity is. You need both. Most dashboards track only the volume side and miss the signal entirely.
What's a good show rate target for a residential solar setter team?
Well-managed teams with active confirmation processes typically achieve 70 to 80% show rates. Below 65% indicates a process problem, not just a lead quality problem. Before blaming lead source, check whether confirmation sequences are running correctly and whether setters are using language that creates firm commitments rather than ambiguous appointments. "I'll swing by around 2" produces very different show rates than "I have you confirmed for Tuesday at 2 PM, and I'll call Monday to confirm both of you will be home."
How do you identify when a setter is gaming the volume metric?
Look at the close rate of their appointments tracked back to the closer's outcome. A setter with a high booking rate but low closer close rate is either misrepresenting the consultation purpose to get on the calendar, setting appointments with homeowners who don't meet basic qualification criteria, or booking contacts who have low genuine interest just to hit numbers. The tell is a big gap between their volume rank and their quality rank. Pull both columns side by side on the leaderboard and that pattern becomes visible immediately.
What's the difference between show rate and sit rate, and do you need to track both?
Show rate is the percentage of appointments where the homeowner answers the door. Sit rate is the percentage of completed appointments where the closer runs a full consultation rather than leaving early due to a clear disqualifier (renter, no suitable roof, no financial interest). Show rate tells you whether setters are booking real intent. Sit rate tells you whether they're qualifying homeowners accurately before the appointment. Track both if you have enough volume to get signal from each. For smaller teams, show rate is the higher-priority metric.
How do you use the setter dashboard to intervene before problems compound?
Check it daily, not weekly. A setter dashboard checked every morning answers: who is behind their weekly pace as of today, which setters are showing a show rate drop versus their 30-day average, and how many appointments for tomorrow are still unconfirmed. When a setter is behind pace mid-week, you can intervene before the week is lost. When show rate drops for a specific setter, you can pull a sample of their recent notes or call recordings that day, not at the end of the month when the pattern is already set.
How do you connect setter performance to closer outcomes in your CRM?
Configure your CRM so every appointment record links to the setter who booked it. Then pull monthly: the show rate, the sit rate, and the close rate by closer for each setter's appointments. This is the only view that tells you whether a setter's activity is generating revenue or just activity. Set this up as a saved report that runs automatically each month so you don't have to build it from scratch every time you want to answer the question.
What should a setter dashboard look like compared to a manager's dashboard?
A setter's dashboard should lead with their own numbers prominently: today's contacts, today's sets, this week's show rate. The team view should be visible but secondary. A manager's dashboard should show the team view first, with the ability to drill into any individual setter's metrics. A solar company owner's dashboard should show pipeline health, weighted revenue forecast, and appointment volume versus target, with setter-level detail two clicks away. Build dashboards for the person who needs to act on them, not for the person who wants to report on them.

Senior Implementation Consultant
On this page
- What a Setter Dashboard Needs to Measure
- Building the Setter Dashboard
- Lead Source Quality Tracking
- Show Rate: The Most Important Top-of-Funnel Metric
- The Setter-to-Closer Handoff Quality Metric
- Lead Quality Scoring and Dashboard Integration
- Daily Setter Management Using Dashboard Signals
- Connecting Setter Performance to Closer Outcomes
- Which Tool Should You Build Your Setter Dashboard In?
- The Feedback Loop: Setter Dashboard to Training to Performance