Lead Scoring Systems: Predictive Intelligence for Sales Prioritization
Turn this article into takeaways for your work.
Each assistant summarizes the article only for you and suggests best practices for your work.
Here's a painful truth: B2B sales teams waste significant time chasing leads that'll never convert. Oracle Research puts the figure at 75% of sales reps' time spent on unqualified leads. Not because teams are lazy or incompetent, but because they're flying blind. Every lead looks the same in the CRM until someone spends hours working it, only to discover it was never going anywhere.
Lead scoring solves this problem by answering one question: which leads are most likely to buy? A well-designed scoring system acts like a filter, separating signal from noise so your team focuses energy where it matters. But here's the catch - most scoring models fail. They're either too simplistic to be useful or so complex that nobody trusts them.
This guide shows you how to build scoring systems that actually work. We'll cover the frameworks, the math, and the operational integration that turns scores from numbers into action.
Key Facts: Lead Scoring
- Companies using lead scoring see a 77% increase in lead generation ROI compared to those that don't, according to MarketingSherpa's survey of 1,745 marketers.
- Organizations that excel at lead nurturing generate 50% more sales-ready leads at 33% lower cost, per Forrester Research.
- Aberdeen Group found that companies with mature lead scoring systems report up to 18% more revenue than those without.
- Only 44% of organizations currently categorize their leads using any scoring method, despite the proven ROI, according to Landbase's 2025 B2B research.
- 61% of B2B marketers send all leads directly to sales, even though only 27% of those leads are actually qualified and sales-ready (Landbase, 2025).
What is lead scoring?
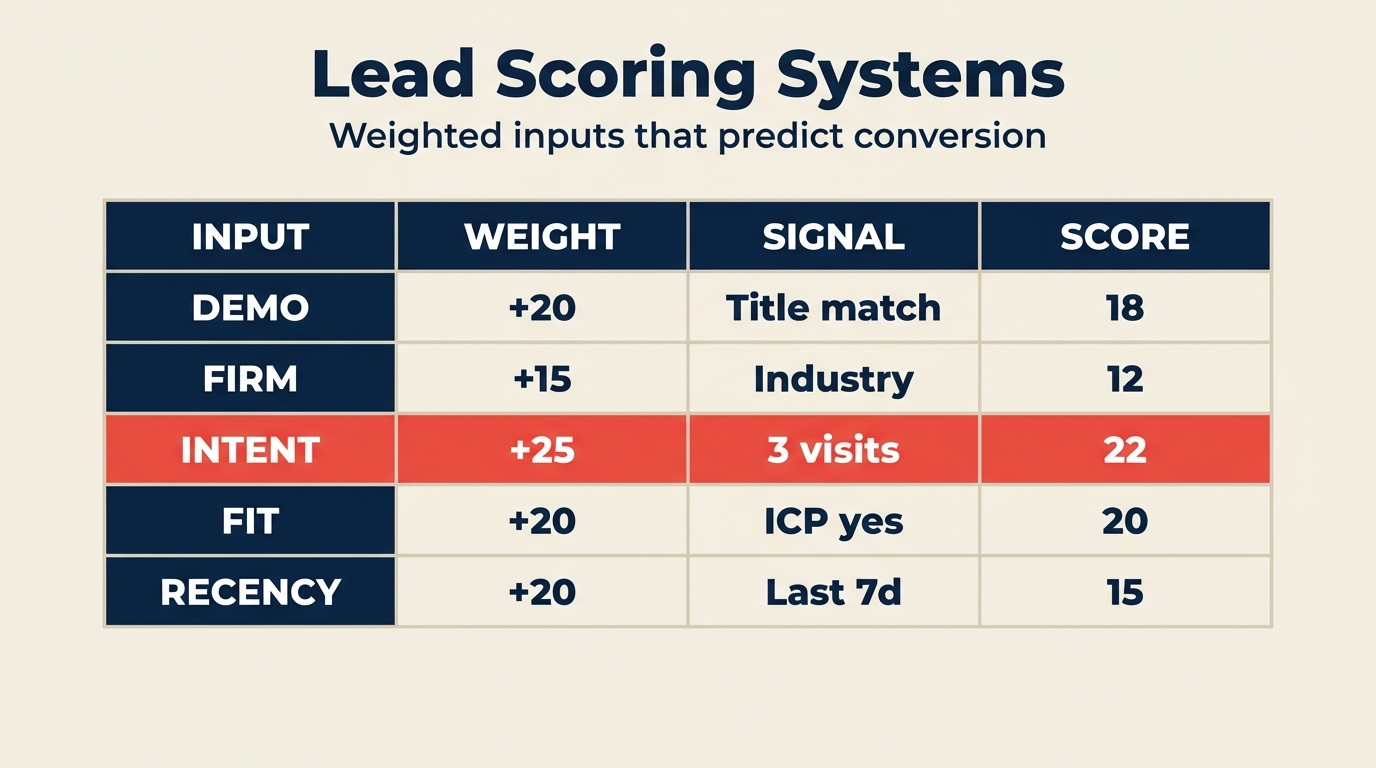
Lead scoring assigns numerical values to leads based on how closely they match your ideal customer profile and how engaged they are with your company. Think of it like a credit score, but instead of predicting loan repayment, you're predicting purchase likelihood.
The concept is simple: some characteristics and behaviors indicate buying intent better than others. Understanding different types of leads is crucial before building your scoring model. A VP at a 500-person company who visited your pricing page three times is more valuable than an intern at a 10-person company who downloaded one whitepaper six months ago. Scoring quantifies that intuition.
But there's a distinction most people miss. You're not just predicting "good vs bad" leads. You're trying to predict timing. Will this lead convert in 30 days? 90 days? Never? That time dimension matters because it affects what you do with the lead and how they move through lead lifecycle stages.
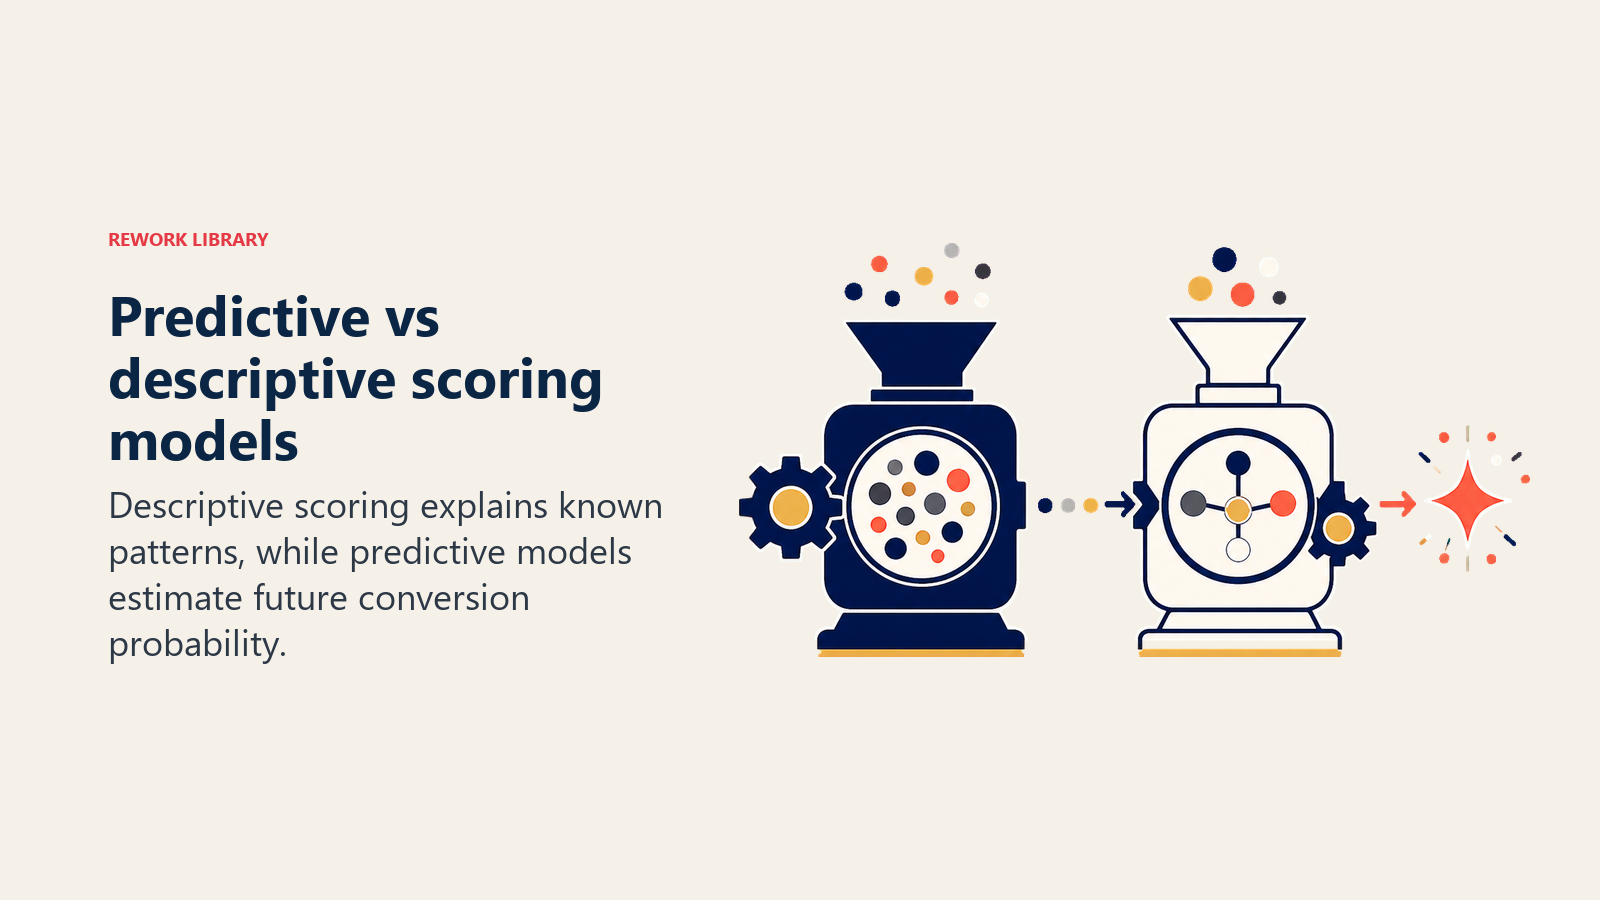
Predictive vs descriptive scoring models
Predictive and descriptive scores answer different questions: likely conversion versus visible fit and engagement.
There are two ways to build a scoring model, and they're fundamentally different.
Descriptive models use rules you define manually. "If company has 100+ employees, add 10 points. If they visited the pricing page, add 15 points." You're describing what you think matters based on experience and assumptions.
Predictive models use machine learning to analyze historical data. The algorithm looks at thousands of past leads, identifies patterns in what converted, and builds a model that predicts future conversions. You're letting the data tell you what actually matters.
Descriptive models are easier to start with and explain. Everyone understands "we value enterprise companies more." But they're only as good as your assumptions, and assumptions are often wrong.
Predictive models are more accurate if you have enough historical data (usually 500+ closed deals minimum). But they're black boxes that can be hard to trust or explain to sales teams who want to know why a lead scored high or low.
Most effective systems use a hybrid approach: start with descriptive rules, then layer in predictive intelligence as you gather data.
The two-dimensional scoring framework
Here's where most companies get it wrong: they create a single score that mashes together completely different information. A lead gets 75 points, but you don't know if that means they're a perfect fit who's barely engaged, or a terrible fit who's extremely active.
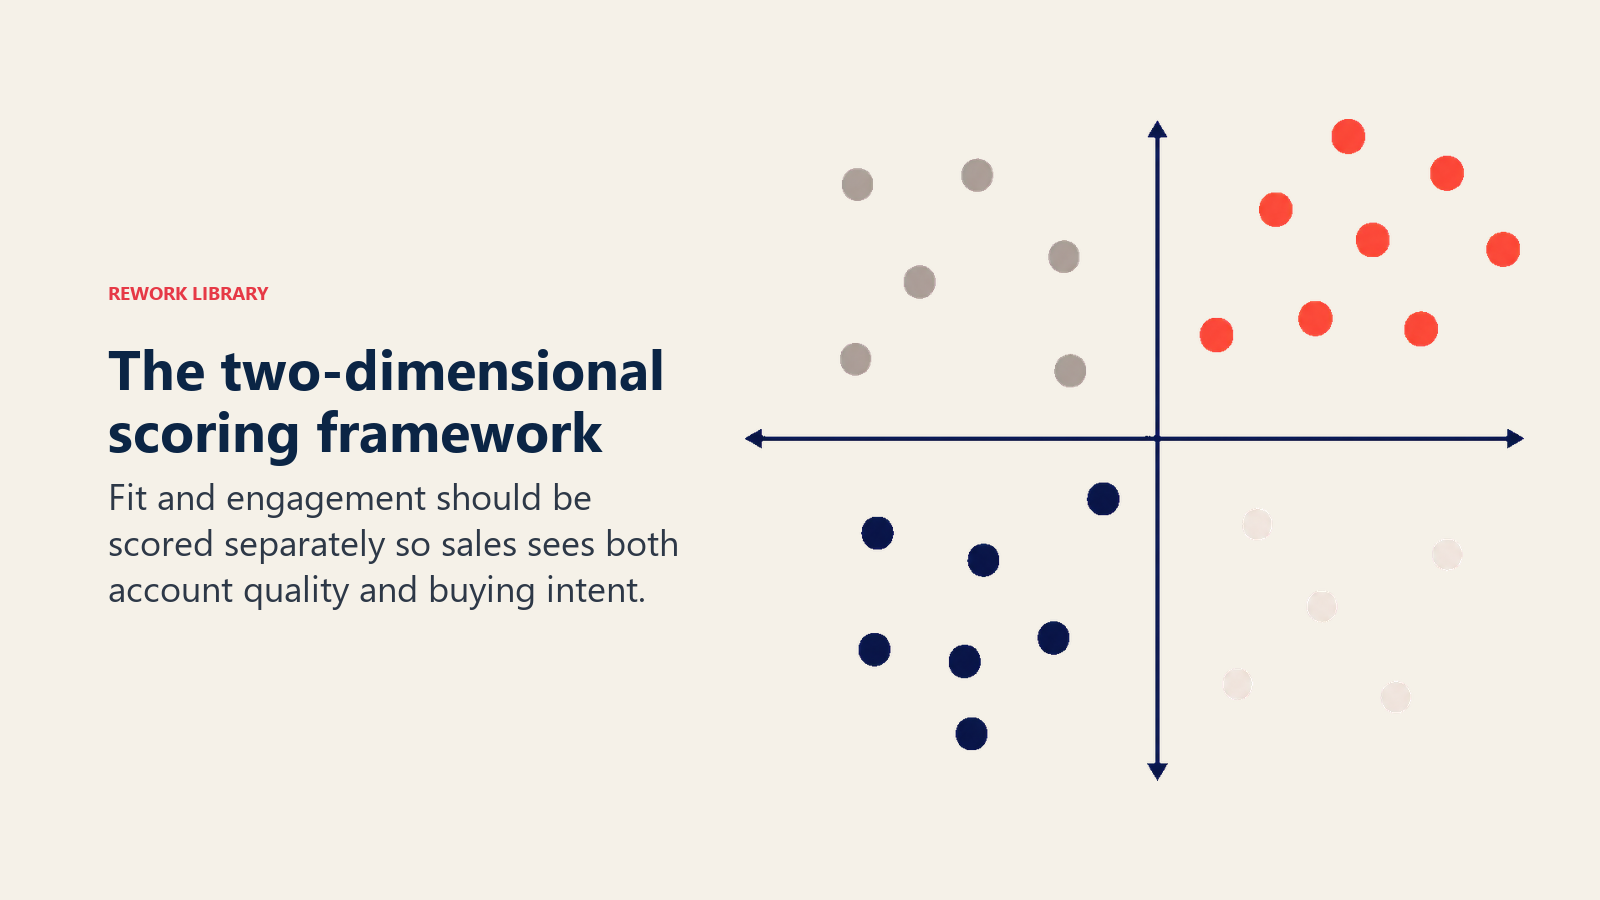
The solution is two separate scores that measure different things:
Dimension 1: Profile/Fit Score - Does this lead match your ideal customer profile? This is about who they are: company size, industry, role, budget. It's relatively static and based on firmographic data that you gather through lead data enrichment.
Dimension 2: Behavioral/Engagement Score - Is this lead showing buying intent? This is about what they're doing: website visits, content downloads, email clicks, demo requests. It's dynamic and changes as they interact with you.
When you plot these two dimensions on a matrix, you get four quadrants:
- High Fit, High Engagement: Your hottest leads. Route these to sales immediately using your lead distribution strategy.
- High Fit, Low Engagement: Good targets for nurture campaigns. They match your ICP but aren't ready yet.
- Low Fit, High Engagement: Probably tire-kickers or students. Don't waste sales time here.
- Low Fit, Low Engagement: Disqualify or deprioritize entirely.
This two-dimensional approach gives you nuance. You can make smarter routing decisions because you understand the why behind the score.
Building your profile/fit score
The fit score answers: "If this lead was ready to buy today, would we want them as a customer?"
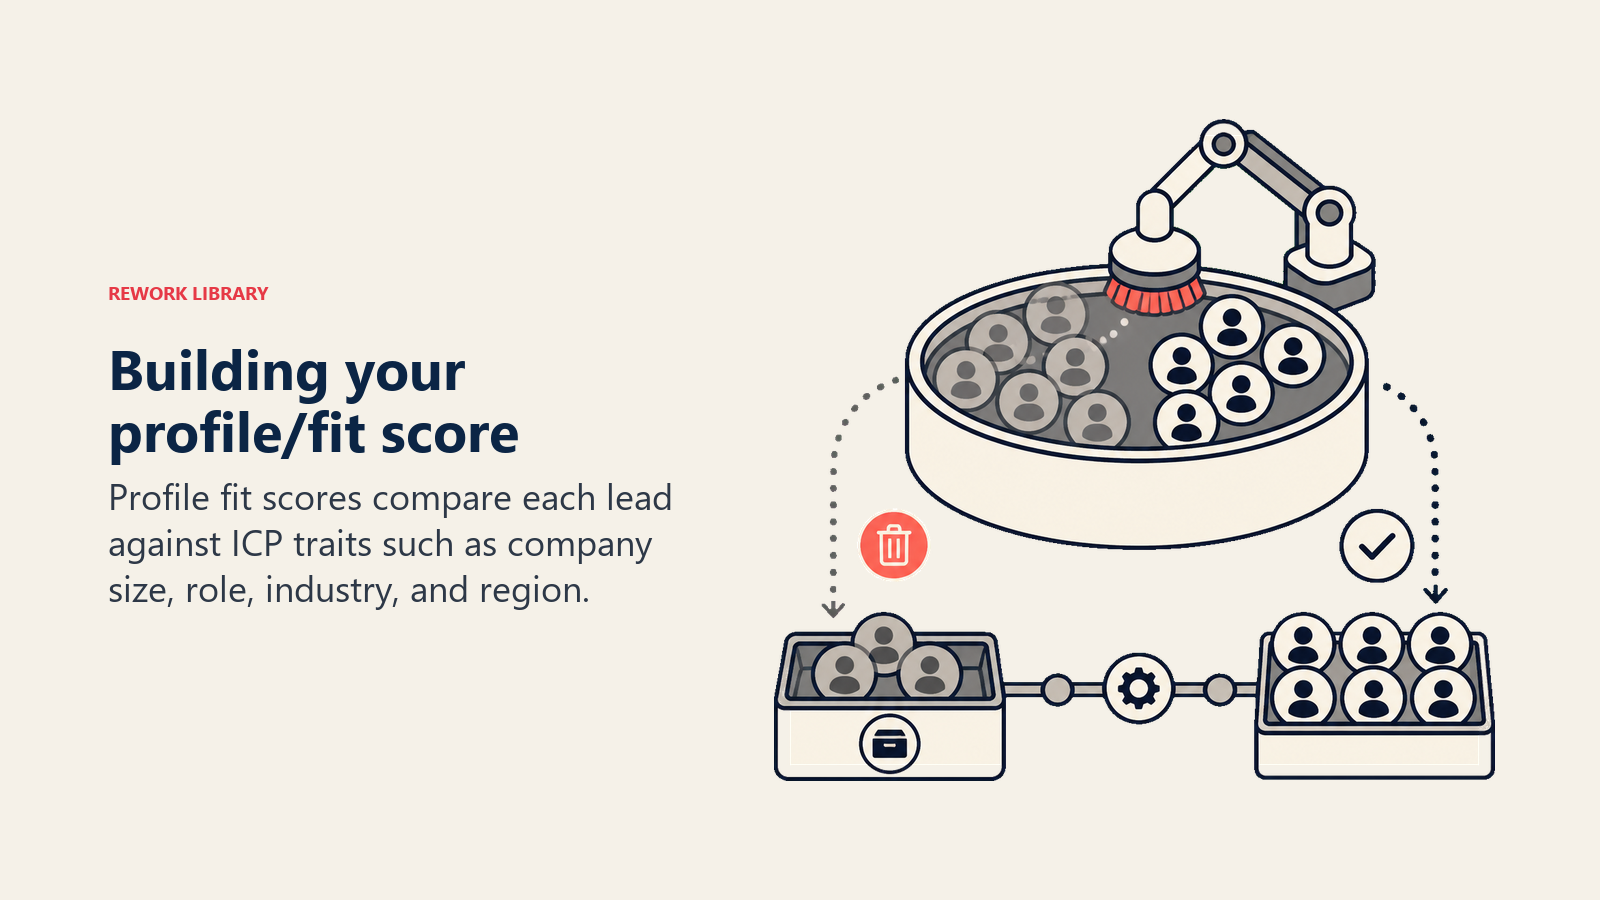
Start by analyzing your best customers. What do they have in common? You're looking for attributes that correlate with deal size, retention, and profitability. Common factors include:
Company size and revenue: Bigger isn't always better, but there's usually a sweet spot. If your best customers have 200-2,000 employees, score leads in that range higher. Companies outside that range get fewer points or even negative points.
Industry and vertical: Some industries convert at 3x the rate of others. If you're a fintech selling to financial services companies, they should score higher than retail companies. Be specific - "healthcare" is too broad. Hospital systems vs medical device manufacturers vs health insurance have different needs.
Job title and seniority: You want decision-makers or influencers. A VP of Sales scores higher than a Sales Coordinator. But watch out for title inflation - "Head of Growth" at a 5-person startup isn't the same as at a 500-person company.
Geographic location: If you only serve North America, European leads score lower. If you have regional pricing, that affects target customer value.
Technology stack: B2B companies often show intent through the tools they use. If they're using Salesforce, Marketo, and Gong, they're mature buyers who invest in software. If they're on free tools only, they might not have budget.
Company signals: Funding rounds, growth trajectory, recent news. A company that just raised a Series B is more likely to buy than one that's stagnant.
But here's the key: negative scoring for disqualifiers. If a lead doesn't meet basic criteria (wrong geography, competitor, student), subtract points or set their fit score to zero. Don't let engagement scores override fundamental misalignment.
Sample fit scoring model
| Attribute | Points |
|---|---|
| Company size 200-2,000 employees | +20 |
| Company size 50-199 employees | +10 |
| Company size <50 or >2,000 | +5 |
| Target industry (financial services) | +15 |
| Adjacent industry (insurance, fintech) | +10 |
| C-level or VP title | +15 |
| Director or Manager title | +10 |
| North America location | +10 |
| Enterprise tech stack detected | +10 |
| Recent funding announcement | +5 |
| Disqualifiers | |
| Competitor | -100 |
| Student/personal email | -50 |
| Outside serviceable region | -50 |
This gives you a 0-100 fit score scale where 70+ is high fit, 40-69 is medium, and <40 is low.
Building your behavioral/engagement score
The engagement score answers: "Is this lead showing buying intent right now?"
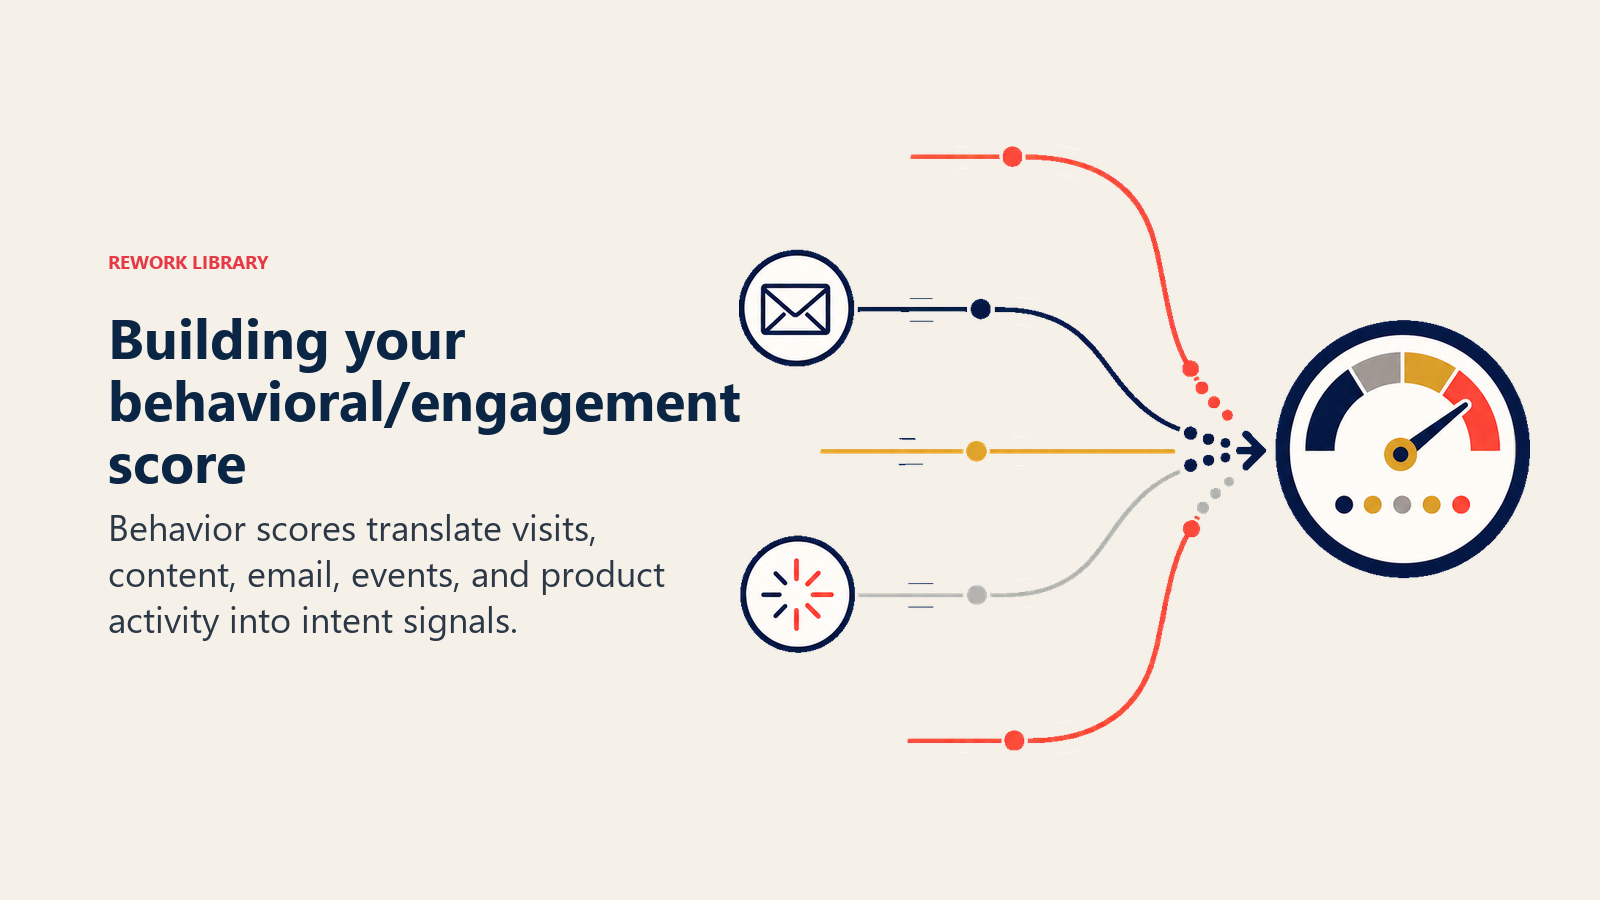
You're tracking actions that indicate interest and readiness. But not all actions are equal. Visiting your pricing page is a much stronger signal than reading a blog post. Attending a webinar shows more intent than downloading a PDF.
Website activity patterns: Page visits matter, but which pages and how many? Look at:
- Pricing page visits (strong intent signal)
- Product/features page visits (learning mode)
- Case studies and customer stories (validation seeking)
- Careers page (weak intent, might be job hunting)
- Frequency and recency of visits
Content consumption: Track what they download and actually engage with. A lead who downloads your ROI calculator and comparison guide is educating themselves on making a decision. Weight "bottom of funnel" content higher than awareness content gathered from inbound lead generation channels.
Email engagement: Open rates are okay, click rates are better. But the real signal is which links they click. Pricing and demo links are gold. Newsletter links are noise.
Event participation: Webinar attendance shows active interest and time investment. Even better if they asked questions or stayed for the full session. Conference booth visits or meeting requests from event lead generation are even stronger.
Form submissions: Demo requests and "contact sales" forms are obvious high-intent actions. But also track repeat form submissions - if someone downloaded three resources in a week, something triggered their research.
Social media interactions: LinkedIn engagement with your posts or following your company page. This is usually a weak signal on its own but adds context.
The critical factor is recency and velocity. A lead who visited your site five times this week is much hotter than one who visited five times three months ago. That's where score decay comes in.
Sample engagement scoring model
| Action | Points | Decay Rate |
|---|---|---|
| Demo request | +50 | No decay |
| Pricing page visit | +20 | -20% per month |
| Product page visit | +10 | -20% per month |
| Case study download | +15 | -20% per month |
| Blog post read | +3 | -30% per month |
| Email click (demo/pricing) | +15 | -20% per month |
| Email click (content) | +5 | -30% per month |
| Webinar attendance | +25 | -20% per month |
| LinkedIn engagement | +5 | -30% per month |
| Return visitor (same week) | +10 | -40% per month |
This creates a 0-100 engagement score that reflects current buying interest.
Score decay and freshness
Score decay keeps old engagement from making a stale lead look as urgent as a current buying signal.
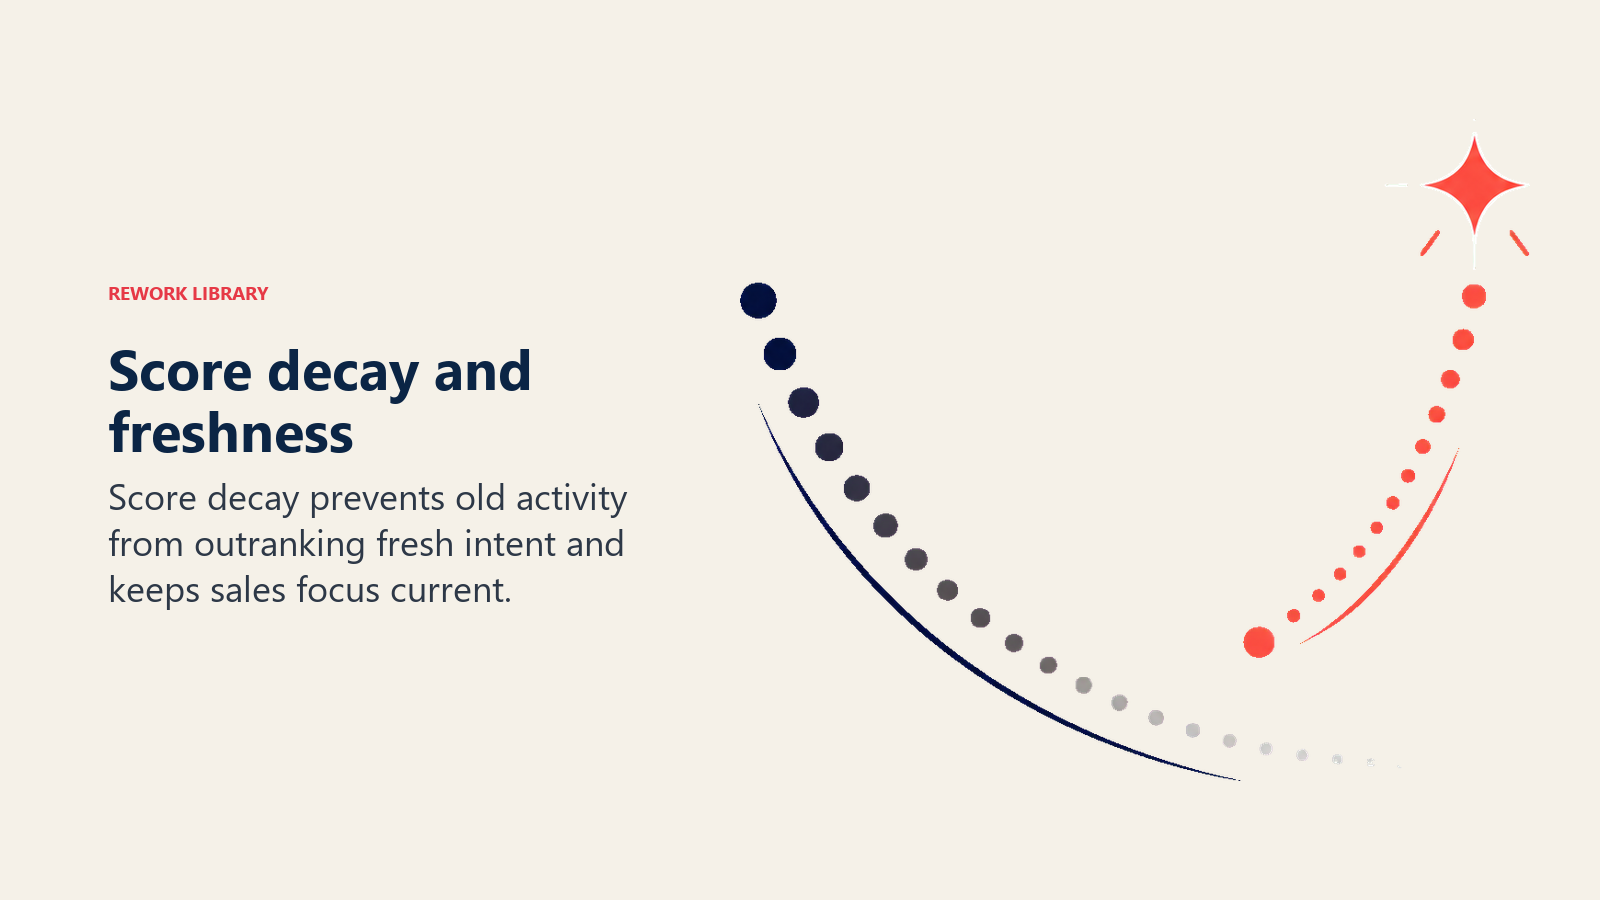
Here's what kills most scoring models: they accumulate points forever. A lead who was super engaged 18 months ago still has a high score even though they've gone dark. That's not predictive anymore.
Score decay solves this by reducing behavioral scores over time. If a pricing page visit adds 20 points but decays at 20% per month, that action loses value as it ages:
- Month 1: 20 points
- Month 2: 16 points
- Month 3: 13 points
- Month 4: 10 points
- Month 5: 8 points
After five months, that single action is barely contributing. The lead needs to show fresh engagement to maintain their score.
Decay rules of thumb:
- High-intent actions decay slower (demo requests might persist 3-6 months)
- Low-intent actions decay faster (blog reads might decay in weeks)
- Fit scores don't decay unless firmographic data changes
- Different sales cycles need different decay curves (enterprise software = slower decay than SMB SaaS)
You can also build re-engagement boosts. If a cold lead suddenly returns and takes multiple actions, their score should jump to reflect renewed interest. This is where velocity matters - three actions in one week is more meaningful than three actions in three months.
Operationalizing scores for routing and prioritization
Scores mean nothing if they don't change behavior. Here's how to actually use them.
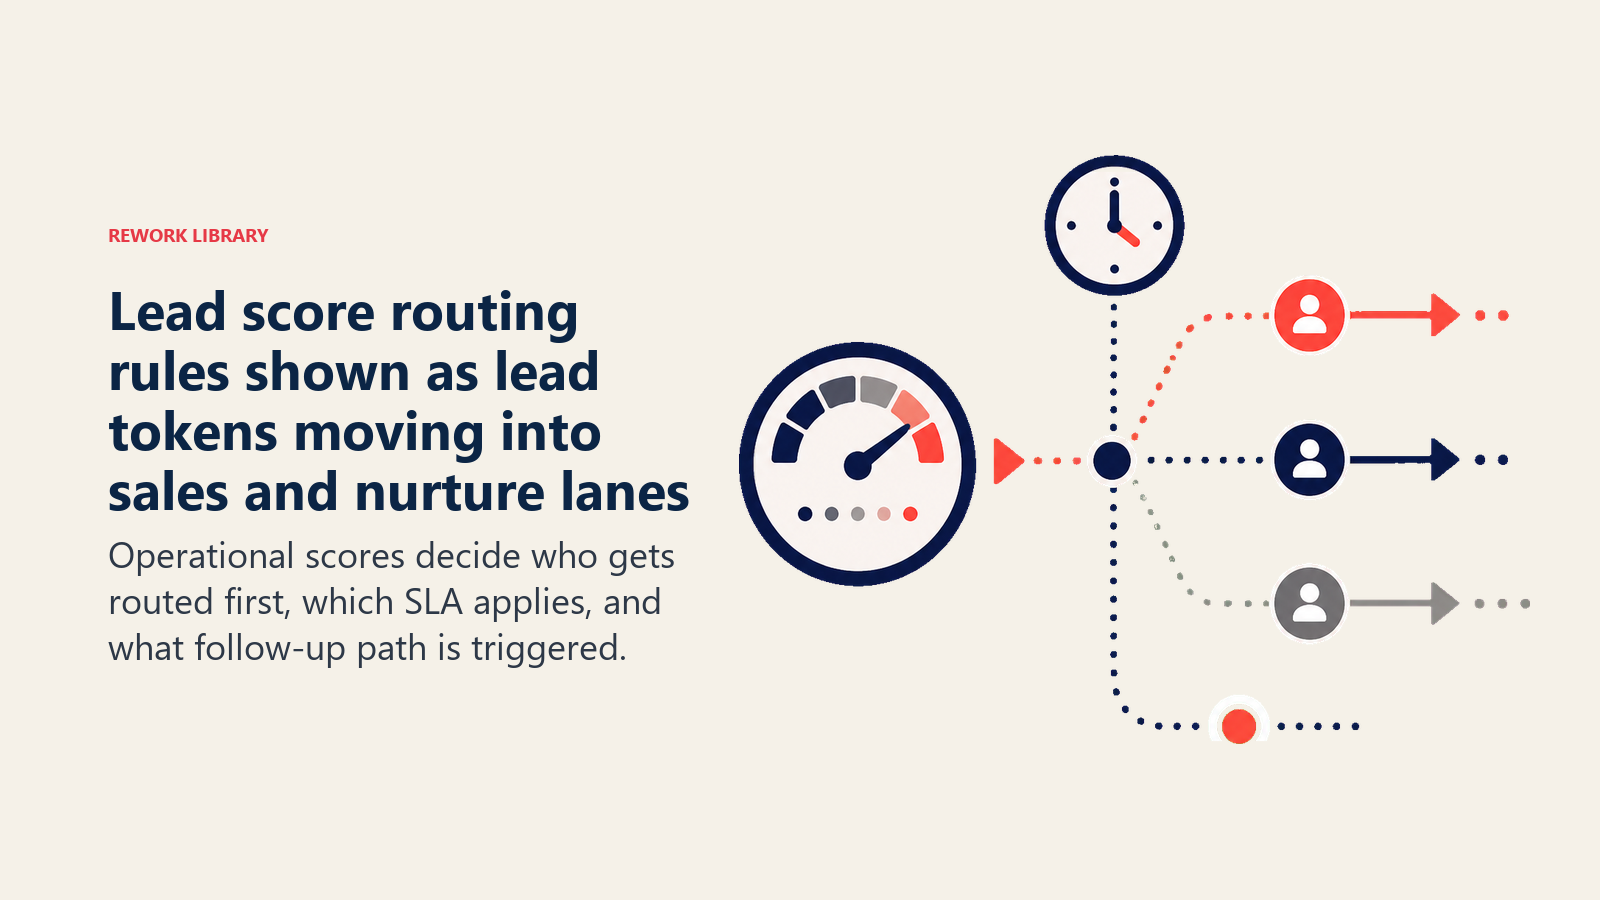
Routing decisions: Set thresholds that trigger different workflows through lead routing automation:
- High Fit + High Engagement (70/70+): Immediate sales routing, high-priority queue
- High Fit + Medium Engagement (70/40-69): Nurture track with sales-assisted touches
- Medium Fit + High Engagement (40-69/70+): Sales-qualified lead, but to different rep tier or team
- High Fit + Low Engagement (70/<40): Marketing nurture, no sales involvement yet
- Low Fit + Any Engagement: Disqualify or low-priority nurture
Prioritization queues: Even within "hot leads," scores create ordering through lead queue management. If 50 leads hit the threshold today, reps work the 95-pointers before the 75-pointers.
Nurture track assignment: Scores determine what content and cadence leads receive through lead nurturing programs. High-fit, low-engagement leads get education-focused nurture. Low-fit, high-engagement gets a polite "here's self-service" track.
Automated actions: Scores trigger workflows:
- Lead hits 80/80? Auto-create task for SDR with 2-hour lead response time SLA
- Lead drops below 40/40? Remove from active sequences
- Engagement score jumps 30 points in a week? Alert account owner
The key is transparency. Sales teams need to see the scores, understand them, and trust them. If reps start ignoring scores because they disagree with the model, you've failed.
Building your model: data analysis methodology
Don't guess at point values. Use your historical data to find what actually predicts conversions.
Start with closed-won deals from the last 12-24 months. For each one, trace back to the lead record and pull all the firmographic and behavioral data. Then do the same for closed-lost and disqualified leads using lead data management best practices.
Run correlation analysis to see which factors appear more often in won deals:
- Do won deals come from larger companies? How much larger?
- Which industries converted at above-average rates?
- What engagement patterns did converters show?
- How many touch points before conversion?
This gives you the foundation for attribute weighting. If 80% of your deals come from companies with 200+ employees but only 30% of your lead pool has that characteristic, employee count is a strong predictor. Weight it heavily.
If pricing page visits appear in 70% of conversions but only 20% of non-conversions, that's a strong signal. If blog post reads show no correlation to conversion, weight them lightly or ignore them.
Point allocation framework: Once you know relative importance, assign points proportionally. If company size is twice as predictive as industry, it should get roughly twice the points. Don't make every attribute worth 10 points just for neatness.
Threshold definitions: Your score distribution should roughly align with qualification rates based on your lead qualification frameworks. If 10% of your leads convert, your thresholds should flag about 10-15% of leads as "high priority." If you're flagging 50%, your model is too loose.
Test different cutoffs:
- At 80/80, what percentage converts? 30%? 50%? That determines if 80 is the right bar.
- At 60/60, what happens? If conversion drops to 5%, the spread between 60 and 80 is meaningful.
Implementation approaches: rules, AI, or hybrid
You have three options for building the actual scoring system.
Rule-based manual scoring: You define all the rules and point values explicitly. "If industry = financial services, add 15 points." This is the easiest to implement and explain. Use this if:
- You have limited historical data (<500 conversions)
- Your sales process is straightforward and aligned with lead-to-opportunity conversion best practices
- You need complete transparency for sales buy-in
- You're just starting with lead scoring
The downside: you're limited by your assumptions and can't adapt to complex patterns.
Predictive AI/ML scoring: Machine learning models analyze your data and find patterns automatically. They can weigh hundreds of variables and interactions you'd never spot manually. Use this if:
- You have substantial historical data (1,000+ conversions ideal)
- Your ICP is complex or multi-faceted
- You have data science resources or budget for platforms like 6sense, MadKudu, or Einstein Scoring
- You're comfortable with some "black box" scoring similar to customer health scoring in SaaS
The downside: harder to explain and tune. If the model produces weird results, debugging is tough.
Hybrid models: Start with rule-based scoring for major factors, then layer in predictive models for fine-tuning. For example:
- Use rules for disqualifiers and basic fit criteria
- Use ML to predict engagement-to-conversion likelihood similar to product qualified leads scoring in PLG companies
- Combine both into a composite score
This gives you the best of both worlds: transparency where it matters and sophistication for complex patterns.
Most companies should start with rules, then add prediction as they mature.
Model performance and optimization
Your initial model will be wrong. That's fine. What matters is how you improve it.
Validation methodology: Track these metrics monthly using conversion rate analysis:
- Conversion rate by score band (what % of 80+ leads convert vs 60-79 vs 40-59?)
- Score distribution (are you flagging too many or too few leads?)
- False positive rate (high-scoring leads that don't convert)
- False negative rate (low-scoring leads that do convert - these are expensive misses)
If your model is working, you should see a clear gradient: higher scores = higher conversion rates at every threshold.
A/B testing approaches: Don't change everything at once. Test one variable at a time:
- Test different point values (does 20 points for pricing page visit work better than 15?)
- Test different decay rates
- Test different qualification thresholds
- Run parallel scoring models on a sample and compare results
Track not just conversion rates but also sales feedback. If reps consistently complain that high-scoring leads are junk, your model is broken regardless of what the math says.
Continuous refinement: Revisit your model quarterly:
- What's changed in your ICP? New market segments performing better?
- What new engagement channels exist? (TikTok wasn't a B2B channel three years ago)
- Are there new disqualifiers? (Economic conditions creating new "never buy" profiles)
- Has your product changed in ways that affect who's a good fit?
Scoring isn't a one-time project. It's an ongoing system that evolves with your business.
Common scoring mistakes to avoid
Scoring too many things: If you have 40 different attributes, each worth 2-3 points, your model is noise. Focus on the 8-10 factors that drive 80% of the signal.
Ignoring sales feedback: If reps say scored leads are low-quality, don't dismiss it. Either your model is wrong or your sales training is wrong. Figure out which.
Not accounting for different buyer journeys: Enterprise deals take 9 months and involve 7 people following a complex enterprise buying process. SMB deals take 3 weeks and one decision-maker. You probably need different models or at least different thresholds.
Letting marketing games the system: If you run a big conference and suddenly everyone has 50 engagement points from attending, your scores become meaningless. Event attendance is valuable but needs context.
Treating scores as absolute truth: A score of 75 doesn't mean "this lead will 100% buy if we call them." It means "based on historical patterns, leads like this convert at X%." Probabilities, not guarantees.
Making scoring stick in your organization
The best scoring model fails if nobody uses it. Here's how to drive adoption:
Start simple: Launch with a basic model, get buy-in, then add complexity. Don't roll out a sophisticated ML system on day one if your team has never used scoring before.
Make scores visible: Put them on lead records, in views, in reports through effective lead status management. If reps can't see scores in their daily workflow, they'll ignore them.
Train on the why: Explain what drives scores up or down. When reps understand that demo requests add 50 points but blog reads add 3, they'll trust the prioritization.
Show the ROI: Track conversion rates by score band and share results. "Reps who focus on 80+ leads close 40% more deals" is a compelling argument that demonstrates the value of proper lead follow-up best practices.
Iterate with feedback: Create a channel for reps to flag bad scores. "This lead scored 85 but was completely unqualified because..." Those examples help you refine the model.
Tie scores to comp (carefully): If your comp plan only credits closed deals, reps will cherry-pick leads regardless of score through cherry-pick lead selection. If you measure on how effectively they work scored leads, behavior changes. But be careful not to create perverse incentives.
Where to go from here
Lead scoring is the foundation for intelligent lead management. Once you have reliable scores, everything else gets easier:
- Lead distribution becomes logical - route high scores to your best reps
- Lead nurturing becomes targeted - different tracks for different score profiles
- Qualification frameworks become efficient - scores pre-qualify before human effort
- Lead lifecycle management becomes automated - scores trigger stage transitions
Start with a simple two-dimensional model: fit and engagement. Get that working, get sales bought in, and iterate from there. Perfect is the enemy of good enough. A basic scoring system used consistently beats a sophisticated system that nobody trusts.
The goal isn't to replace human judgment. It's to focus that judgment on the leads most likely to generate revenue. That's the game changer.
Frequently Asked Questions about Lead Scoring Systems
What is lead scoring and why does it matter for B2B sales teams?
Lead scoring is a method of assigning numerical values to prospects based on how well they match your ideal customer profile and how actively they're engaging with your company. It matters because sales teams that work from scored lead lists consistently outperform those flying blind - MarketingSherpa research across 1,745 marketers found a 77% increase in lead generation ROI for companies using scoring versus those that don't. Without a scoring system, reps spend time equally across all leads regardless of conversion likelihood.
How many historical conversions do you need before building a predictive lead scoring model?
Most practitioners recommend a minimum of 500 closed deals before attempting a machine-learning-based predictive model, with 1,000+ conversions being the more reliable threshold. Below that, the algorithm doesn't have enough signal to identify meaningful patterns, and the model will overfit to noise. Companies under that threshold should start with rule-based descriptive scoring, which requires no historical data at all - just a clear understanding of your ideal customer profile.
What is score decay and why should scoring models include it?
Score decay is a mechanism that gradually reduces a lead's behavioral score over time as their engagement ages. It matters because a lead who visited your pricing page eight months ago and has since gone dark is not the same buying risk as one who visited it last week. Without decay, scores accumulate indefinitely and your "hot lead" list fills up with people who were once interested. A standard approach applies a 20% monthly decay to most engagement actions, with higher-intent actions like demo requests decaying more slowly.
What percentage of leads sent to sales are actually qualified?
Research consistently shows the number is low. According to Landbase's 2025 B2B data, only 27% of leads passed from marketing to sales are actually qualified and ready for a sales conversation. Yet 61% of B2B marketers send all leads to sales without any filtering. This mismatch is precisely why lead scoring exists - it creates a shared standard between marketing and sales for what "qualified" means before a lead ever reaches a rep's queue.
How does a two-dimensional scoring model differ from a single-score approach?
A single-score model collapses both fit (who someone is) and engagement (what they're doing) into one number, which destroys information. A lead can score 75 because they're a perfect-fit company doing nothing, or because they're an unqualified student who's obsessively browsing your blog. A two-dimensional model tracks fit and engagement separately, plotting them on a matrix. The high-fit, high-engagement quadrant identifies your hottest opportunities; high-fit, low-engagement means good nurture targets; low-fit, high-engagement usually means tire-kickers who shouldn't consume sales time at all.
When should a company use rule-based scoring versus AI/predictive scoring?
Rule-based scoring is the right starting point for companies with fewer than 500 closed deals, simple sales processes, or teams that need to understand and trust the model intuitively. Predictive or AI-based scoring becomes worth the investment when a company has 1,000+ historical conversions, a complex ICP with many interacting variables, and either in-house data science capability or budget for platforms like 6sense or MadKudu. Aberdeen Group found that companies with mature (typically predictive) lead scoring systems generate up to 18% more revenue than those without - but that maturity takes time and data to build.
How do you know if a lead scoring model is actually working?
The clearest signal is a conversion rate gradient: leads scoring 80+ should convert at a meaningfully higher rate than leads scoring 60-79, which should convert higher than 40-59. If there's no gradient - if high-scoring leads convert at the same rate as medium-scoring ones - the model isn't predicting anything useful. Track false positive rate (high scorers who don't convert) and false negative rate (low scorers who do) monthly. Combine those numbers with qualitative sales feedback. If reps consistently say scored leads are low-quality, that's a model problem, not a sales problem.
Learn More
Explore these related topics to build a comprehensive lead management system:
Lead Operations:
- Lead Sources Overview - Understand where your scored leads originate
- Multi-Channel Lead Capture - Capture behavioral data across touchpoints
- Lead Recycling Strategies - Re-engage leads who previously scored low
Pipeline & Conversion:
- Opportunity Qualification - Apply scoring insights to pipeline decisions
- Pipeline Velocity - Track how scores correlate with deal speed
- Probability Modeling - Advanced forecasting with score-based probability
SaaS-Specific Applications:
- Product-Led Sales - Combine product usage with traditional scoring
- Trial-to-Paid Conversion - Score trial users for sales intervention timing

Senior Operations & Growth Strategist
On this page
- What is lead scoring?
- Predictive vs descriptive scoring models
- The two-dimensional scoring framework
- Building your profile/fit score
- Sample fit scoring model
- Building your behavioral/engagement score
- Sample engagement scoring model
- Score decay and freshness
- Operationalizing scores for routing and prioritization
- Building your model: data analysis methodology
- Implementation approaches: rules, AI, or hybrid
- Model performance and optimization
- Common scoring mistakes to avoid
- Making scoring stick in your organization
- Where to go from here
- Learn More