Residential Solar Sales Growth Model: How Top Companies Scale Revenue
Turn this article into takeaways for your work.


Each assistant summarizes the article only for you and suggests best practices for your work.
Residential solar is one of the few home-improvement categories where a rep can close a $25,000 to $60,000 financed deal in a single in-home visit. That upside attracts a lot of companies, but most of them plateau. They hire bodies, hit a lead source ceiling, or watch install capacity crumble customer satisfaction. Growth stalls not because the market dried up but because the model was never designed to scale.
This article lays out the residential solar sales growth model that separates companies growing 30 to 100 percent year over year from those grinding at flat volume.
What Does the Residential Solar Growth Market Look Like?
Residential solar is a large and growing market, but knowing the macro numbers helps you benchmark your own team's performance and make the financial case to leadership.
The Core Architecture: Five Interdependent Layers
Key Facts
- US residential solar installations totaled 4,710 MW in 2024, according to the SEIA Solar Market Insight 2024 Year in Review. Over 5 million US homes now have solar.
- Solar and battery storage together made up 66% of all new US electricity generating capacity added in 2024, per the EIA.
- NREL's Q1-2024 benchmark puts the modeled market price for a residential rooftop system at $3.15 per watt (DC), per the DOE Solar PV System Cost Benchmarks.
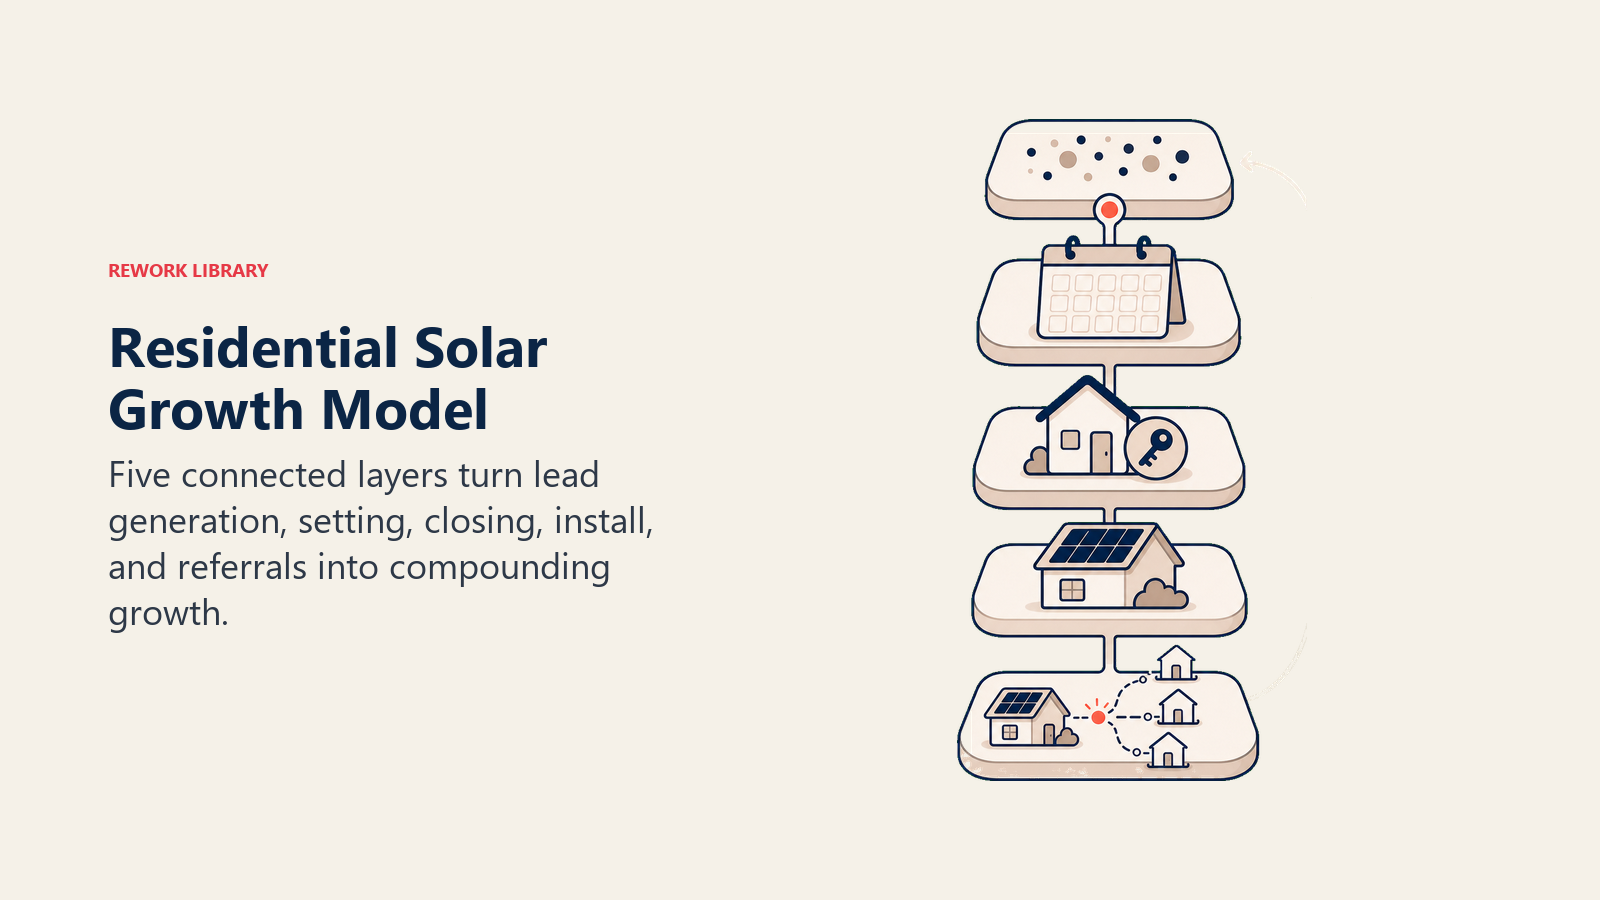
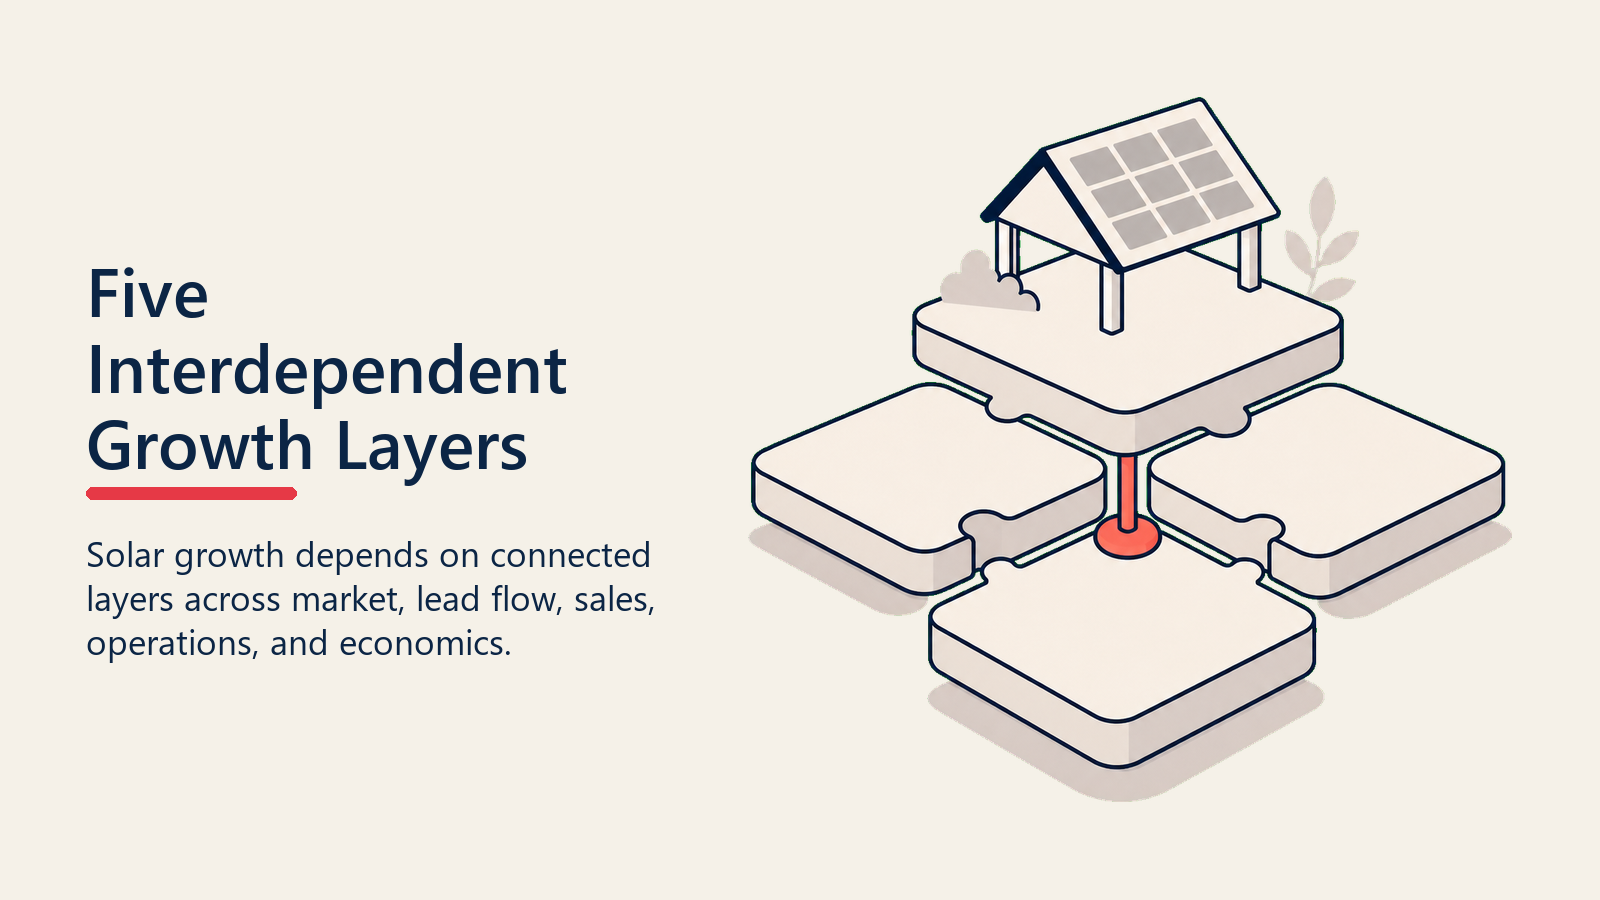
Residential solar growth does not happen in one department. It lives across five layers that have to work together:
- Lead generation (canvassing, referrals, digital, events)
- Appointment setting and qualification (setters, lead screening, confirmation sequences)
- In-home consultation and close (closers, proposal tools, financing presentation)
- Operations and install (survey, permitting, install, interconnect)
- Post-install retention and referral (onboarding, reviews, referral programs)
Most solar companies obsess over layer one (more leads!) or layer three (better closers!). The ones that scale fix all five, because a breakdown anywhere kills the value of everything upstream.
A company generating 500 leads a month with a 30 percent appointment-set rate, 60 percent show rate, and 25 percent close rate produces 22 sold deals. The same company fixing show rates to 75 percent and close rates to 35 percent produces 39 sold deals. That's a 77 percent gain without generating a single additional lead.
Conversion rate improvements compound faster than lead volume. That's the growth model in one number.
Layer 1: Lead Generation Mix
High-growth solar companies don't rely on one channel. They run a portfolio with intentional weighting across channels:
| Channel | Typical close rate | Cost per sold deal | Notes |
|---|---|---|---|
| Door-to-door canvassing | 18-28% | $800-$1,400 | High control, rep-dependent, scales with team size |
| Customer referrals | 35-50% | $200-$600 | Best unit economics; requires systematic ask |
| Inbound digital (paid/SEO) | 8-15% | $1,200-$2,500 | Scalable but competitive; quality varies widely |
| Community events and pop-ups | 12-20% | $700-$1,200 | Good for brand awareness + batch appointments |
| Installer partnerships | 20-35% | $400-$900 | Underused; roofers, HVAC, electricians |
Companies that scale past $20M in annual revenue almost always have referrals contributing 25 to 40 percent of their sold volume. The SEIA Solar Industry Research Data tracks the residential channel mix and confirms referrals as the highest-converting lead source. A systematic referral ask after every install, not a loose "let us know if you know someone," is a structural advantage. See referral generation after install for the exact playbook.
Door-to-door is the fastest way to ramp because it's fully controllable: more reps in more neighborhoods means more volume. But it's also the most management-intensive channel and burns out new reps quickly without strong coaching infrastructure. The question is what happens to all those leads once they're generated.
Layer 2: Appointment Setting and Qualification
Most solar companies underinvest in this layer. They treat appointment setting as a clerical function when it's the front end of their sales funnel, and every hour of closer time that goes to unqualified, no-show appointments is revenue left on the table.
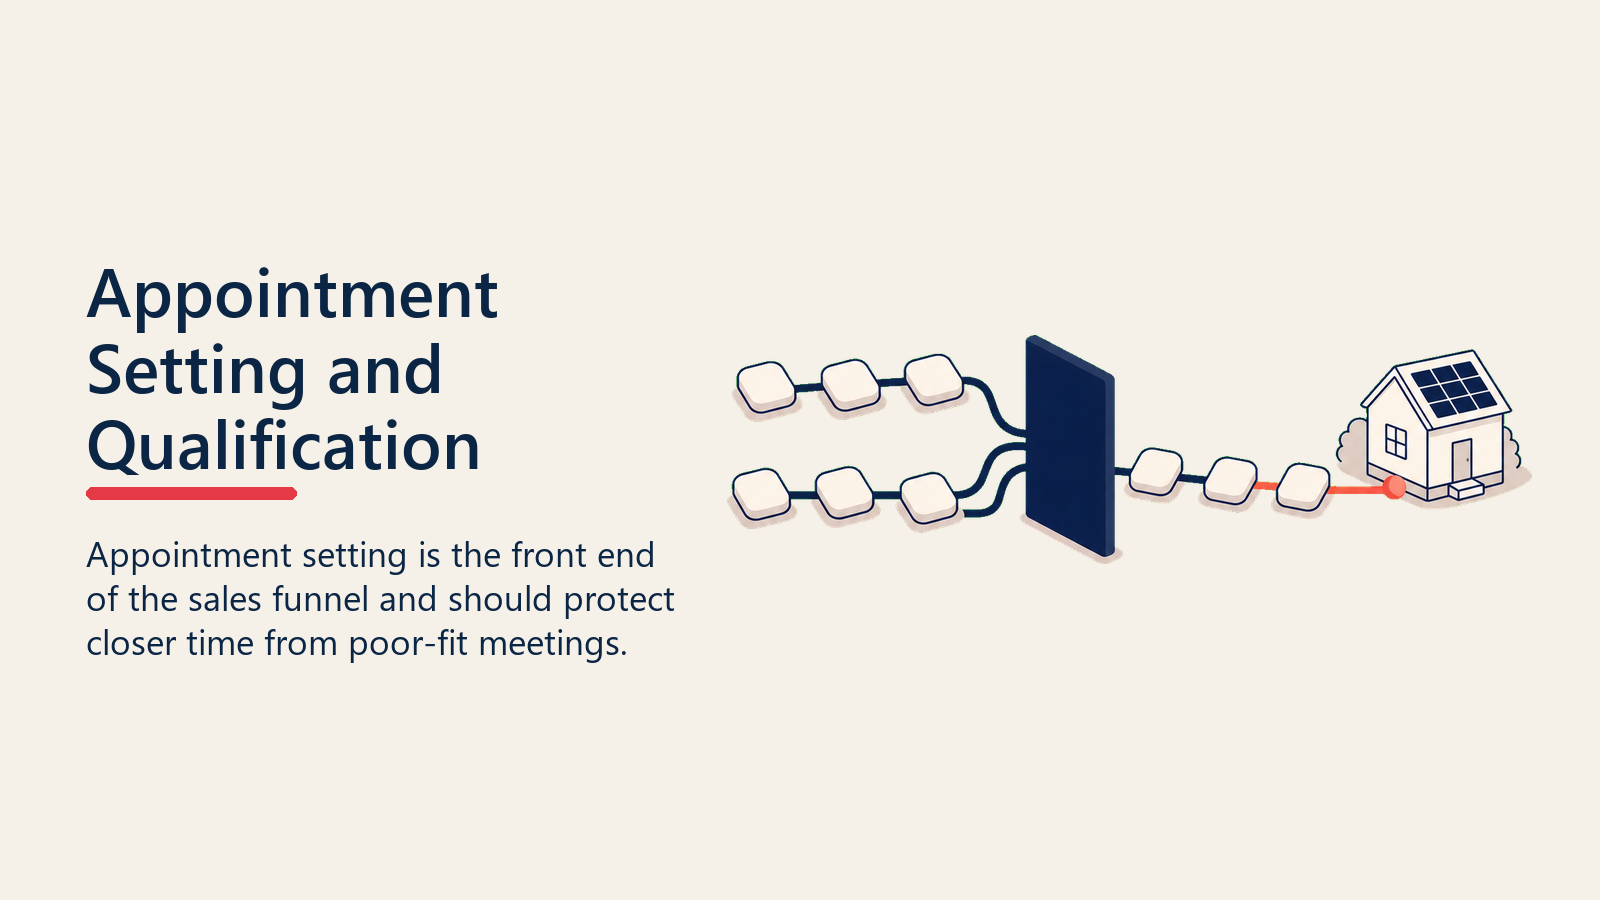
The setter role determines:
- Whether the homeowner actually owns the home
- Whether there's a qualifying electric bill (typically $150+ per month)
- Whether all decision-makers will be present at the appointment
- Whether the homeowner is creditworthy enough to qualify for financing
- Whether the appointment date and time are confirmed and recapped
Companies that nail pre-screening see show rates above 70 percent. Companies that treat appointment setting as "just scheduling" see show rates below 50 percent. On a team running 100 appointments a month, that gap is 20 to 25 additional consultations, or roughly 5 to 8 additional sold deals. Pairing setter pre-screening with a structured lead scoring system lets managers quickly prioritize which leads deserve closer time.
The setter's job at this layer is specific: screen for homeownership, qualifying electric bills, decision-maker presence at the appointment, and credit fit. The core rule is simple: a setter who books an appointment with a renter, a homeowner with a $70 electric bill, or a home where the decision-maker "might be there" is costing the company money, not making it.
Layer 3: The In-Home Consultation and Close
This is the highest-leverage layer in the model. A closer who can push close rates from 25 to 35 percent on the same lead volume generates 40 percent more revenue. No other lever moves the number that fast.
The in-home consultation has a predictable arc:
- Rapport and home assessment (10-15 min): understand energy use, motivations, roof and property details
- Education and needs analysis (15-20 min): explain how solar works for this specific home
- Custom proposal presentation (20-30 min): build or present the system design, savings projection, and financing options
- Close and handle objections (10-30 min): ask for the decision, address concerns, use urgency where real
- Sign or set next step (5-10 min)
One-call close and multi-visit approaches have sharply different economics. One-call close requires more skilled closers and stronger same-day incentive structures, but it cuts labor cost per deal and eliminates the attrition that happens between visits.
The in-home consultation is also where financing presentation matters most. A closer who can't clearly explain a $0-down PPA (Power Purchase Agreement), a 25-year loan, or a cash purchase with accurate savings projections in plain language loses winnable deals. See solar financing models and sales for the training framework.
Layer 4: Operations and Install Execution
Sales velocity means nothing if operations can't absorb the volume. The fastest-growing solar companies treat the install pipeline as a constraint to engineer around, not a problem to tolerate.
The key operations metrics that feed back into sales growth:
- Days from signed contract to site survey: target under 5 business days
- Days from signed contract to permit submission: target under 15 business days
- Days from permit approval to install: target under 10 business days
- Install-day first-time completion rate: target above 90 percent
Cancellation rates during the install wait period kill growth companies. A homeowner who signs today and waits six months for install due to permitting delays or capacity bottlenecks is a cancellation risk, a reputation risk, and a lost referral source. The companies that solve this are the ones building a referral engine worth anything.
Layer 5: Post-Install Retention and Referral Engine
The growth model's back end is the one most companies neglect the longest. But post-install customers are the highest-close-rate lead source in the business. The same retention principles that keep SaaS customers renewing apply here: early wins, proactive communication, and clear demonstration of value before frustration sets in.
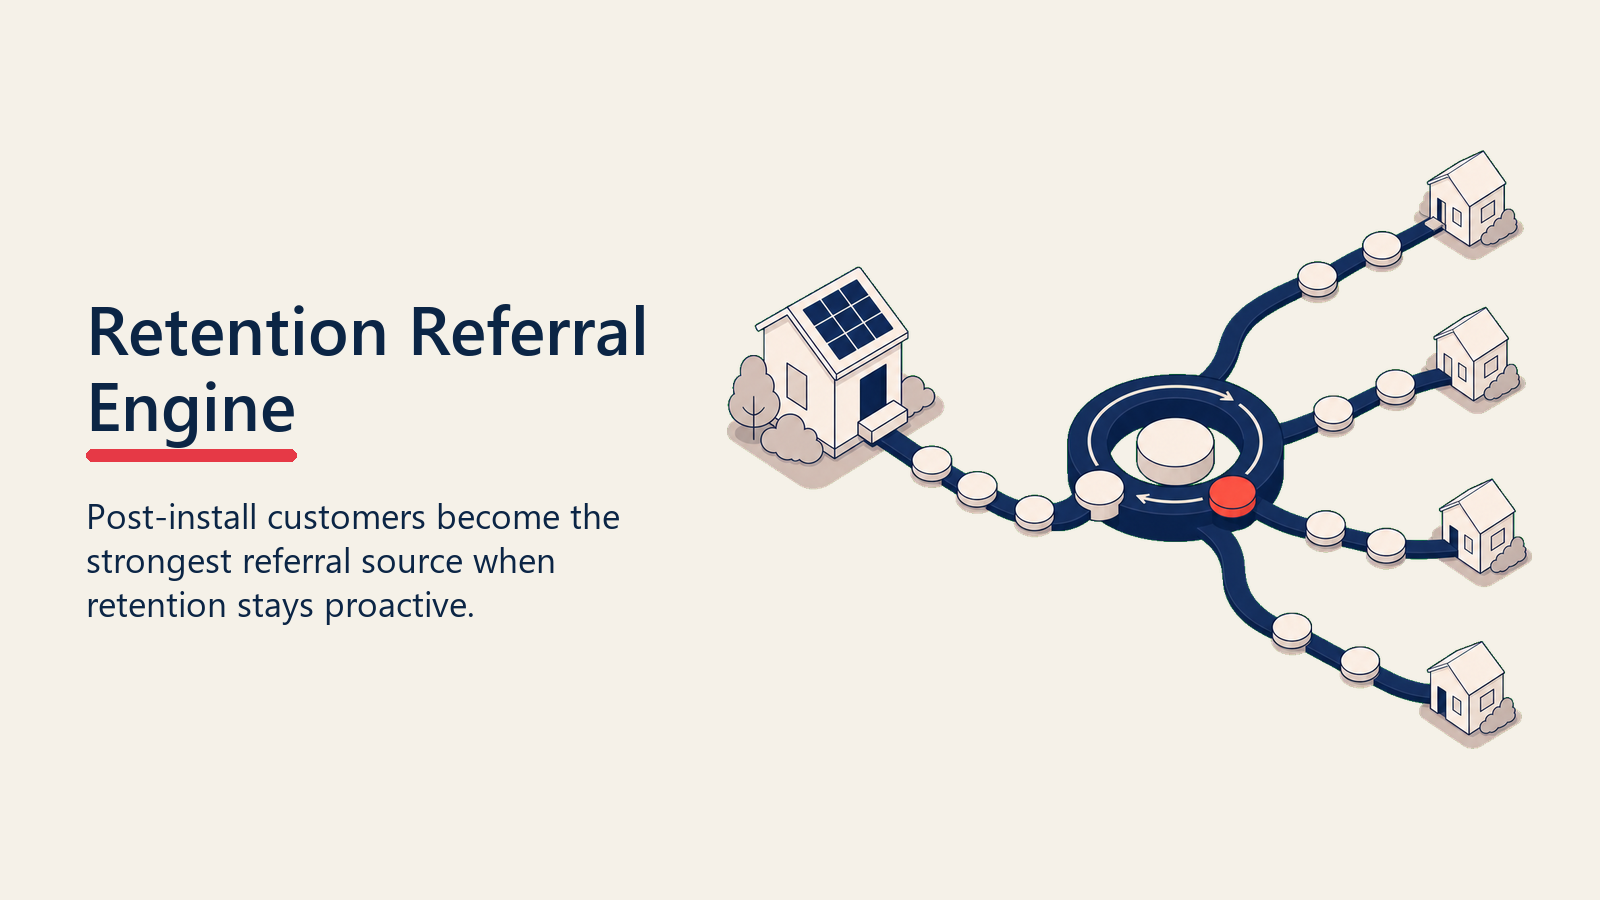
A homeowner who installed six months ago and loves the system closes at 35 to 50 percent when they refer a neighbor. A referral from a dissatisfied customer where the install was delayed eight months and the first utility bill was confusing closes at much lower rates and sometimes turns into a cancellation request or a negative review.
Building a referral engine requires:
- Structured post-install onboarding that makes customers confident they made the right decision
- A repeatable referral ask at 30, 60, and 90 days post-install (not a one-time email)
- A review generation process for Google, Yelp, and Energysage while satisfaction is highest
- A monitoring program that catches performance issues before they become complaints
The operational details for each step are covered in the Learn More section below.
What Are the Growth Constraints Most Companies Hit First?
The Five-Layer Solar Constraint Model: a diagnostic framework that identifies which of five structural layers is throttling residential solar growth. The layers in order of typical failure sequence are: (1) Lead Source Concentration, (2) Closer Quality Ceiling, (3) Operations Capacity, (4) Rep Attrition, and (5) Referral Engine Absence. Fixing the correct constraint produces compound improvement; fixing the wrong one wastes capital on a lever that is not the binding limit.
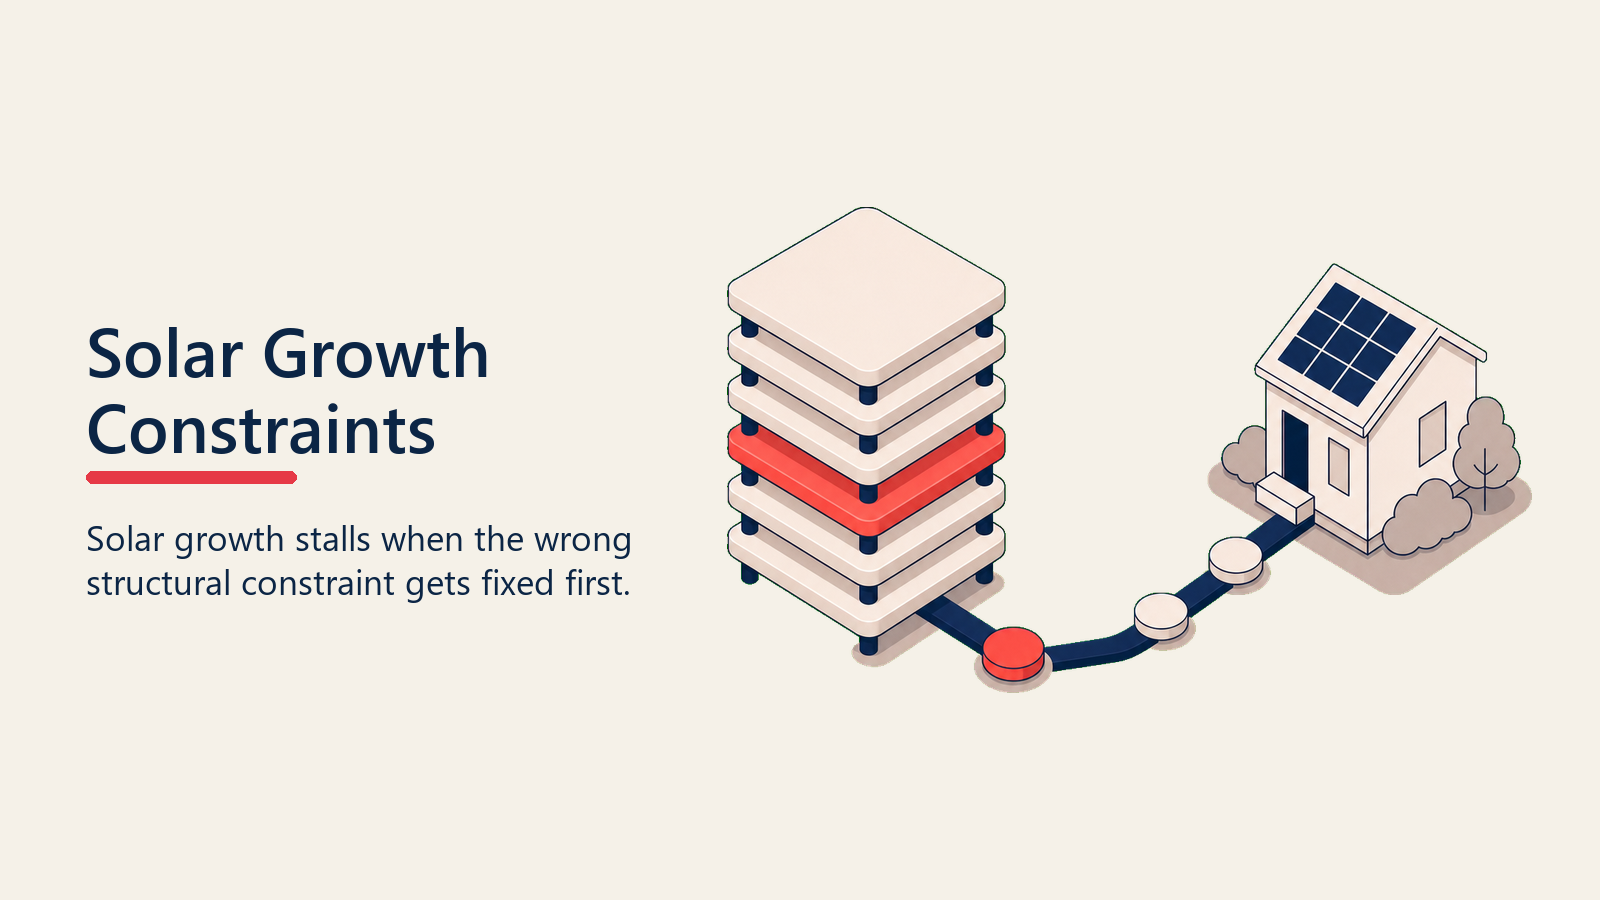
In order, here are the constraints that stall residential solar growth:
Constraint 1: Lead Source Concentration
Companies that depend on a single channel (usually canvassing or digital leads) hit a ceiling fast. Canvassing is geographically bounded and rep-capacity bounded. Digital leads get more expensive and competitive as you spend more. The fix is channel diversification, with referrals built as the second engine before the primary channel maxes out.
Constraint 2: Closer Quality Ceiling
Scaling closer headcount without investing in coaching infrastructure is a common mistake. A team of 10 closers averaging 22 percent close rates produces the same output as 6 closers averaging 37 percent. But it costs more and creates more management complexity. The companies that grow fastest invest in coaching and ride-alongs before they expand headcount.
Constraint 3: Operations Capacity
Sales teams that grow faster than install capacity create backlogs that drive up cancellation rates, damage reputation, and poison the referral engine. Operations alignment has to scale with sales targets, not lag behind them.
Constraint 4: Rep Attrition
High-volume solar sales teams run 40 to 80 percent annual rep attrition in the first year. Companies that invest in rep training programs, structured ramps, and realistic earning expectations in the first 90 days retain reps at meaningfully higher rates. The Learn More section below points to the first-90-days playbook.
Growth Benchmarks by Stage
Use these to calibrate where your company sits:
| Stage | Annual Revenue | Monthly Sold Deals | Key Focus |
|---|---|---|---|
| Early | $1M-$5M | 10-40 | Close rate, one-call close discipline |
| Growth | $5M-$20M | 40-160 | Lead diversification, setter quality, ops sync |
| Scale | $20M-$75M | 160-600 | CRM infrastructure, referral engine, manager layer |
| Enterprise | $75M+ | 600+ | Regional expansion, market diversification, CSAT |
The transition from Growth to Scale is where most companies struggle. It requires moving from founder-led sales to systematic management infrastructure, from informal coaching to structured training programs, and from ad-hoc CRM use to solar CRM and proposal tools that give managers visibility into pipeline and forecasting.
Quotable Nuggets
"Conversion rate improvements compound faster than lead volume. A team fixing show rates from 60% to 75% and close rates from 25% to 35% produces 77% more deals without adding a single lead."
"Companies that scale past $20M almost always have referrals contributing 25 to 40 percent of sold volume. The referral engine is not a nice-to-have; it is the back end of the growth model."
Building the Model as a System
The companies that grow consistently do one thing differently: they treat residential solar sales as a system, not a talent game. They ask "what does our model produce at current conversion rates?" before they ask "how do we hire better closers?"
The model check is straightforward:
- What's our lead volume by channel, and what does each channel cost per appointment set?
- What's our appointment show rate, and what's driving no-shows?
- What's our close rate by closer, by lead source, and by financing type?
- What's our cancellation rate between sign and install, and when does attrition peak?
- What's our referral rate, and what triggers it?
Each of those numbers points to a specific lever. Fix the lowest-performing one first. That's the growth model.
Building a residential solar company that compounds is less about finding magic lead sources and more about relentlessly improving each layer of the model. The market is big enough. The question is whether your system can capture it.
Learn More
- Solar sales KPIs and metrics
- Solar unit economics and commissions
- Solar appointment setting playbook
- Solar lead qualification and prescreening
- Post-install customer onboarding
- Online reviews and reputation management
- Coaching and ride-alongs in solar sales
- Sales and install operations alignment
- Recruiting and ramping solar reps
- Solar CRM and proposal tools
Frequently Asked Questions about Residential Solar Sales Growth Model
What is the residential solar sales growth model?
It is a five-layer framework spanning lead generation, appointment setting, in-home consultation, install operations, and post-install referral. Growth stalls when any one layer underperforms, because a leak in layer two or four destroys the value of every dollar spent on layer one.
What close rate should a residential solar company target?
Industry benchmarks range from 22 to 38 percent of completed consultations, with self-gen canvassing leads and referrals typically landing toward the high end (25 to 45 percent) and purchased digital leads toward the low end (15 to 25 percent). The more important number is close rate by lead source, not the blended average.
How do high-growth solar companies build their lead mix?
The most consistent growers run a portfolio of channels rather than depending on one. Door-to-door canvassing provides controllable volume. Referrals provide the lowest cost per sold deal. Digital inbound provides scale. The referral engine is built deliberately, not treated as a byproduct of good service.
When does a solar company need to add a management layer?
The Growth-to-Scale transition (roughly $5M to $20M revenue) is when founder-led sales breaks down. At that stage, companies need structured coaching infrastructure, CRM-driven pipeline visibility, and a dedicated setter operation rather than informal processes managed by one or two strong closers.
What is the biggest mistake solar companies make when trying to scale?
Hiring more closers before fixing conversion rates. A team of 10 closers at 22 percent close rate produces the same volume as 6 closers at 37 percent, but at significantly higher cost and management complexity. Fix the leaks before adding headcount.
How does install operations capacity affect sales growth?
Sales teams that outgrow install capacity create backlogs that raise cancellation rates, damage reviews, and cut off referral generation from happy customers. Operations alignment has to scale with sales targets, not lag behind them.
What are realistic rep attrition rates in residential solar?
High-volume solar sales teams see first-year attrition of 40 to 80 percent as a common operator estimate, reflecting the commission-only or commission-heavy structures typical in the industry. Companies with structured 90-day ramp programs and realistic earning expectations retain reps at meaningfully higher rates, though no published peer-reviewed benchmark exists for solar specifically.

Senior Implementation Consultant
On this page
- What Does the Residential Solar Growth Market Look Like?
- The Core Architecture: Five Interdependent Layers
- Layer 1: Lead Generation Mix
- Layer 2: Appointment Setting and Qualification
- Layer 3: The In-Home Consultation and Close
- Layer 4: Operations and Install Execution
- Layer 5: Post-Install Retention and Referral Engine
- What Are the Growth Constraints Most Companies Hit First?
- Constraint 1: Lead Source Concentration
- Constraint 2: Closer Quality Ceiling
- Constraint 3: Operations Capacity
- Constraint 4: Rep Attrition
- Growth Benchmarks by Stage
- Quotable Nuggets
- Building the Model as a System
- Learn More