Solar Unit Economics and Commissions: What Each Deal Actually Costs to Close
Turn this article into takeaways for your work.


Each assistant summarizes the article only for you and suggests best practices for your work.
Residential solar can be a high-revenue business or a high-volume trap, depending on your unit economics. A company closing 40 deals a month at $2,000 gross per deal isn't a growth company. One closing 25 deals at $5,000 gross per deal probably is, depending on fixed costs.
Most sales managers and owners in residential solar know their close rate and their revenue. Far fewer know their cost per sold deal, their gross margin per contract, or whether their commission structure is sustainable at scale. This article breaks down all of it.
What Does a Residential Solar Deal Actually Generate?
Residential solar deals are priced per watt, with the final system price determined by system size (kW), equipment tier, and financing type. Here's the typical range:
| System size | Typical price range (cash/loan) | Average in California/Texas/AZ |
|---|---|---|
| 5 kW | $15,000-$25,000 | ~$20,000 |
| 7 kW | $20,000-$32,000 | ~$27,000 |
| 10 kW | $27,000-$40,000 | ~$33,000 |
| 12+ kW (with battery) | $38,000-$65,000+ | ~$50,000+ |
Price per watt in residential solar typically runs $2.80 to $4.20 installed, with significant variation by market, equipment, and company. The DOE's Solar PV System Cost Benchmarks put the 2024 Q1 modeled market price for a residential system at $3.15/Wdc, a useful reference point for evaluating whether your company's all-in install cost is competitive. Companies running higher-end equipment on a 25-year loan deal with dealer fees; companies running direct installs on cash or shorter-term loans have different structures.
The federal residential Investment Tax Credit (Section 25D) is not a company revenue item but it materially affects close rates, financing terms, and customer savings projections. Note: the Section 25D residential credit (30%) ended for owner-purchased systems placed in service after December 31, 2025, under the One Big Beautiful Bill Act (Public Law 119-21, signed July 4, 2025). Third-party-owned systems (PPAs, or Power Purchase Agreements, and leases) may still access a commercial credit path. See the IRS FAQ on OBBB energy credit changes for current guidance. Closers who understand the current credit landscape close more deals than those still citing the old 30% through 2032 framing.
Key Facts
- NREL's Q1-2024 benchmark puts the modeled market price for a residential rooftop system at $3.15 per watt (DC). Source: DOE Solar PV System Cost Benchmarks.
- The DSIRE database (Database of State Incentives for Renewables and Efficiency) is the authoritative source for current state rebates, net metering policies, and local incentives that affect homeowner out-of-pocket cost and your deal economics.
What Is the Dealer Fee and Why Does It Define Your Margin?
For solar companies that sell financed deals through third-party lenders (Sunlight Financial, GoodLeap, Mosaic, Dividend, etc.), the dealer fee is the most important cost line to understand.
Dealer fees are the percentage of the loan amount that the lender charges the solar company for originating and guaranteeing a financed deal. They typically run between 15 and 30 percent of the contract price, depending on:
- Loan term (20-year loans carry higher fees than 10-year)
- Interest rate to the customer (lower rates cost the dealer more)
- Lender relationship and volume tier
- Whether the deal includes a battery storage system
A $30,000 system financed on a 25-year, 4.99% loan with an 18% dealer fee means the company nets $30,000 minus $5,400 in dealer fees, or $24,600 before any other costs. At a 25% dealer fee, the net drops to $22,500.
This is why some solar companies appear to be high-revenue businesses while actually running thin margins: every $30,000 in revenue may have $7,500 in dealer fees sitting on top of equipment, install, and sales costs.
| Deal size | Dealer fee % | Dealer fee $ | Revenue net of dealer fee |
|---|---|---|---|
| $25,000 | 18% | $4,500 | $20,500 |
| $30,000 | 20% | $6,000 | $24,000 |
| $35,000 | 22% | $7,700 | $27,300 |
| $40,000 | 25% | $10,000 | $30,000 |
| $45,000 (with battery) | 28% | $12,600 | $32,400 |
Companies that push customers toward longer loan terms with lower monthly payments often don't fully account for the higher dealer fees those terms carry. The deal looks better to the customer and worse to the company's margin.
Cost of Goods Sold: Equipment and Install
After dealer fees, the next big cost is the system itself: equipment plus install labor.
Typical installed cost breakdown per deal (not including dealer fees):
| Cost component | Per kW | On a 7 kW system |
|---|---|---|
| Panels | $250-$400 | $1,750-$2,800 |
| Inverter(s) | $150-$300 | $1,050-$2,100 |
| Racking and electrical BOS | $100-$200 | $700-$1,400 |
| Install labor | $300-$600 | $2,100-$4,200 |
| Permitting and interconnection | $400-$800 fixed | $400-$800 |
| Site survey and design | $150-$300 fixed | $150-$300 |
| Total installed COGS | ~$6,150-$11,600 |
At the midpoint of this range, a 7 kW system costs roughly $8,500 to $9,500 to build and install before sales and overhead costs.
On a $28,000 deal with an 18% dealer fee ($5,040), the company nets $22,960 in revenue. Against $9,000 in COGS, gross profit is $13,960, or roughly 50 percent. That sounds healthy. It isn't, until you add sales costs.
The Sales Cost Layer
Sales costs in residential solar are high relative to most industries because of the in-home, consultative nature of the model. Every sold deal carries:
- Setter compensation (if setter/closer split)
- Closer commission
- Lead cost or canvasser compensation
- Marketing and lead generation overhead
- CRM, proposal tools, and tech stack allocation
Here's what total sales cost per sold deal typically looks like:
| Sales cost component | Typical range |
|---|---|
| Closer commission | $1,800-$4,500 per deal |
| Setter commission or lead cost | $200-$800 per deal |
| Canvassing labor (self-gen leads) | $300-$900 per deal |
| Digital lead cost (if purchased) | $400-$1,200 per lead set (varies by close rate) |
| Tech stack per deal | $50-$150 |
| Sales management overhead | $200-$500 |
| Total sales cost per deal | $2,500-$7,500 |
The range is wide because commission structures vary enormously. A closer on a 10% commission plan closing a $35,000 deal earns $3,500. A closer on a $2,000 flat per deal earns $2,000 regardless of contract size.
Which structure is better depends on deal mix, average contract size, and what behavior you want to reinforce. See solar commission and comp design for the trade-offs.
The Full Unit Economics Waterfall
Here's what a complete unit economics waterfall looks like on a typical residential solar deal:
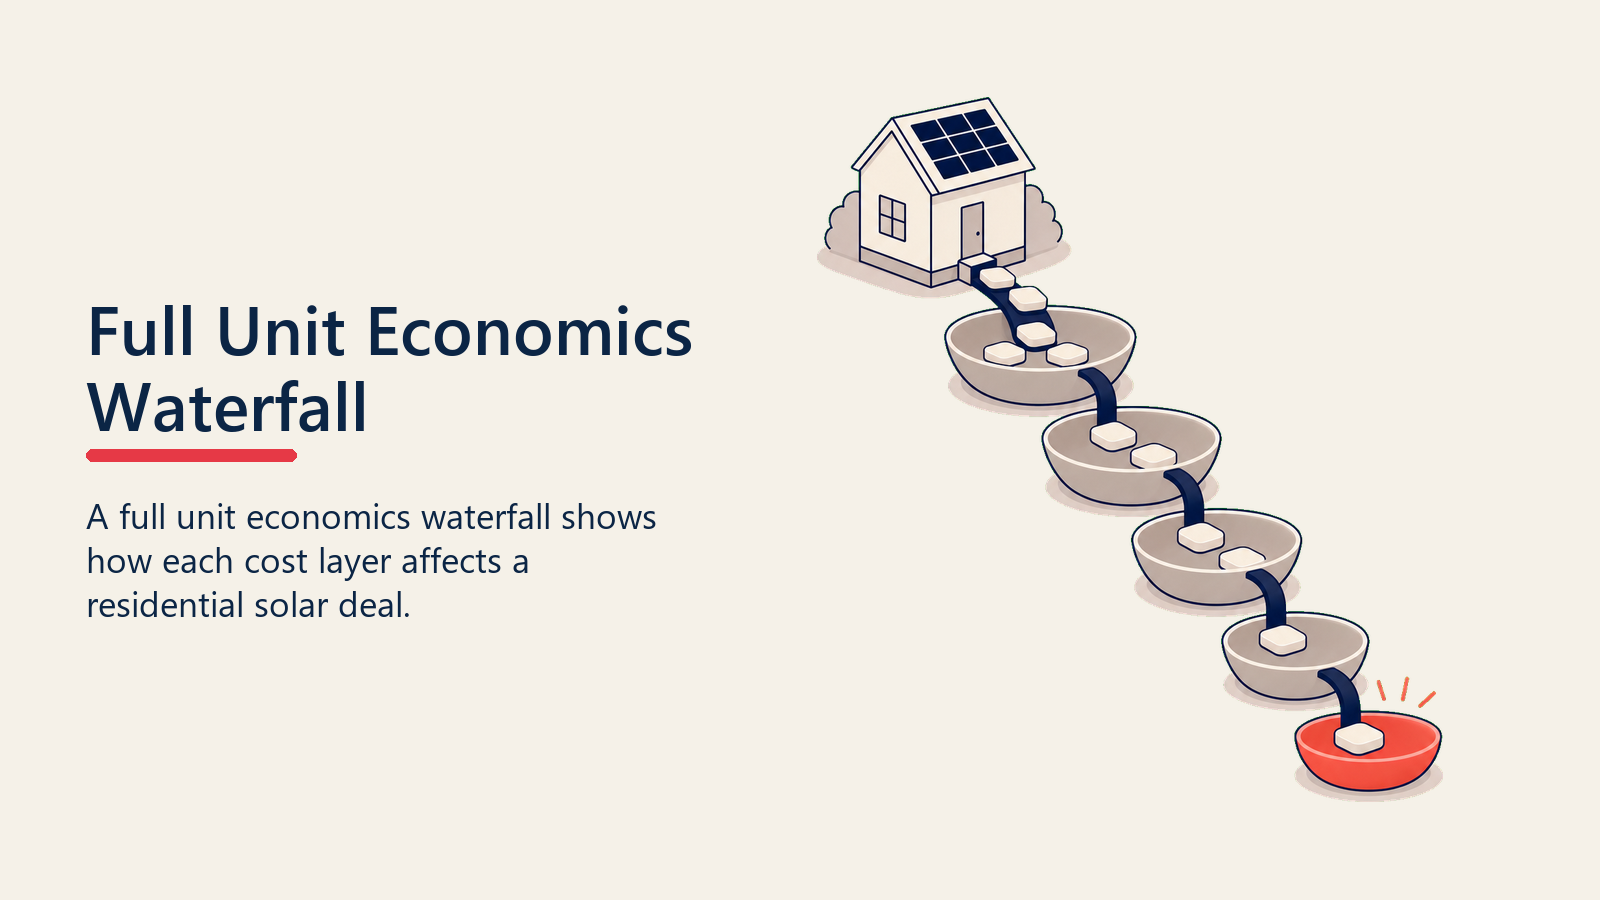
Example: $32,000 financed deal, 7 kW system, 20% dealer fee, competitive install market
| Line item | Amount |
|---|---|
| Contract price | $32,000 |
| Dealer fee (20%) | -$6,400 |
| Revenue net of dealer fee | $25,600 |
| Equipment cost | -$4,200 |
| Install labor | -$3,500 |
| Permitting and survey | -$600 |
| Gross profit | $17,300 (54%) |
| Closer commission (12%) | -$3,840 |
| Lead/setter cost | -$600 |
| Tech and overhead allocation | -$350 |
| Contribution margin per deal | $12,510 (39%) |
| Sales management and G&A (estimated) | -$2,500 |
| Net per deal (pre-tax) | ~$10,010 |
That's a ~31 percent net margin per deal, which is healthy. But this assumes a $32,000 average contract, a 20 percent dealer fee, and well-controlled install costs. At a $24,000 average contract with a 25 percent dealer fee and higher install labor, the economics compress significantly.
The most profitable solar companies push average contract value up (through battery add-ons, roof bundling, or premium equipment) while controlling dealer fees through lender relationships and shorter loan term education.
Commission Structures: The Three Models
Residential solar companies typically use one of three commission structures for closers:
Model 1: Percentage of Contract (Revenue-Based)
The closer earns a percentage of the total contract price.
- Common range: 8 to 15 percent
- On a $30,000 deal at 10%: $3,000
- Pros: scales naturally with deal size; incentivizes larger systems and battery add-ons
- Cons: high earners on large deals can cost the company if margins are thin; no margin visibility for the rep
Model 2: Flat Per Deal (Deal-Based)
The closer earns a fixed dollar amount per signed contract, regardless of deal size.
- Common range: $1,500 to $3,500 per deal
- Pros: predictable cost per deal; easy to model at scale
- Cons: no incentive to upsell or increase system size; reps may prefer smaller, faster-closing deals
Model 3: Tiered or EPC-Based
The closer earns commission based on the effective price per watt (EPC) or on a margin-linked metric. Higher EPC = higher commission tier.
- Example: $2,500 per deal at EPC below $3.20/W, $3,200 at EPC $3.20-$3.80/W, $4,000 at EPC above $3.80/W
- Pros: aligns rep incentives with company profitability; rewards pricing discipline
- Cons: more complex to explain and track; requires good CRM visibility
The tiered EPC model is increasingly common at mid-to-large solar companies because it solves the core misalignment in percentage-of-contract plans: a rep who discounts a deal from $35,000 to $30,000 to close it earns less but costs the company far more than $500 in margin. Reps who understand value selling rarely need to discount, because they've already connected the financial outcome to what the homeowner actually cares about.
A detailed breakdown of comp design across all roles is in the Learn More section below.
The Setter Economics
If your team uses a setter/closer split model, the setter is typically paid:
- A flat per-confirmed-appointment fee ($25-$75)
- Plus a per-sold-deal bonus ($150-$400)
- Or a smaller percentage of the deal (1.5-3%)
Setter pay is lower than closer pay, but volume is higher. A setter running 15 appointments a week and closing at a 30 percent team average might be responsible for 4.5 sold deals a week, earning $450 to $1,800 in deal bonuses plus their per-appointment rate.
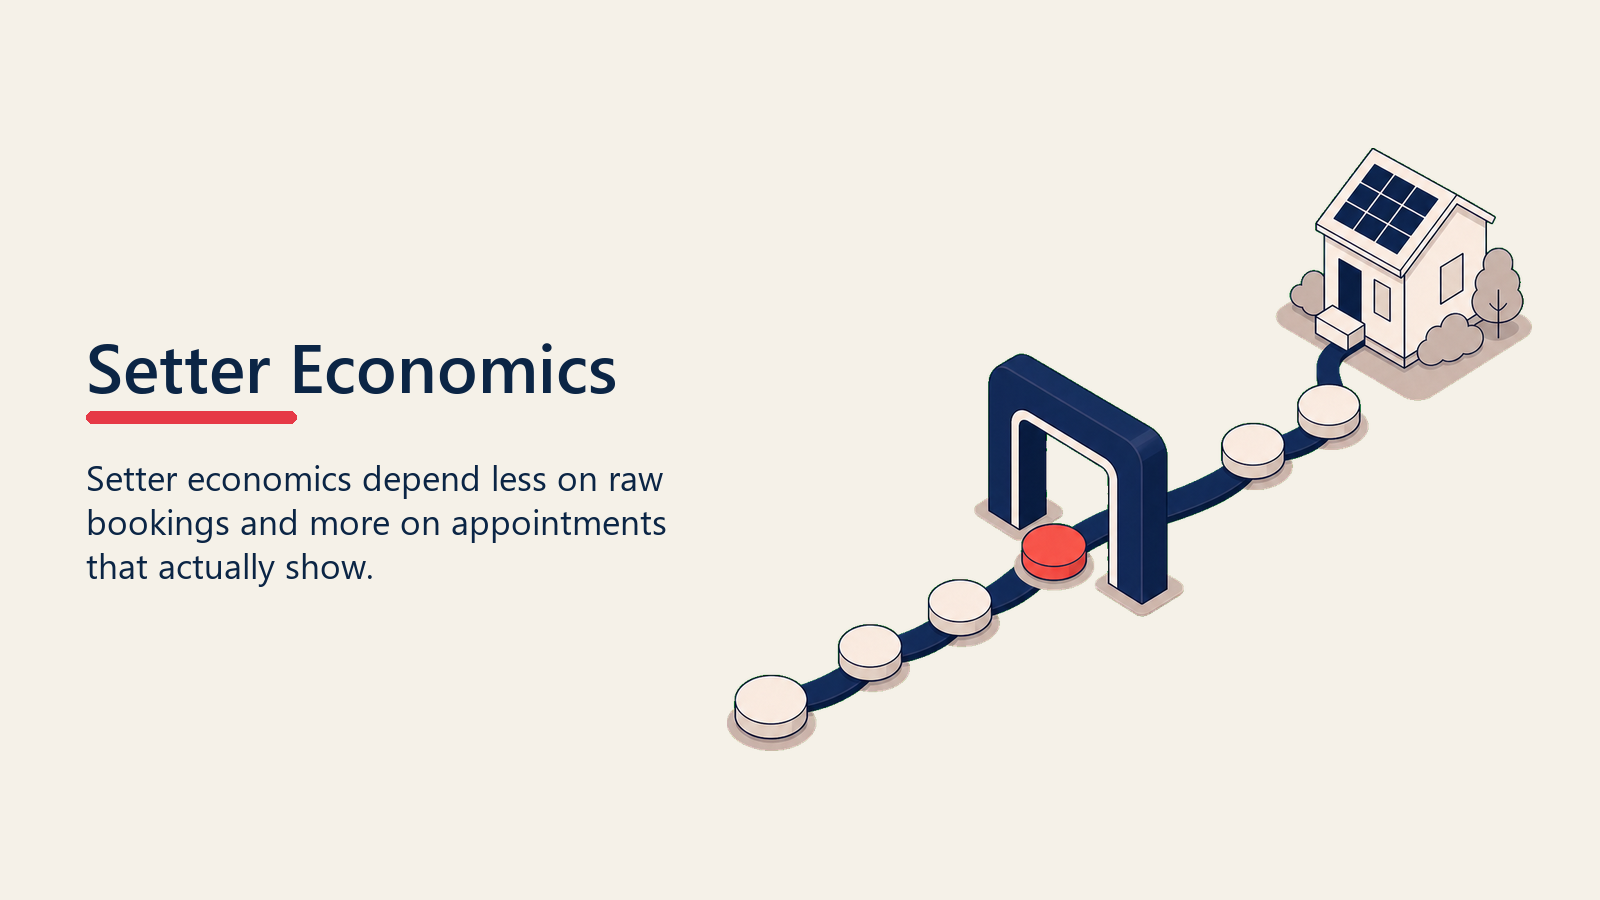
The economics of the setter role depend heavily on appointment quality. A setter who books 15 appointments with 40 percent show rates produces 6 consultations. One who books 12 appointments with 75 percent show rates produces 9 consultations. The second setter is generating 50 percent more revenue-generating visits from fewer bookings.
This is why setter-to-closer handoff quality and pre-screening discipline matter so much to unit economics. Bad setter behavior doesn't just reduce close rates; it inflates cost per deal. A proper lead qualification framework at the setter stage keeps bad-fit appointments out of the funnel before they waste closer time.
Cost Per Sold Deal: The Metric That Ties It Together
Cost per sold deal (sometimes called cost per acquisition or CPA) is the clearest metric for evaluating sales efficiency. It's the sum of all variable sales costs divided by the number of sold deals.
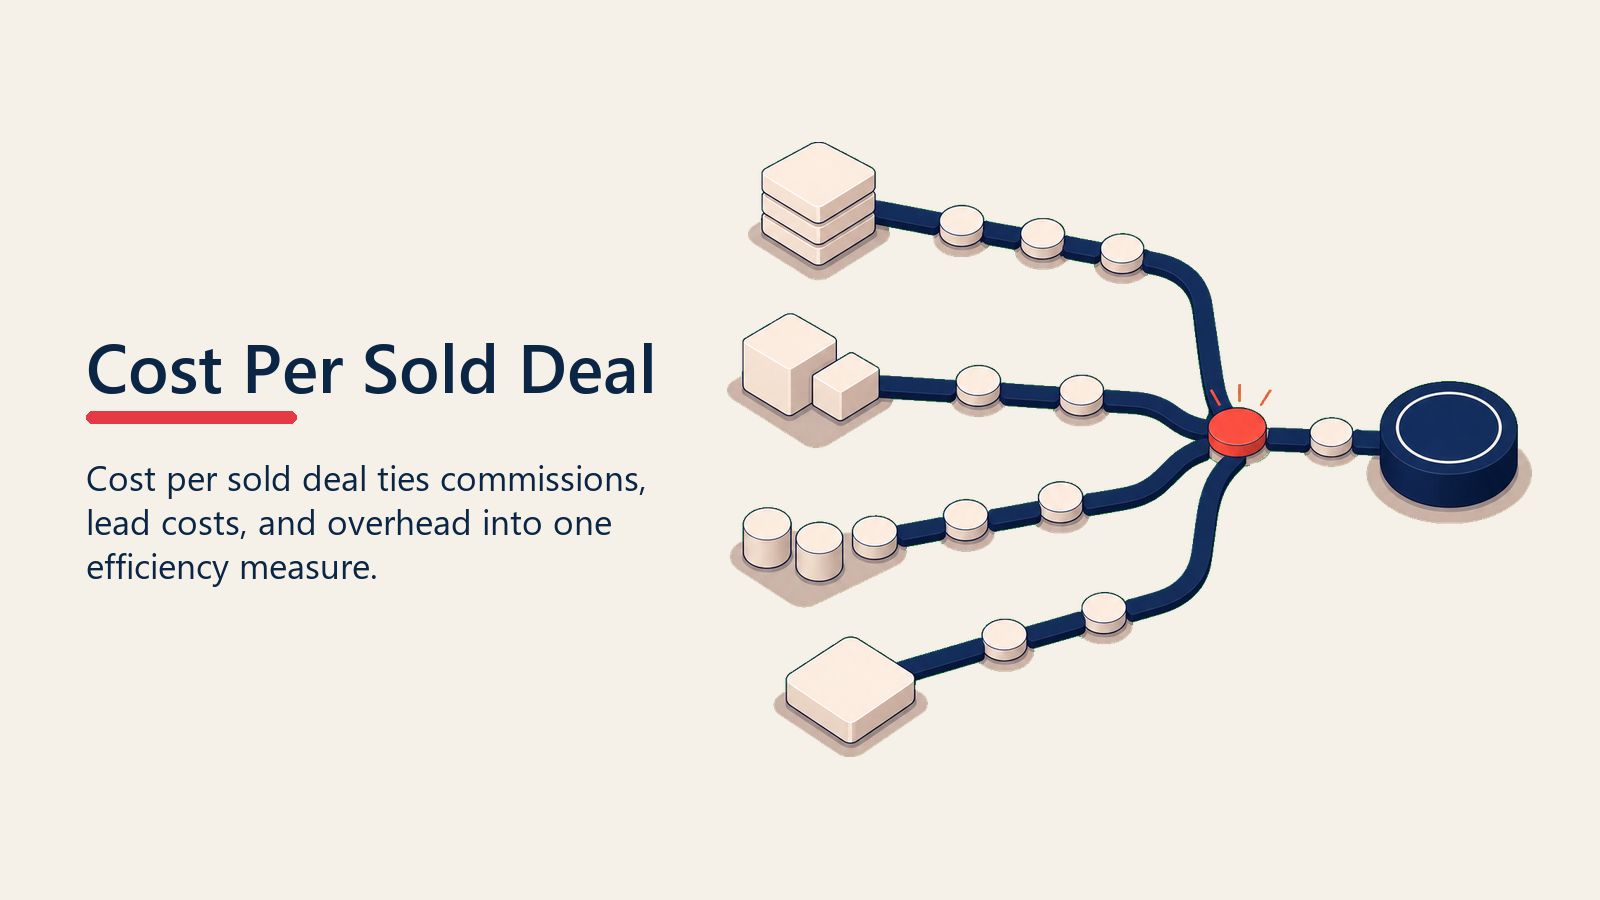
If your team spends $120,000 in a month on commissions, lead costs, and sales overhead and closes 30 deals, your cost per sold deal is $4,000. If your gross profit per deal averages $17,000, you have $13,000 in contribution margin per deal to cover fixed costs and generate profit.
Tracking cost per sold deal by channel reveals something most teams don't see:
| Channel | Cost per sold deal (typical) |
|---|---|
| D2D / canvassing (self-gen) | $1,800-$3,200 |
| Referral from existing customer | $400-$900 |
| Inbound digital (paid search) | $2,500-$5,000 |
| Community events | $1,200-$2,800 |
| Purchased aged leads | $1,500-$3,500 |
Self-gen canvassing and referrals typically win on unit economics. Digital leads and purchased leads typically lose unless close rates are unusually high. This shapes how smart companies allocate their sales investment as they scale. State-level incentives also shift the unit economics calculation significantly: the DSIRE database (Database of State Incentives for Renewables and Efficiency) is the authoritative source for current rebates, tax credits, and net metering policies that affect what homeowners pay out of pocket and how compellingly your closers can present the financial case.
Understanding your unit economics doesn't mean squeezing every dollar. It means knowing exactly which deals, which channels, and which reps are actually building the business, and doubling down there.
Learn More
- Solar sales KPIs and metrics
- Solar financing models and sales
- In-home sales funnel
- Solar commission and comp design
Quotable Nuggets
"Every $30,000 in residential solar revenue can carry $6,000 to $10,000 in dealer fees before you account for a single panel or hour of labor. Revenue does not equal margin in this business."
"At the midpoint cost ranges, a 7 kW system costs roughly $8,500 to $9,500 to build and install before sales and overhead. Gross profit of 50% sounds healthy until you add the sales cost layer."
"Referral leads from your installed base typically cost $400 to $900 per sold deal versus $2,500 to $5,000 for purchased digital leads. That gap is the strongest financial argument for building a post-install referral program."
The Unit Economics Waterfall Framework
The Unit Economics Waterfall: a five-level margin model for residential solar that traces a deal from contract price down to net per deal. The five levels are: (1) Contract Price, (2) Revenue Net of Dealer Fee, (3) Gross Profit (after equipment and install COGS), (4) Contribution Margin (after sales costs), and (5) Net Per Deal (after G&A allocation). Running this waterfall per deal, per channel, and per rep reveals which parts of the business are actually profitable and which are consuming margin.

Senior Implementation Consultant
On this page
- What Does a Residential Solar Deal Actually Generate?
- What Is the Dealer Fee and Why Does It Define Your Margin?
- Cost of Goods Sold: Equipment and Install
- The Sales Cost Layer
- The Full Unit Economics Waterfall
- Commission Structures: The Three Models
- Model 1: Percentage of Contract (Revenue-Based)
- Model 2: Flat Per Deal (Deal-Based)
- Model 3: Tiered or EPC-Based
- The Setter Economics
- Cost Per Sold Deal: The Metric That Ties It Together
- Learn More
- Quotable Nuggets
- The Unit Economics Waterfall Framework