Marketing and Sales Lead-Quality Alignment for Solar Companies
Turn this article into takeaways for your work.


Each assistant summarizes the article only for you and suggests best practices for your work.
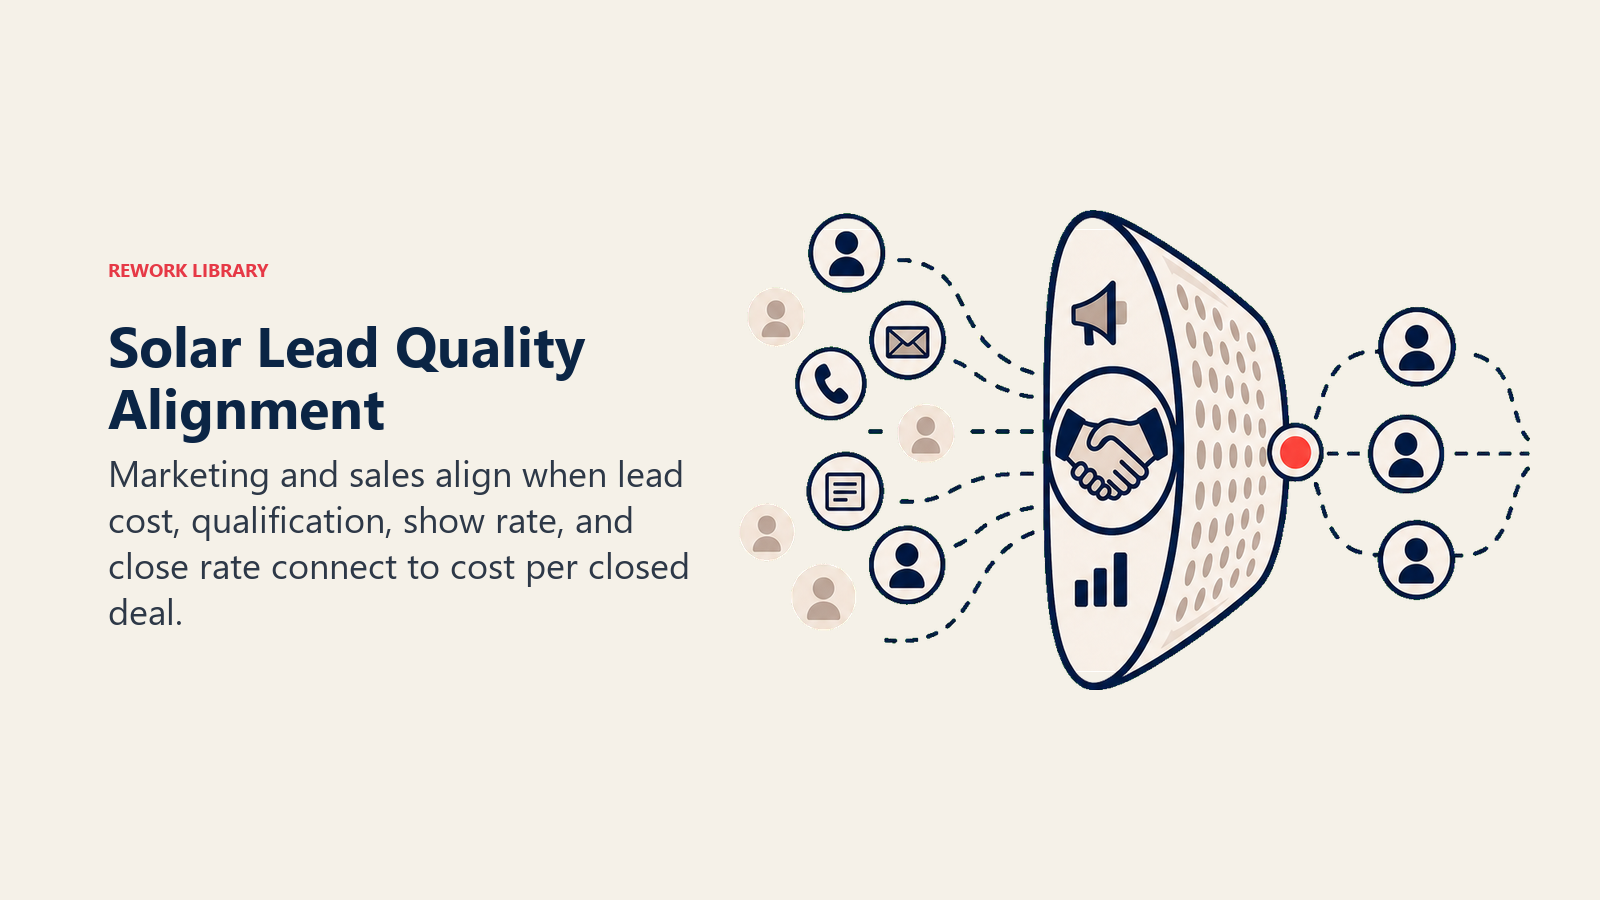
The most common argument in a solar company's Monday morning meeting sounds like this. Marketing says they hit their lead volume target. Sales says the leads were garbage. Marketing points to the cost-per-lead number, which looks good. Sales points to the close rate, which is down. Marketing says sales should be working harder. Sales says marketing should be generating better prospects.
Nobody is wrong about their own metric. Both teams are wrong about what's actually happening.
This tension, between lead volume and lead quality, is the central alignment problem in residential solar marketing. And it costs money in ways that are easy to miss because the losses are diffuse: appointment slots burned on unqualified homeowners, closer time spent in consultations that had no real chance of closing, setters chasing no-shows who never intended to buy.
Fixing it isn't about making sales or marketing win the argument. It's about defining lead quality together and building the feedback loops so both teams are pointing at the same outcome. The cost of not doing that is steep: Harvard Business Review puts the total cost of sales-marketing misalignment at over $1 trillion annually in lost productivity and wasted spend, a figure corroborated by Forrester's research on B2B pipeline waste.
Why Is This Alignment Problem Worse in Solar?
Every industry has some version of the marketing-sales friction. Solar has a version that's structurally more expensive because of how the in-home appointment model works.
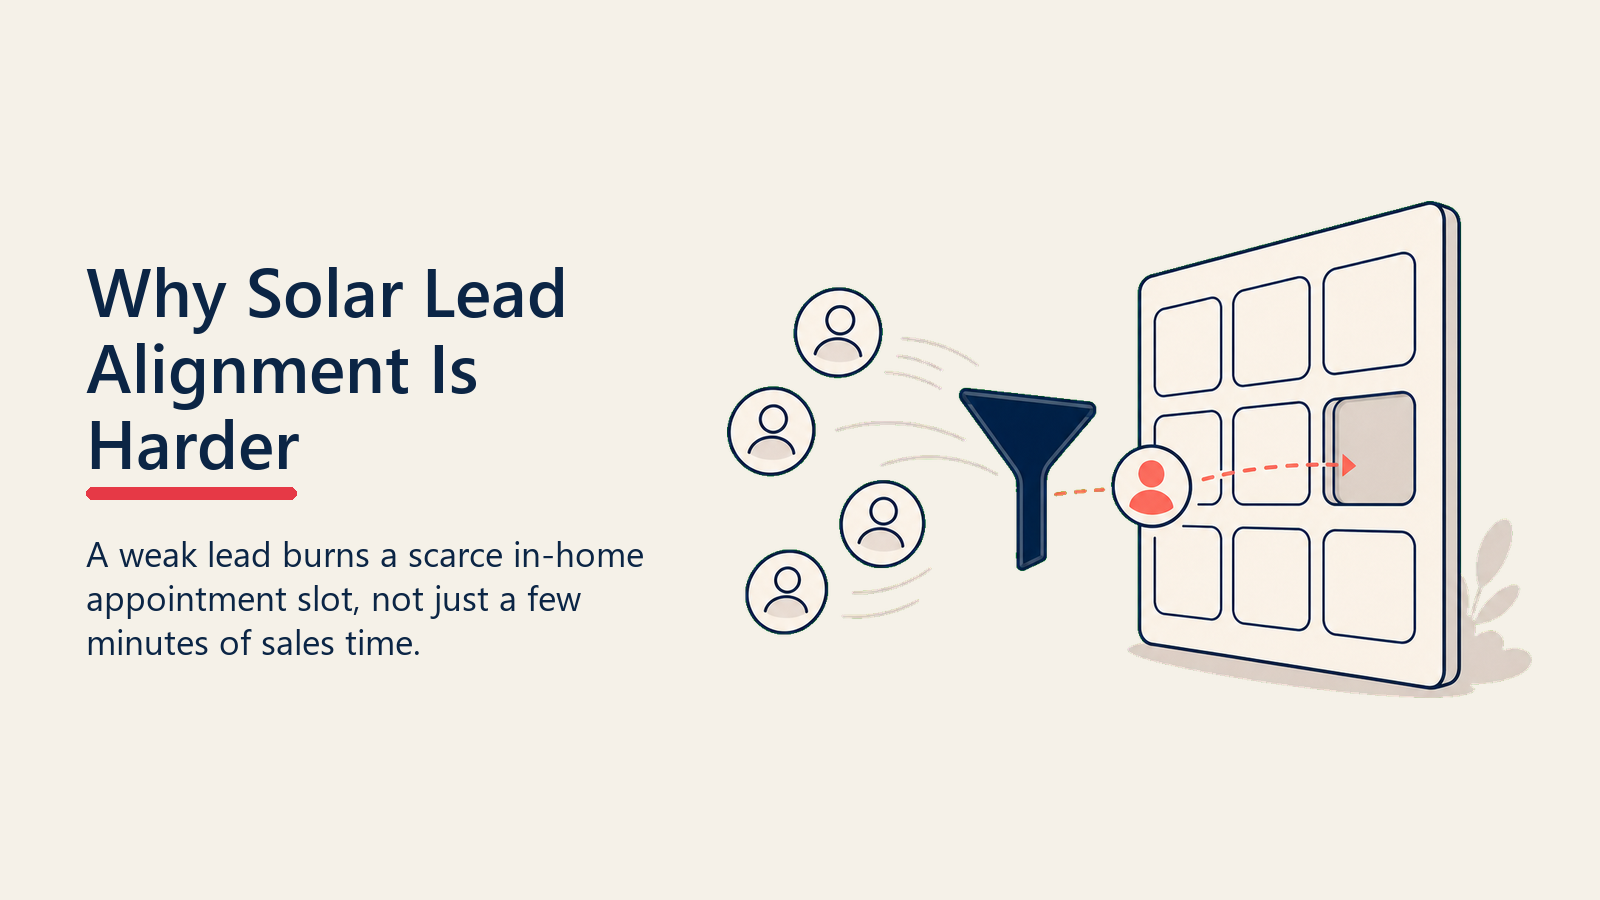
In most digital products, a bad lead costs you a few minutes of a salesperson's time. In solar, a bad lead costs you an appointment slot. The in-home consultation model is capacity-constrained. You can only run so many consultations per rep per week. A slot burned on an unqualified homeowner is a slot that didn't go to someone who could have closed.
Worse, the qualifier gap in solar is wide. A homeowner who fills out a Facebook lead form because they're curious about solar is not the same as a homeowner who owns their home, has a monthly electric bill above $150, has a suitable roof, and is actively considering financing a purchase in the next 60 days. Both of them can fill out the same form. Only one of them is a real prospect.
When marketing optimizes for cost per lead without a quality signal, they naturally drift toward the cheaper-to-acquire curious homeowner and away from the harder-to-acquire serious buyer. Close rates fall. Sales blames marketing. The cycle repeats.
Key Facts
- The Salesforce State of Sales report found that 81% of sales reps say team selling helps them close more deals, yet 82% say aligning with other sellers is at least somewhat challenging. The same paradox plays out between solar sales and marketing teams.
- Residential solar customer acquisition costs averaged $5,270 per customer nationally in 2024, making every wasted appointment slot a measurable hit to unit economics. (Industry estimate, multiple channel analyses)
The Root Cause: Different Metrics Measuring Different Things
Marketing and sales in solar almost always measure different things and call them both "results."
| Team | Primary metric | What it actually measures |
|---|---|---|
| Marketing | Cost per lead | Acquisition efficiency of form fills |
| Marketing | Lead volume | Total top-of-funnel throughput |
| Sales | Close rate | % of consultations that converted |
| Sales | Revenue per setter | Appointment quality reaching closers |
| Sales | Show rate | % of scheduled appointments that happened |
None of these metrics is wrong. But none of them alone tells you what's working. A low cost-per-lead with a 15% close rate means you're efficiently generating bad leads. A high close rate with low volume might mean marketing is underinvesting. A great show rate combined with poor close rates suggests appointment quality issues that go beyond lead source.
The fix is a shared metric that lives between both teams: cost per closed deal by lead source. This is the number that forces alignment because it makes both lead generation efficiency and conversion quality visible at the same time.
Building the Shared Definition of a Qualified Lead
Before you can measure anything together, you need to agree on what you're measuring. Most solar companies don't have a written definition of a qualified lead that both marketing and sales have signed off on.
Start with the homeowner criteria that make someone actually closeable. In residential solar, a minimum viable qualification looks like this:
Must-have criteria (disqualify if missing):
- Homeowner, not renter
- Monthly electric bill over $100 (bills above $150 show stronger economics)
- Roof in usable condition with reasonable solar access
- Credit score meeting the minimum for your primary financing products
- Decision-maker or primary decision-maker accessible at the consultation
Strong positive signals:
- Electric bill over $200/month
- Active interest in energy independence or rate protection
- Homeowner for 3+ years (suggests longer planning horizon)
- Referral from a current customer
- Has already compared quotes from competitors
Red flags that predict no-shows or post-appointment cancellations:
- Lead came from a sweepstakes, prize offer, or heavily incentivized form
- No electric bill discussed or homeowner doesn't know their bill
- Homeowner mentions "just exploring" or "not buying for at least a year"
- Multiple contacts to confirm the appointment needed before it happened
Write this down. Get both the marketing director and the sales manager to agree to it in writing. Then use it to audit your current lead sources and see where the qualified and unqualified leads are actually coming from.
The Lead Scoring Connection
If your company has a lead scoring system in your CRM, the qualification criteria above should map directly to scoring attributes. Leads that meet more must-have criteria get higher scores. High-score leads get prioritized for appointment slots. Marketing can then see which channels are producing high-score leads and which are generating low-score volume.
For the mechanics of building a scoring model, see lead scoring systems. For the qualification framework that drives the scoring logic, see lead qualification frameworks.
The important operational point is that your scoring model should be visible to marketing, not just sales. When a Facebook campaign starts producing leads that score consistently at the bottom of your model, marketing needs to see that signal and adjust targeting before you've burned through a month of appointment slots.
Building the Feedback Loop
The feedback loop is the mechanism that takes what sales learns in consultations and puts it back in front of marketing in a usable form. Most solar companies don't have one. Sales impressions of lead quality stay inside the sales team as vague complaints. Marketing keeps optimizing for what their own metrics tell them.
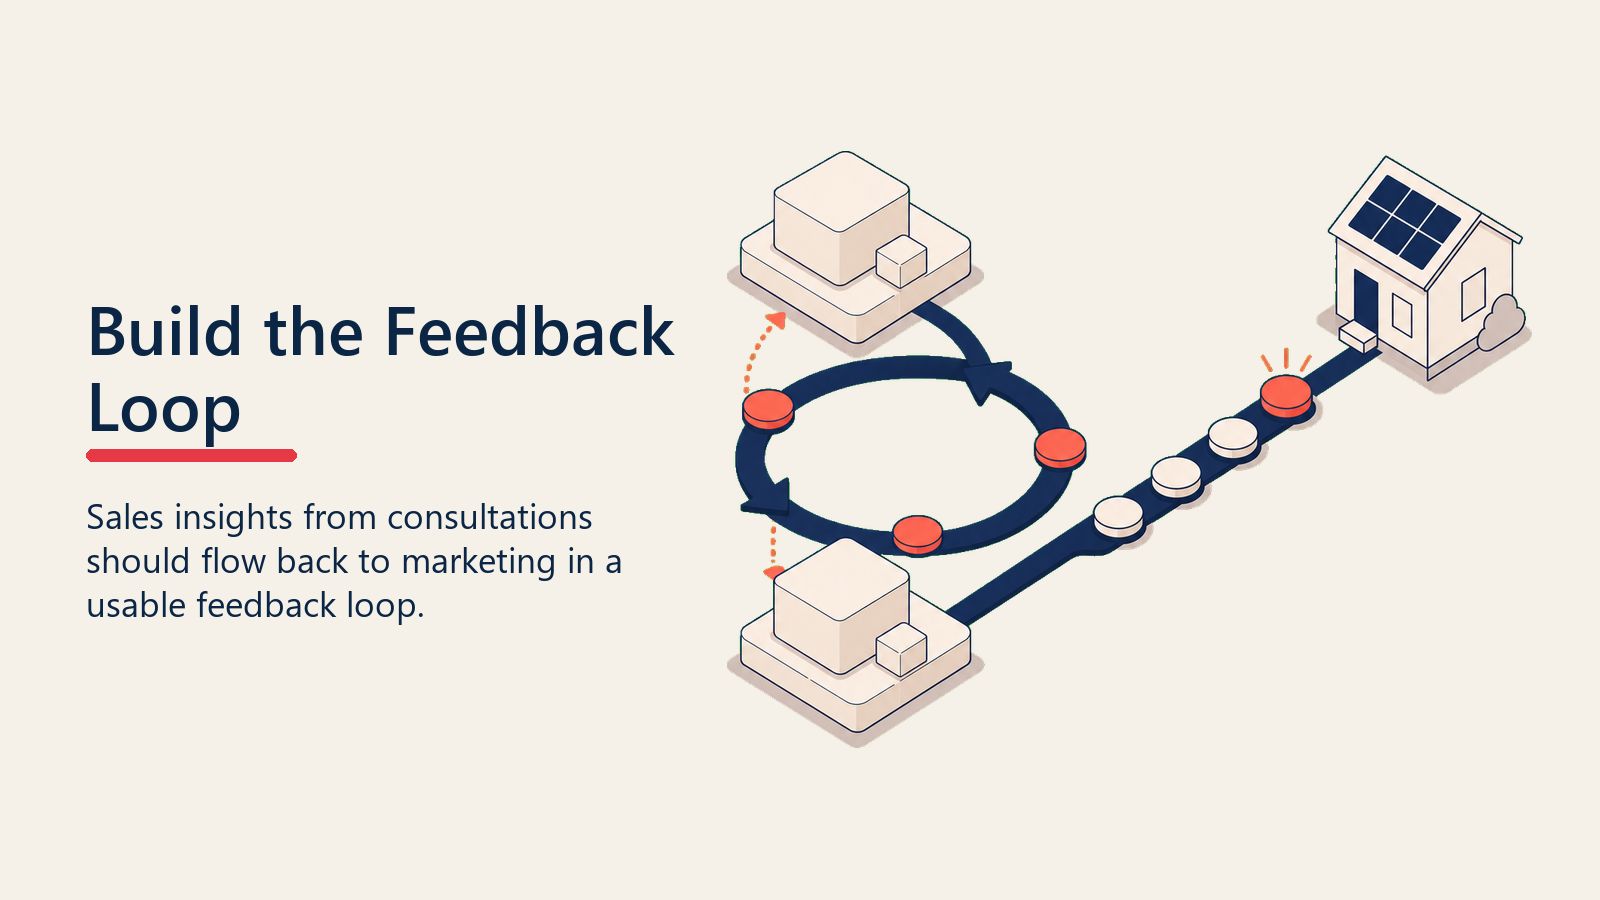
A functional feedback loop has three components:
1. Disposition coding at close or no-close
After every consultation, the closer codes the outcome with a reason. Not just "closed" or "not closed," but a specific disposition that carries signal.
Sample disposition codes:
- Closed: Standard close
- Closed: Referral-sourced (track separately)
- No-close: Renter (disqualify earlier)
- No-close: Bill too low for economics to work
- No-close: Credit issue (knew before consultation)
- No-close: Not a decision-maker
- No-close: Timeline more than 12 months
- No-close: Price objection not resolved
- No-close: Going with competitor
- No-show: No contact after confirmation
- No-show: Canceled day-of
These codes tell you very different things. "No-close: Renter" and "No-close: Credit issue" are qualification failures that should have been caught by the setter or the lead intake process. "No-close: Price objection not resolved" is a sales training issue. "No-close: Going with competitor" is a different problem entirely.
When you break out your no-close reasons by lead source, you get a signal marketing can act on.
2. Monthly lead quality review meeting
Marketing and sales sit in the same room (or call) once a month and review the lead quality data together. The agenda:
- Close rate by lead source for the prior month
- No-show rate by lead source
- Top 3 no-close reasons by lead source
- Cost per closed deal by channel (not cost per lead)
- Any new channels or campaigns marketing wants to test
This meeting shouldn't be a finger-pointing session. It's a diagnostic session. The question isn't "why are your leads bad" but "what does this data tell us about which channels we should scale and which we should cut?"
3. Sales rep annotations in the CRM
Encourage reps and setters to add brief notes on leads when they interact with them. Not required for every lead, but for leads where something stood out: "came from Facebook campaign X, mentioned she saw an ad offering a gift card" or "lead was very warm, said neighbor is already a customer." These annotations, when aggregated, tell you things about channel quality that structured data can't.
Diagnosing Your Lead Sources
Once you have disposition data by source, you can run the analysis that most solar companies never do. Here's what healthy and unhealthy look like by channel:
| Channel | Typical show rate | Typical close rate | What low performance signals |
|---|---|---|---|
| Self-generated (door-to-door, referrals, events) | 75-90% | 35-55% | Setter qualification gaps |
| Inbound digital (SEO, Google Ads) | 55-70% | 20-35% | Landing page mismatches with prospect intent |
| Bought leads (third-party vendors) | 40-60% | 10-20% | Shared leads, low exclusivity, weak qualification |
| Facebook/social leads | 35-55% | 8-18% | High curiosity, low purchase intent |
| Referrals | 80-95% | 45-65% | If low, referral intake process may be weak |
These are industry benchmarks, not guarantees. Your specific numbers will vary. But if your Facebook leads are closing at 20%, you're beating industry average and should scale. If your bought leads are closing at 8%, you may be burning setter time and appointment slots at a loss.
The key is having the data to know, not guessing from impressions. And the fastest way to get that data is a pre-qualification layer that sits between lead intake and appointment booking.
Pre-Qualification as the Bridge Between Teams
One of the most effective alignment tools is a shared pre-qualification process that sits between marketing's lead generation and sales' appointment setting. When a lead comes in, they're run through a brief qualification call (or qualification script) before an appointment is set.
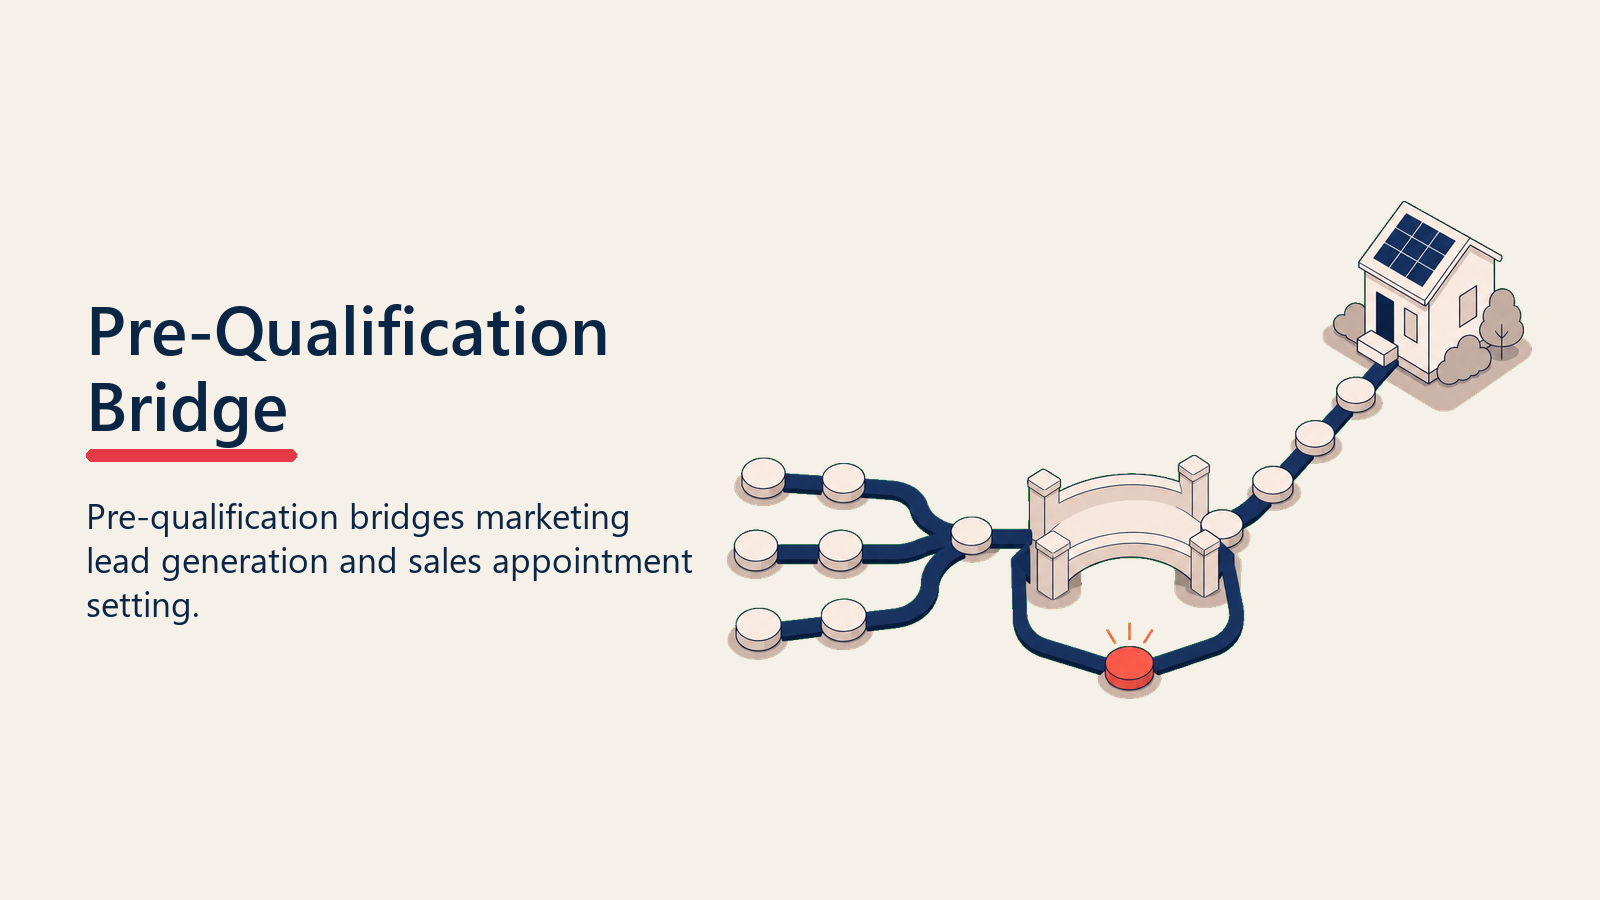
This serves two purposes. It filters out homeowners who can't buy, protecting appointment capacity. And it gives marketing near-real-time feedback on lead quality by channel, because the qualifier flags the source of leads that fail the pre-qualification.
For the full pre-qualification playbook, see solar lead qualification and prescreening.
The alignment point is that pre-qualification criteria should be jointly written by marketing and sales. When marketing owns the criteria alone, they tend to be loose (to protect lead volume numbers). When sales owns them alone, they tend to be strict to the point of filtering out convertible leads. A jointly written standard reflects the actual economics.
What Marketing Needs From Sales to Do Its Job
Sales teams often blame marketing without giving them the data they need to improve. This is a systemic failure, not individual bad faith.
Marketing needs:
- Close rate by lead source, updated monthly
- No-close reason breakdowns by channel, not aggregate totals
- Which creative or campaign variants produced the best close rates, not just the most clicks
- Customer profiles from recent closed deals (demographics, electric bill ranges, roof types, neighborhood clusters)
- Any feedback from closers about what objections or questions leads from specific channels tend to bring to consultations
If sales can't or won't produce this data, marketing will keep optimizing against click-through rates and cost-per-lead. Those metrics are proxies for what actually matters, and they're imperfect ones.
What Sales Needs From Marketing to Do Its Job
The data flow runs the other way too. Sales teams often operate without knowing basic facts about the leads they're working.
Sales needs:
- What ad or offer the lead responded to before submitting their info
- Which channel the lead came from (especially important when buying third-party leads)
- Any demographic or behavioral targeting that produced the lead
- The specific page or landing page experience the homeowner had before converting
When a closer knows that the lead sitting across from them came from a Facebook ad promising a $200 gift card for getting a free quote, they adjust their approach. They know that lead may be there for the gift card, not for solar. That context is valuable, and marketing should be including it in the lead record.
The Metrics Dashboard Both Teams Share
Build one shared dashboard. Marketing and sales directors both look at the same screen. Include:
| Metric | Owner | Update frequency |
|---|---|---|
| Leads by source | Marketing | Weekly |
| Lead score distribution by source | Marketing + Sales | Weekly |
| Show rate by source | Sales | Weekly |
| Close rate by source | Sales | Weekly |
| Cost per lead by source | Marketing | Weekly |
| Cost per closed deal by source | Joint | Monthly |
| No-close reason breakdown | Sales | Monthly |
When both teams see the same numbers, the Monday morning argument changes character. Instead of "your leads are bad," the conversation becomes "looks like Google Ads leads close at 28% vs. Facebook at 11%. What does it cost us to shift budget toward Google?" That's a business conversation, not a blame session. The Salesforce State of Sales report finds that cross-functional alignment is the top growth tactic cited by sales leaders, with 81% of reps saying team selling helps them close, but 82% also reporting that achieving that alignment is at least somewhat challenging. Solar marketing-sales teams face exactly that gap.
For the broader pipeline analytics that support this view, see solar pipeline and funnel analytics. And once you've cleaned up lead quality, see lead setter performance dashboards to track whether your setters are converting that quality into appointments that actually show.
Quotable Nuggets
"Marketing hitting their lead volume target while sales misses close rate is not alignment. It's two teams winning different games. The only shared win condition is cost per closed deal by channel." Principle grounded in Salesforce State of Sales alignment research
"A Facebook lead and a referral lead can fill out the same form. Only one of them can close. The qualifier gap in solar is that wide, and cost-per-lead never shows it." Informed by residential solar lead performance benchmarks
"Industry data puts solar customer acquisition at roughly $5,270 per residential customer. At that cost, a 10% improvement in close rate isn't a sales win. It's a company-level financial event."
The Lead Quality Calibration Loop: After every consultation, the closer codes a specific disposition reason (not just closed/not closed), linked to the lead source. Marketing reviews this disposition data in a monthly joint session, not to assign blame, but to identify which channels are producing close-ready leads vs. form fills. The loop runs monthly and the budget follows the data. That single rhythm from disposition code to joint review to budget shift is the mechanism that converts alignment from a value to a process.
Frequently Asked Questions about Marketing and Sales Lead-Quality Alignment for Solar Companies
What is the single most important shared metric for solar marketing and sales teams?
Cost per closed deal by lead source. This metric forces both teams to look at the same outcome. Marketing can no longer optimize only for cost-per-lead, and sales can no longer blame "bad leads" without data. Run it monthly for each channel and let the number drive budget decisions.
How do we define a qualified solar lead in a way both teams accept?
Start with homeowner must-haves that are binary: owns the home, monthly electric bill over $100-150, roof in usable condition, credit meets your minimum financing threshold, decision-maker accessible at the consultation. Document these together in writing, with both the marketing director and sales manager signing off. Anything not in writing becomes negotiable under pressure.
What disposition codes should closers use after every consultation?
At minimum: Closed, No-close with a specific reason (renter, bill too low, credit issue, not a decision-maker, timeline over 12 months, price objection, going with competitor), No-show with a sub-code (no contact after confirmation, canceled day-of). The specificity matters because "no-close: renter" signals a qualification failure the setter should have caught, while "no-close: price objection" signals a sales training gap.
How often should marketing and sales meet to review lead quality data?
Monthly for the full lead quality review (close rate by source, no-show rate by source, top no-close reasons, cost per closed deal). Weekly for a lighter dashboard check-in. The monthly meeting should include disposition breakdowns by channel, not just aggregate numbers.
What should marketing provide to sales reps before each consultation?
The ad or offer the lead responded to, the channel it came from, any targeting parameters that produced the lead, and the landing page experience. When a closer knows the lead came from a Facebook ad with a gift card incentive, they adjust their opening approach accordingly. That context is worth more than any additional training module.
Why do Facebook leads close at lower rates than other solar channels?
Facebook leads typically represent higher curiosity and lower purchase intent. Homeowners who respond to a social ad are at an earlier stage of consideration than homeowners who searched "solar installation near me" and clicked a Google result. The offer type matters too. Ads promising incentives attract reward-seekers, not buyers. Facebook can still be a viable channel if the close rate and CPL produce an acceptable cost per closed deal.
How do we build a pre-qualification process that both teams support?
Write the qualification criteria jointly. When marketing owns it alone, the bar is set low to protect lead volume. When sales owns it alone, the bar is set high enough to filter out convertible prospects. A jointly written standard reflects the actual economics of your business and both teams have ownership over making it work.
What's the fastest path to improving close rates if we have no existing feedback infrastructure?
Start with three steps this week: (1) add a required disposition code field to your CRM for every consultation outcome, (2) tag every lead with its channel source before the appointment is set, (3) pull a 90-day analysis of close rate and no-show rate by source. Run those results in a joint marketing-sales meeting. Within 90 days you'll know which channels are generating revenue and which are generating noise.
A Practical Starting Point
If your company doesn't have any of this infrastructure, the fastest path to improvement is:
- Start disposition coding every consultation outcome this week. Even basic coding (closed, no-close, no-show) with a reason field.
- Tag every lead with its source in your CRM before the appointment is set.
- Run a 90-day analysis: close rate and no-show rate by source.
- Present the results in a joint marketing-sales meeting. Let the data drive the conversation.
Within 90 days you'll know which channels are actually producing revenue and which ones are producing noise at your cost. That knowledge, consistently acted on, is worth more than any campaign optimization either team can run in isolation.
The goal isn't for marketing to win or for sales to win. It's for the company to stop paying for appointments that can't close and start investing more in the channels that can. That's an outcome both teams benefit from, which is what makes alignment worth building.
For the full context on opportunity qualification upstream of the appointment, see opportunity qualification. The same principles apply whether the opportunity is being qualified in a CRM pipeline or at a door.

Senior Implementation Consultant
On this page
- Why Is This Alignment Problem Worse in Solar?
- The Root Cause: Different Metrics Measuring Different Things
- Building the Shared Definition of a Qualified Lead
- The Lead Scoring Connection
- Building the Feedback Loop
- 1. Disposition coding at close or no-close
- 2. Monthly lead quality review meeting
- 3. Sales rep annotations in the CRM
- Diagnosing Your Lead Sources
- Pre-Qualification as the Bridge Between Teams
- What Marketing Needs From Sales to Do Its Job
- What Sales Needs From Marketing to Do Its Job
- The Metrics Dashboard Both Teams Share
- Quotable Nuggets
- A Practical Starting Point