Pharmaceutical Sales KPIs and Metrics: What Field-Force Leaders Actually Measure
Turn this article into takeaways for your work.
Each assistant summarizes the article only for you and suggests best practices for your work.
Here's the metric trap most pharma field forces fall into: they measure calls made and calls planned, compare those two numbers, and call it performance management.
Calls completed is an activity metric. It tells you what your reps did. It says nothing about whether any of it worked. A rep who visits 8 doctors per day, every day, for a year could be your highest performer or your most expensive underperformer. It depends on which doctors they're visiting, what happens during those visits, and whether any of it changes prescribing behavior.
The teams that grow market share have a different measurement discipline. They distinguish between what reps do (activity), whether they're doing it in the right places (targeting), and whether it's actually working (outcomes). They use leading indicators to spot problems before they show up in monthly sales. And they cascade metrics differently depending on whether you're a rep, a first-line manager, or a regional director.
This article defines that measurement stack for pharma commercial leaders: the three tiers of metrics, the KPIs that matter by channel, what each role should own, and how to build a one-page dashboard that drives weekly action rather than just weekly reporting.
Three Tiers of Pharma Sales Metrics
Not all metrics carry the same diagnostic value. The discipline of pharma field measurement starts with sorting your KPIs into three tiers.
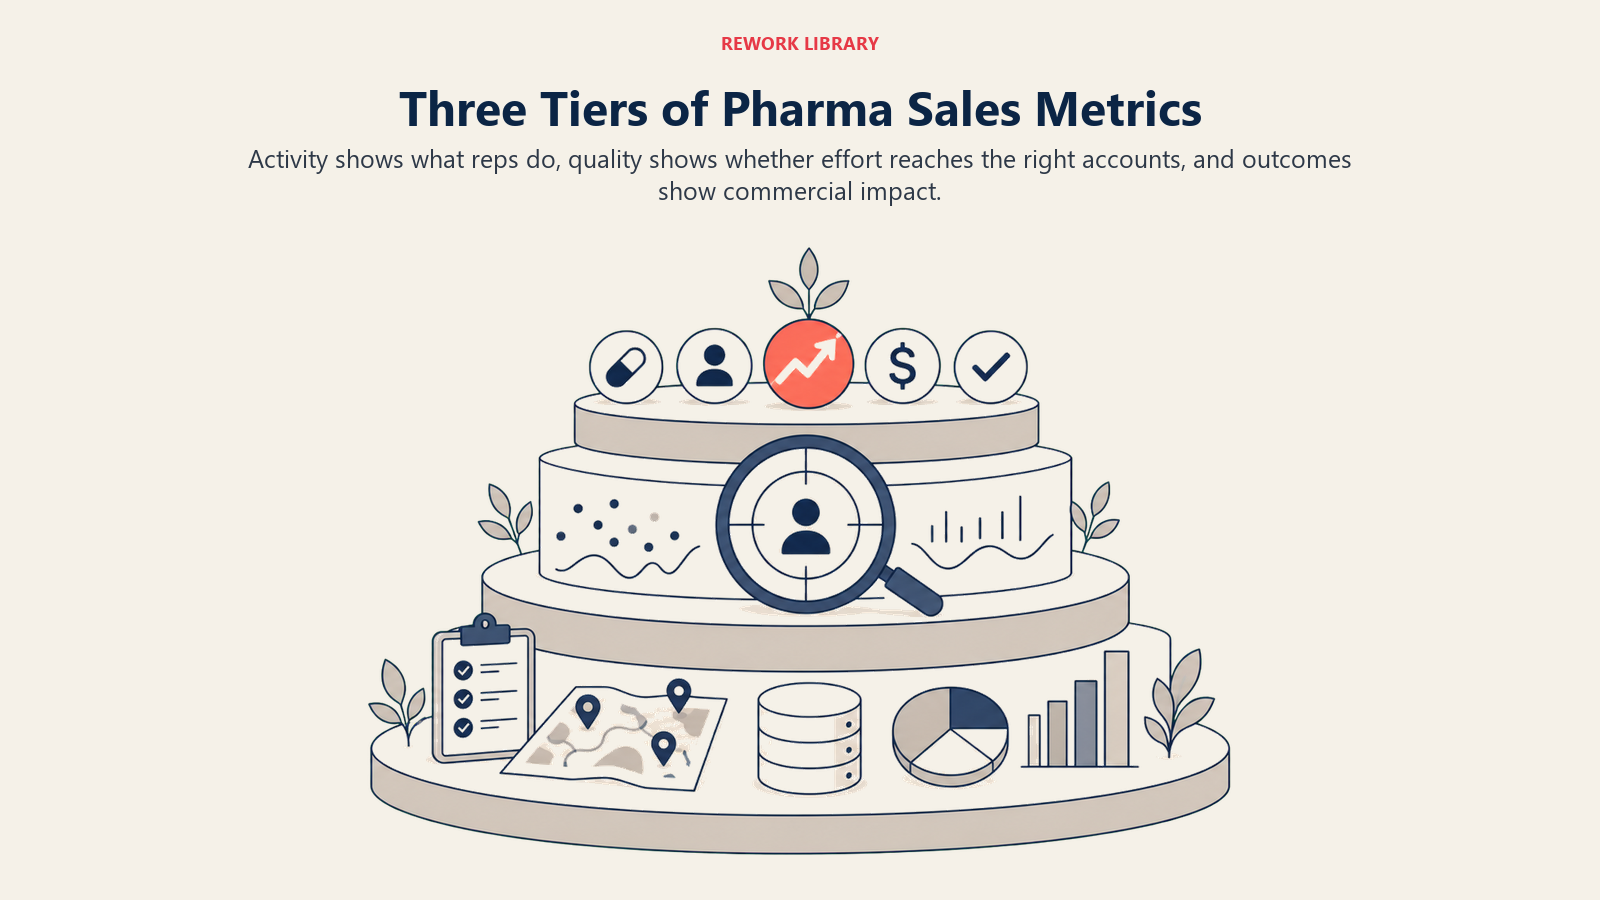
Tier 1: Activity Metrics
Activity metrics tell you what reps are doing. They're important for operational visibility but dangerous if mistaken for performance.
- Total calls made vs. planned
- Samples distributed (volume and value)
- Details delivered (product presentations per call)
- Medical education events conducted
- Promotional material distribution
These metrics confirm that the field force is operating. They don't confirm it's operating effectively. A 95% call completion rate against a poorly designed call plan is worse than a 75% rate against a well-targeted one.
Tier 2: Intermediate Metrics (Quality and Targeting)
Intermediate metrics measure whether the activity is being directed at the right targets with the right frequency and quality. This is where most field forces have their biggest measurement gap.
- Coverage rate (percentage of target accounts receiving at least one visit in a period)
- Frequency compliance (percentage of accounts visited at planned call frequency)
- Reach (percentage of target prescribers contacted in a cycle)
- Targeting compliance (percentage of calls on A-grade vs. B-grade vs. C-grade accounts)
- Call quality scores (where rep call quality is being assessed)
Targeting compliance is particularly revealing. If your A-grade prescribers (high volume, high potential) make up 20% of your target universe but are receiving only 30% of your calls when they should receive 50-60%, your field force is diluting effort on lower-value contacts. No amount of call volume fixes that.
Tier 3: Outcome Metrics
Outcome metrics tell you whether field activity is actually driving commercial results. These are the numbers that matter to the CFO, the brand team, and ultimately the business.
- Prescription volume (primary sales as a proxy)
- Secondary sales / sell-out (actual dispensed units)
- Market share by molecule and by prescriber segment
- New-to-brand (NtB) scripts (first prescriptions from previously non-prescribing doctors)
- Prescriber conversion rate (non-prescribers converted to active prescribers)
- Account retention rate (prescribers who remain active quarter-over-quarter)
The relationship between the pharmaceutical sales growth model and this metric hierarchy is direct: activity metrics correspond to field execution, intermediate metrics correspond to coverage and targeting, and outcome metrics correspond to demand generation, pull-through, and loyalty levers.
Key Facts: Pharma Field Measurement
- IQVIA's National Prescription Audit covers roughly 93% of outpatient prescription activity in the US, making it the industry standard for sell-out benchmarking.
- Deloitte research on biopharma field effectiveness found that reps who have access to timely market data make better-informed calls than those working from lagged monthly reports.
- Even a fraction-of-a-point market share swing in a major therapeutic class can represent hundreds of millions of dollars of annual revenue at the scale of the global pharmaceutical market.
Pharmacy Channel KPIs
The pharmacy channel has distinct commercial dynamics and requires its own KPI set. These metrics track distribution health, pull-through performance, and the gap between prescriptions generated and prescriptions filled.
| KPI | Definition | Review Frequency |
|---|---|---|
| Stock availability rate | % of target SKUs in stock at key pharmacy outlets | Weekly |
| Out-of-stock incidents | Number of confirmed stock-out events by outlet | Weekly |
| Sell-out volume | Units actually dispensed to patients | Monthly |
| Sell-in vs. sell-out ratio | Gap between invoiced and dispensed units | Monthly |
| Pharmacy coverage rate | % of target pharmacies visited in cycle | Monthly |
| Shelf share | % of shelf space relative to competitors | Quarterly |
| Pharmacy staff awareness | Pharmacist knowledge score on key product attributes | Quarterly |
The sell-in vs. sell-out gap deserves particular attention. When sell-in (units sold into distribution and pharmacy) significantly exceeds sell-out (units dispensed to patients), it signals channel inventory loading that inflates your primary sales numbers while actual patient demand is lower. This gap is a classic sign of channel stuffing, often driven by incentive structures that reward sell-in rather than sell-out. Understanding this dynamic sits at the core of the pharma field sales economics framework.
Secondary sales tracking is the most reliable measure of real market performance. IQVIA's National Prescription Audit covers roughly 93% of outpatient prescription activity, making it the industry standard for sell-out benchmarking. If you don't have sell-out data from your key pharmacy channels, building that data pipeline is a higher priority than adding any other KPI.
Doctor and HCP KPIs
Prescribing metrics are the heart of the HCP (health care professional) channel measurement system. But raw prescription volume alone is a lagging signal. You need to track the prescribing funnel to understand where growth is coming from and where it's at risk.
| KPI | Definition | Review Frequency |
|---|---|---|
| Total prescriptions (TRx) | Total scripts written for your product | Monthly |
| New-to-brand scripts (NtB) | First prescriptions from a previously non-prescribing doctor | Monthly |
| Prescribing doctor count | Number of unique prescribers active in the period | Monthly |
| Market share by segment | Your share of prescriptions within therapeutic category | Monthly |
| Prescriber conversion rate | Non-prescribers moved to active prescribers | Quarterly |
| Prescriber retention rate | Active prescribers from previous period still prescribing | Quarterly |
| Detail-to-script ratio | Prescriptions generated per detail delivered | Quarterly |
New-to-brand scripts are particularly important in growth-stage brands. NtB growth means you're expanding the prescriber base, not just deepening existing relationships. A brand that grows total scripts while NtB scripts decline is becoming more concentrated in a shrinking pool of loyal prescribers, a pattern that signals future vulnerability. The same principle applies in any sales model: win rate improvement requires tracking where new wins are coming from, not just total closed volume.
Prescriber retention is the mirror metric. It tells you whether doctors who prescribe your product remain committed quarter-over-quarter or are substituting competitors over time. Combined with NtB, these two metrics tell you whether your prescriber base is expanding, stable, or eroding, and how urgently you need to act on what you find.
Hospital and Institutional KPIs
Hospital channel metrics reflect the longer sales cycles and institutional purchasing dynamics in this segment. The key indicators measure both the commercial pipeline (tender activity and formulary status) and the volume performance within secured accounts.
| KPI | Definition | Review Frequency |
|---|---|---|
| Formulary listing rate | % of target hospitals with product on formulary | Quarterly |
| Tender win rate | % of tenders won vs. tenders bid | Quarterly |
| Volume per listed account | Units sold per hospital with formulary access | Monthly |
| Hospital prescribing depth | Number of active prescribers per listed account | Quarterly |
| Account retention rate | Listed accounts retained year-over-year | Annual |
| Time to formulary | Average time from submission to listing approval | Quarterly |
Volume per listed account is a useful diagnostic. Low volume in listed accounts indicates a pull-through problem within the institution: the product is on formulary but doctors aren't prescribing it, or institutional purchasing isn't being activated. This is a different problem from low formulary listing rate, which is an access and market entry problem. Knowing which constraint you're facing determines which role needs to act next.
Metric Ownership by Role
One of the most common failures in pharma field measurement is misaligning metrics to roles. Reps shouldn't be managing brand-level market share. Directors shouldn't be managing individual call completion. The cascade should be deliberate.
Medical Rep (Individual)
- Daily calls vs. plan
- Sample distribution vs. quota
- Coverage of A-grade accounts (are their priority targets being visited at the right frequency?)
- Territory prescription trend (weekly or biweekly from data feeds)
- NtB scripts generated in territory
First-Line Sales Manager (District / Area)
- Team targeting compliance (are reps covering the right accounts?)
- District coverage and frequency rates
- District prescription volume and NtB scripts
- Underperforming rep identification (who's lagging and why?)
- Pharmacy out-of-stock alerts in district
Regional Director
- Regional market share vs. target
- Regional secondary sales vs. primary sales gap
- Territory-level productivity variance (which territories are over- and under-performing?)
- Headcount efficiency (revenue per rep by territory)
- Prescriber base health (retention rate, prescriber count trend)
This cascade connects to the territory analytics and sales dashboards that each role uses. When the metric hierarchy is clear, managers spend their coaching time on the right conversations rather than trying to explain why national market share moved 0.2 points to a rep who needs to focus on visiting the right ten doctors this week.
What Is the Difference Between Leading and Lagging Indicators in Pharma Field Sales?
The most operationally valuable investment in pharma field metrics is building an early-warning system before sales miss.
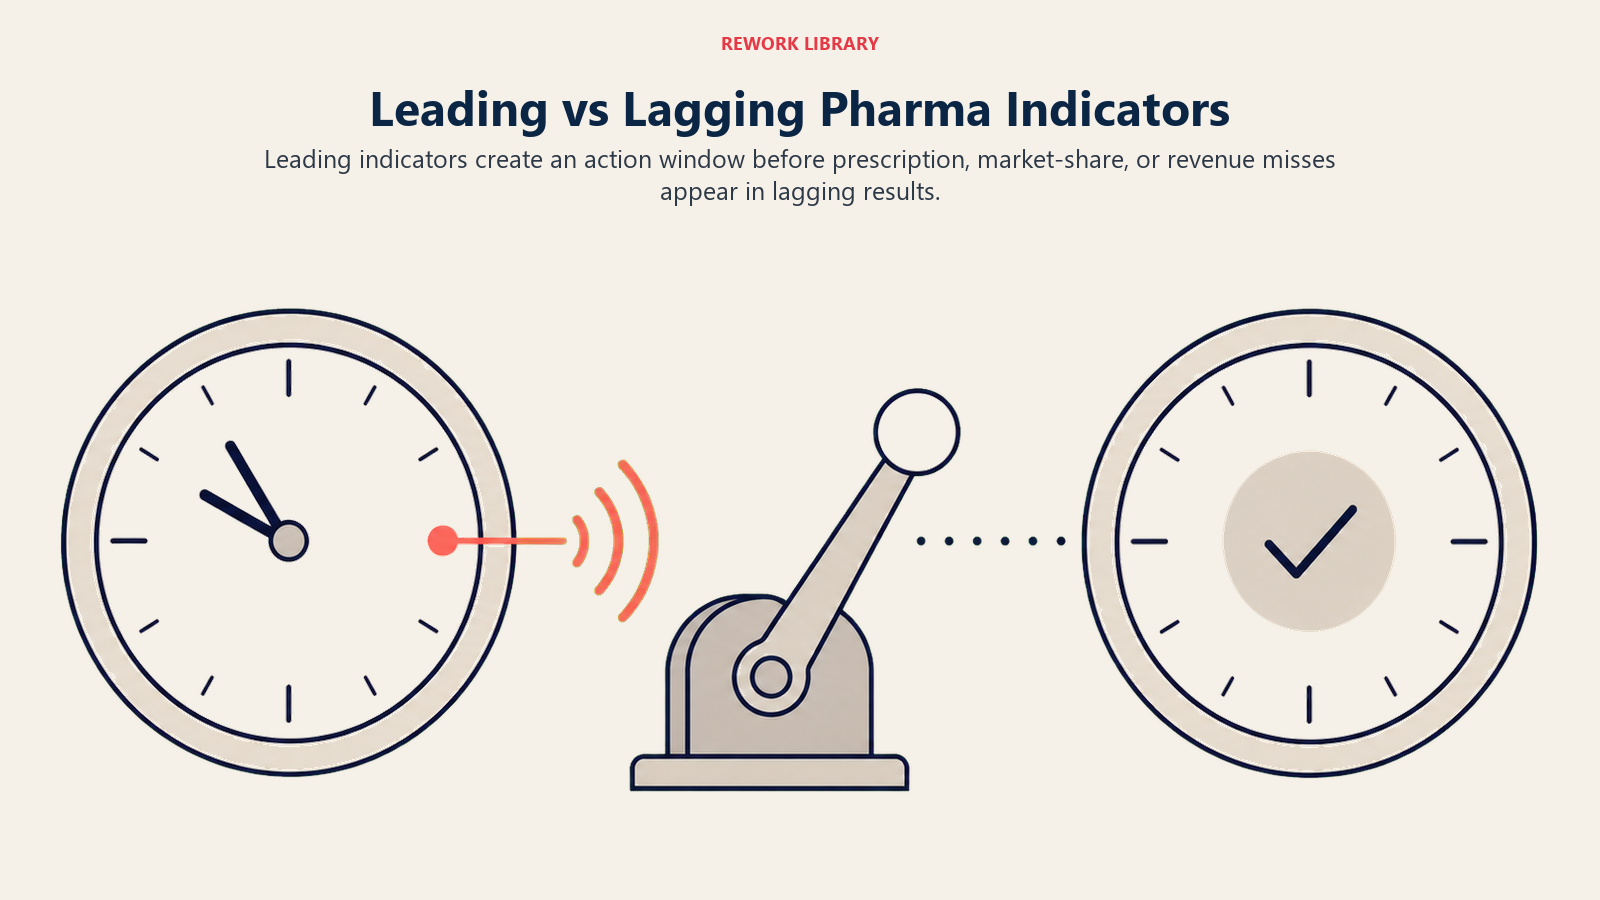
Lagging indicators tell you what happened: prescriptions written last month, market share last quarter, annual territory revenue. These are important for evaluation but useless for intervention.
Leading indicators predict what's likely to happen: prescriber engagement trends, targeting compliance drift, pharmacy stock alerts, NtB pipeline weakness. Revenue operations teams building cross-functional measurement systems face the same challenge: structuring a RevOps metrics stack that distinguishes leading signals from lagging ones so managers can act before the quarter closes with a miss.
Leading vs. Lagging Indicator Matrix
| Leading Indicator | Lag it Predicts | Action Window |
|---|---|---|
| Coverage rate drop below 70% | Prescription volume decline in 4-8 weeks | Immediate reallocation |
| NtB scripts below 15% of TRx | Prescriber base concentration risk in 2 quarters | Targeting review |
| Sell-in vs. sell-out gap widening | Primary sales inflation, upcoming correction | Incentive and channel review |
| A-grade targeting compliance below 50% | Market share loss in 6-12 weeks | Call plan revision |
| Prescriber retention rate declining | TRx erosion in next quarter | Loyalty activity increase |
| Pharmacy out-of-stock rate rising | Secondary sales shortfall in 2-4 weeks | Supply and coverage fix |
Building this early-warning system requires weekly data access, not just monthly reporting. Weekly coverage reports, biweekly prescription trend data from market research partners, and weekly pharmacy stock checks give field managers the information to course-correct before the month closes with a miss. Deloitte's research on biopharma field effectiveness highlights how reps with access to timely market data make more effective calls compared to those relying on lagged monthly reports.
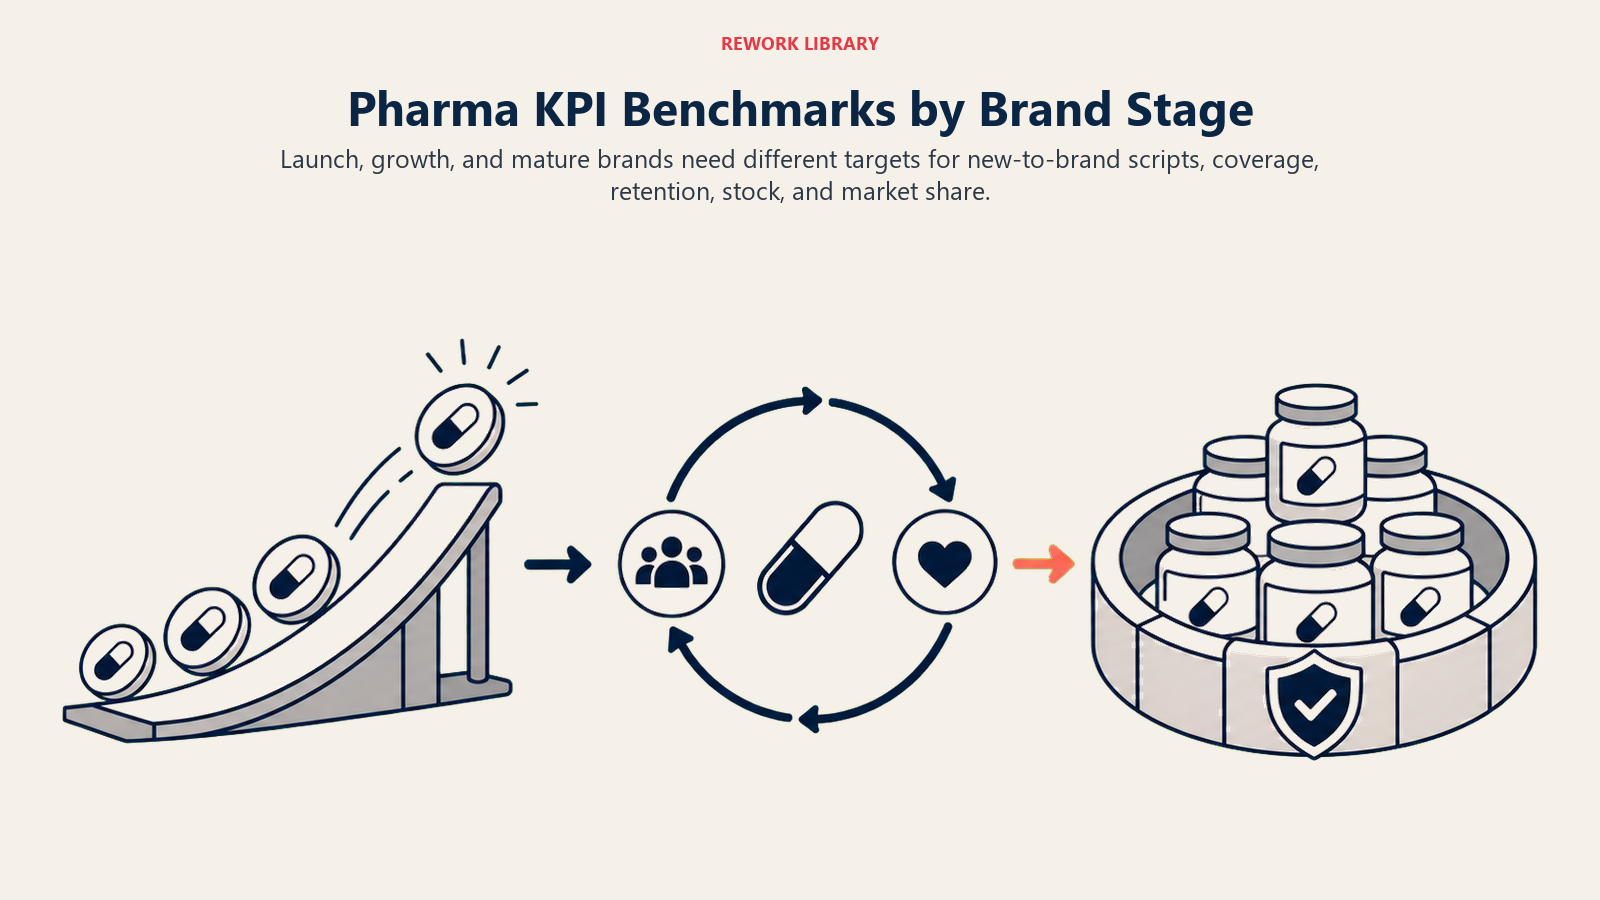
KPI Benchmarks by Field Maturity Stage
What good looks like on each metric shifts depending on where your brand sits in its lifecycle. A launch brand and a mature brand have different benchmarks for the same metric.
| KPI | Launch Stage | Growth Stage | Mature/Defense Stage |
|---|---|---|---|
| NtB scripts as % of TRx | 40-60% | 20-35% | 10-20% |
| Prescriber coverage rate | 60-70% of target list | 75-85% | 80-90% of priority segments |
| Targeting compliance | 55-65% (building database) | 70-80% | 75-85% |
| Prescriber retention rate | 50-65% (early base) | 70-80% | 80-90% |
| Pharmacy stock availability | 80-85% (distribution build) | 90-95% | 92-97% |
| Market share growth (monthly) | 0.3-0.8 pts | 0.1-0.3 pts | Flat to +0.1 pt |
These benchmarks are more meaningful when anchored to the competitive landscape. In major therapeutic classes, even a fraction-of-a-point share swing can represent hundreds of millions of dollars. That context shapes what "good" market share growth looks like in any given category.
Using launch-stage benchmarks for a mature brand will make your field look like it's failing. Using mature-stage benchmarks for a launch brand will create false satisfaction with early traction that hasn't yet translated to scale. The benchmark set needs to match the brand stage, and field leadership needs to reset those benchmarks explicitly as brands move through their lifecycle.
As a working field heuristic, when NtB scripts fall below 15% of total TRx, a brand is becoming increasingly concentrated in a shrinking pool of loyal prescribers. That concentration is a compounding vulnerability: competitive switching or prescriber attrition has an outsized impact because there are fewer prescribers to absorb the loss. The question to ask each quarter is whether your early-warning signals are flashing before the loss shows up in total TRx, or after.
Designing the One-Page Field Dashboard
The Activity-Quality-Outcome (AQO) Dashboard is a practical name for the three-tier structure that ties weekly field data into one actionable view. Activity (calls, samples) sits at the top for operational visibility. Quality (targeting compliance, coverage rate) anchors the middle as the diagnostic layer. Outcomes (TRx, NtB, market share) close the bottom as the commercial scorecard. When these three tiers live on one page and are reviewed weekly, the dashboard drives decisions rather than just delivering status updates.
The most actionable field dashboard isn't a reporting deck. It's a one-page view that every manager reviews on the same weekly cadence and uses to make one or two decisions.
The structure of a weekly field dashboard:
Weekly snapshot (top of page):
- Prescription trend vs. prior period and vs. target (market and territory)
- Coverage rate this week vs. plan
- Top 3 out-of-stock alerts in key pharmacy accounts
Trend view (middle of page, 8-week rolling):
- TRx and NtB script trends by district
- Targeting compliance trend by rep
- Secondary sales vs. primary sales trend
Action flags (bottom of page):
- Territories with coverage below 65% this week
- Reps with A-grade targeting compliance below 50%
- Pharmacy accounts with confirmed stock gaps
When the dashboard is built around action flags rather than comprehensive reporting, field managers spend less time reading and more time acting. The pharma CRM and sales force automation platform your field uses should be able to generate this view automatically from existing activity and market data inputs.
The goal is not to measure everything. It's to measure the right things at the right level for the right people, with enough leading indicators to catch problems before they become misses. A field force that operates with that discipline compounds growth. One that reports calls against a plan manages activity without managing outcomes.
Learn More

Senior Implementation Consultant
On this page
- Three Tiers of Pharma Sales Metrics
- Pharmacy Channel KPIs
- Doctor and HCP KPIs
- Hospital and Institutional KPIs
- Metric Ownership by Role
- What Is the Difference Between Leading and Lagging Indicators in Pharma Field Sales?
- KPI Benchmarks by Field Maturity Stage
- Designing the One-Page Field Dashboard
- Learn More