Field Force Sizing and Deployment: How Pharma Leaders Optimize Territory Coverage
Turn this article into takeaways for your work.
Each assistant summarizes the article only for you and suggests best practices for your work.
There are two ways to get field force sizing wrong, and both are expensive.
Undersizing leaves market share on the table. Your A-account targets aren't seeing your rep at the right frequency, competitors are filling the gap, and you're spending on manufacturing capacity for prescriptions that never happen. In specialty markets, missing a single oncologist who writes 50 scripts a month can cost more than a full rep headcount.
Oversizing destroys margins without improving outcomes. Beyond a saturation point, additional rep visits to the same health care professional (HCP) produce diminishing returns. You're paying full rep cost including salary, benefits, car allowance, sample budget, and management overhead for calls that don't change prescribing behavior. In mature markets, overstaffed field forces are a primary reason commercial P&Ls underperform against revenue plan. Deloitte's analysis of pharma field force transformation confirms this pattern, finding that static targeting approaches that treat all customers the same are among the most common drivers of commercial inefficiency in life sciences companies.
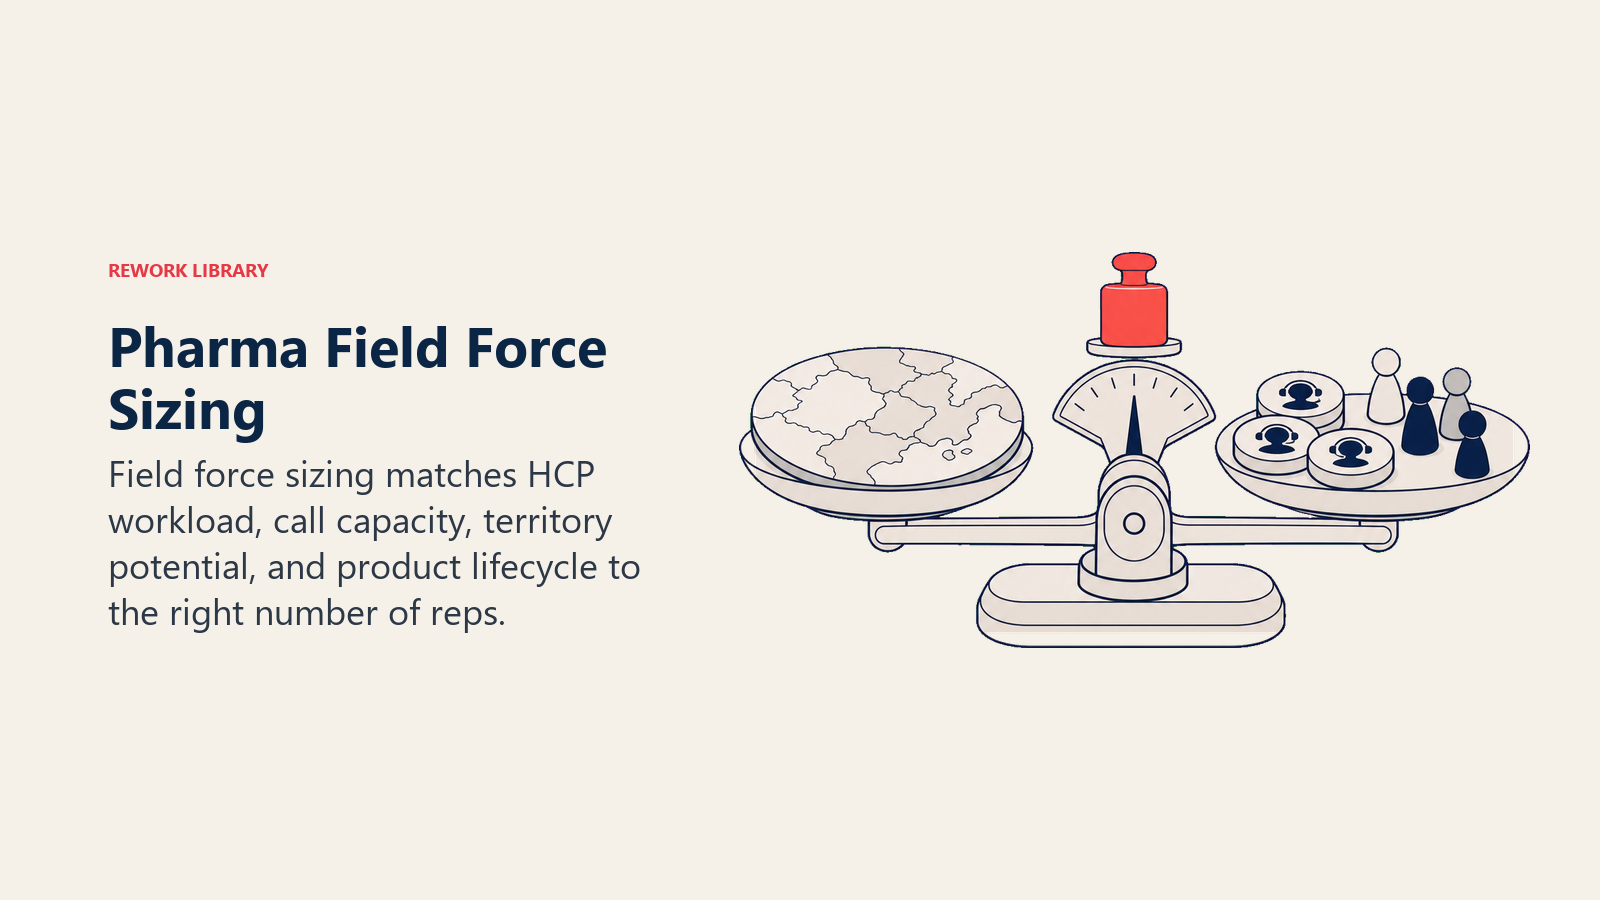
Field force sizing isn't an HR headcount decision or an annual org chart exercise. It's a commercial lever that should be revisited every time a material market event occurs and stress-tested at every product lifecycle transition. This guide gives pharma commercial directors and sales operations leaders the analytical framework to get it right.
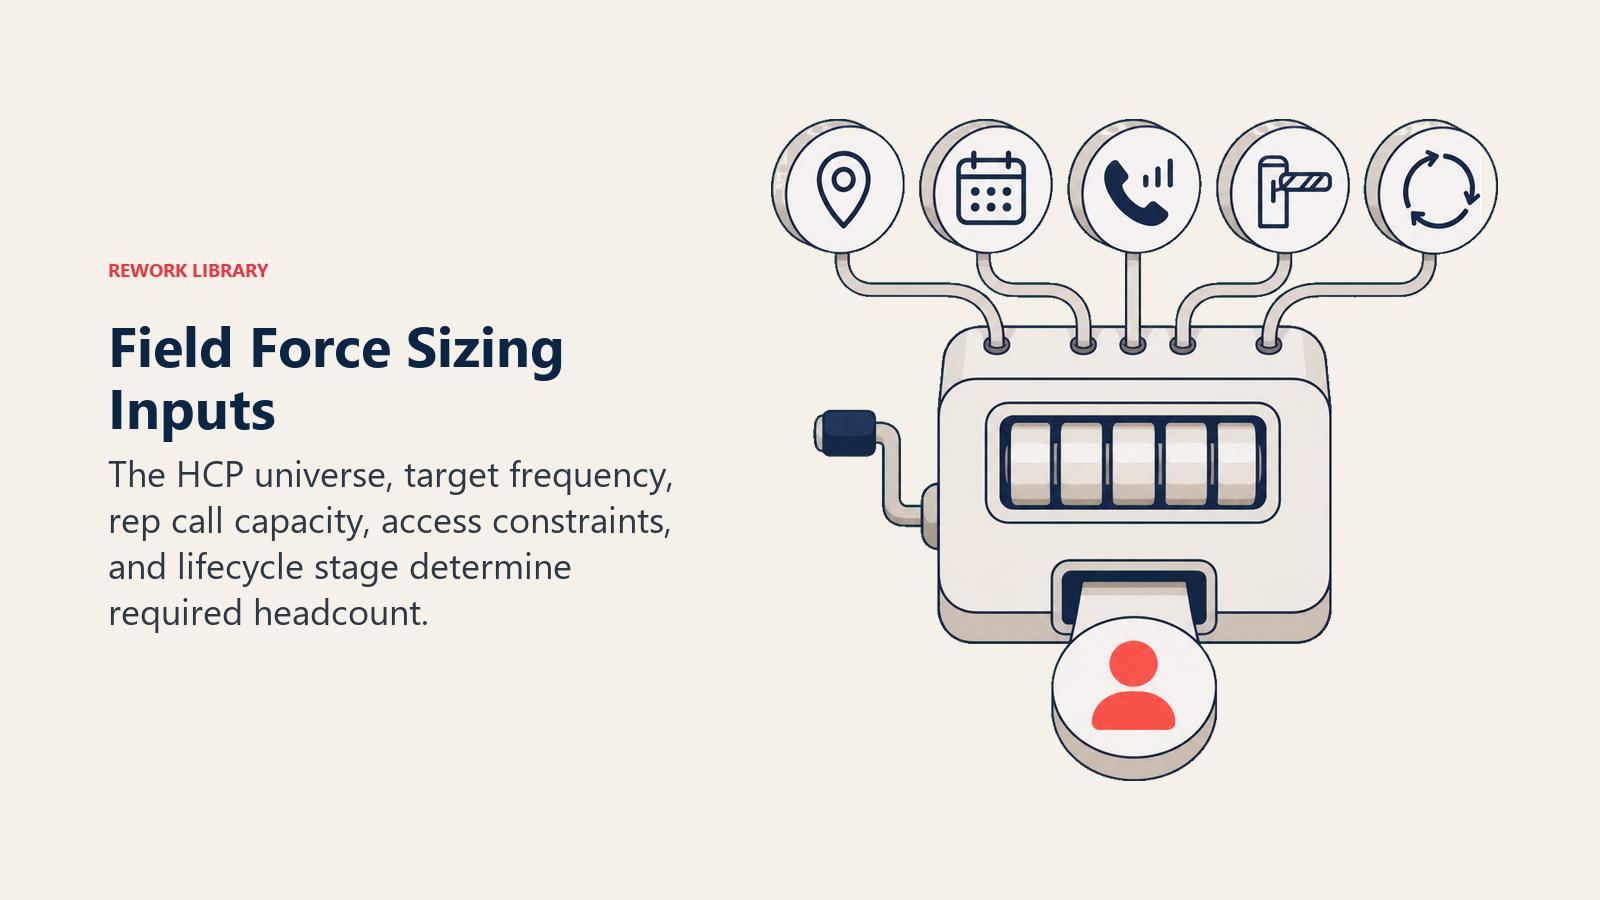
Core Sizing Inputs
Every workload-based sizing model draws from the same four inputs. Get these wrong and the model produces the wrong answer, regardless of how sophisticated the formula is.
Key Facts: Field Force Sizing
- Primary care reps in dense urban territories average 7 to 9 productive calls per day; hospital-only specialty reps typically achieve 4 to 6, making the choice of rep type a direct input into headcount models (planning ranges; actual performance varies by territory density and access patterns)
- Fully loaded rep costs vary by market and seniority; for detailed cost-component breakdowns including salary, bonus, benefits, car, samples, and overhead, see the Pharma Field Sales Economics article
- Deloitte's analysis of pharma commercial operations found that static targeting approaches that treat all customers the same are among the most common drivers of commercial inefficiency in life sciences companies (Deloitte, 2026)
Input 1: Total Addressable Call Universe
Your call universe is the total number of HCP accounts in your target segments, stratified by prescribing potential:
- A accounts: High-prescribing or high-potential targets. These are the accounts where call frequency most directly drives script volume. Your model should identify exactly how many of these exist in each geographic cluster.
- B accounts: Mid-tier prescribers or growth opportunities. They need regular but less frequent coverage than A accounts.
- C accounts: Low-potential or low-priority accounts. Cover only when routing efficiency allows.
The call universe should be built from prescribing data (IMS/IQVIA prescription audits, APLD claims data, or equivalent), filtered for your approved indication, and segmented using actual dispensing behavior rather than HCP specialty alone. A cardiologist who prescribes no antihypertensives isn't an A account for your antihypertensive. A GP who writes 30 scripts per month for your category probably is.
Sales territory mapping and account universe work should precede any sizing exercise. You can't size for calls you haven't mapped.
Input 2: Target Call Frequency per Segment
Call frequency targets represent how many times per year you want a rep to contact each account tier. These aren't arbitrary. They should reflect the frequency response curve for your specific product and category, validated against real field data where available.
Typical benchmarks by segment:
| Account Tier | Calls per Year (Primary Care) | Calls per Year (Specialty) |
|---|---|---|
| A accounts | 10 to 14 | 8 to 12 |
| B accounts | 5 to 7 | 4 to 6 |
| C accounts | 1 to 3 | 1 to 2 |
These figures vary by product lifecycle stage (launch vs. maturity), therapeutic area (chronic disease vs. acute), and competitive intensity. A launch in a crowded oncology space might target 12 specialist calls per year because early prescriber habit formation requires intensive engagement. A mature antifungal in a generic-heavy primary care market might target 4 to 5 GP calls per year for B accounts without sacrificing share.
Call frequency and coverage optimization analysis should determine your frequency targets empirically rather than applying industry defaults without validation.
Input 3: Productive Calls per Rep per Day and Working Days per Year
This is where field force models are most commonly miscalculated. Commercial teams often plug in theoretical maxima rather than real field capacity.
Realistic productive call assumptions:
- Working days per year: 220 to 230 (after annual leave, public holidays, training days, and internal meetings)
- Productive call days: 180 to 195 (further reduced by national sales meetings, regional meetings, hospital admin days, and rep sick leave)
- Average productive calls per day by type:
- Primary care rep (GP territory): 7 to 9 calls per day
- Specialty rep (hospital/specialist territory): 5 to 7 calls per day
- Hospital-only rep (large teaching hospitals): 4 to 6 calls per day
The difference between a theoretical 10 calls per day and a realistic 8 calls per day, multiplied across a 50-rep field force and 200 working days, equals 20,000 calls. That's not a rounding error. And that's the difference between sizing at 48 reps and sizing at 60.
The Workload-Based Sizing Formula
Putting these inputs together:
This is essentially a sales capacity model applied to field force headcount. The same inputs used here, workload, productive days, and call rate, underpin the sales capacity planning frameworks used in non-pharma commercial operations. The logic transfers directly.
Required FTEs = Total Annual Calls Required / (Productive Call Days per Rep x Calls per Day)
Where: Total Annual Calls Required = (Number of A accounts x A frequency) + (Number of B accounts x B frequency) + (Number of C accounts x C frequency)
Example calculation:
Assume a primary care launch in a market with:
- 2,000 A accounts (12 calls/year target) = 24,000 calls
- 5,000 B accounts (6 calls/year target) = 30,000 calls
- 3,000 C accounts (2 calls/year target) = 6,000 calls
- Total calls required = 60,000
Rep capacity:
- 190 productive call days x 8 calls per day = 1,520 calls per rep per year
Required FTEs: 60,000 / 1,520 = 39.5 reps (round to 40)
Run this model across geographic zones to determine regional allocation, not just national headcount.
Territory Design Principles
Sizing tells you how many reps you need. Territory design tells you where they go and how the territory boundaries should be drawn.
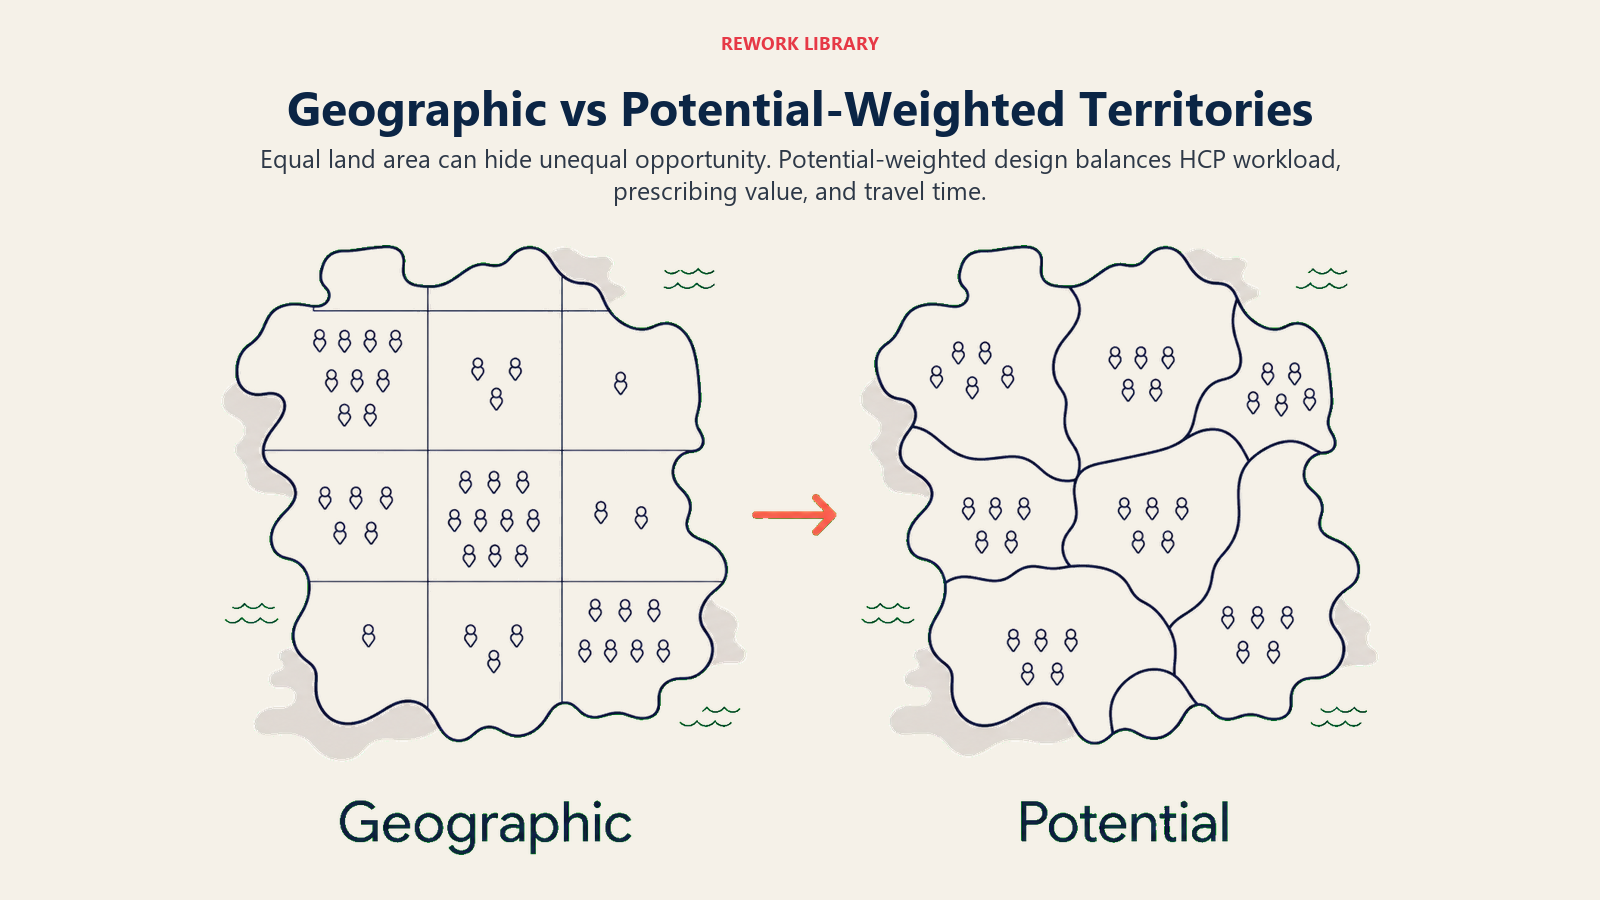
The Workload-Potential Balance framework is a territory design approach that draws boundaries based on prescribing potential and account universe size rather than geographic area, producing territories of unequal geographic size but roughly equal commercial opportunity and rep workload. This approach consistently outperforms geographic-balance design in markets where HCP density varies significantly between urban and rural regions.
Geographic Balance vs. Potential-Weighted Balance
The two common approaches produce very different territory shapes:
Geographic balance draws territories of roughly equal geographic size. This minimizes travel time variance between reps but creates gross inequality in potential: a rep covering a dense urban district with 800 A accounts and a rep covering a rural region with 200 A accounts are both "equal" geographically but wildly unequal in opportunity.
Potential-weighted balance draws territories based on call universe and prescribing potential. Territory shapes become unequal in size but equitable in workload and opportunity. The urban rep covers a smaller geographic footprint with higher call density. The rural rep covers a larger area with lower call density but similar total account potential.
Potential-weighted design is almost always preferable from a commercial efficiency standpoint. But it requires accurate, up-to-date account universe data and a willingness to redraw territories when the prescribing landscape shifts.
| Design Approach | Geographic Equity | Workload Equity | Data Requirement | Complexity |
|---|---|---|---|---|
| Geographic balance | High | Low | Minimal | Low |
| Potential-weighted | Low | High | High | Medium |
| Hybrid (geographic core, potential-adjusted) | Medium | Medium | Medium | Medium |
Urban/Rural Mix and Travel Time as a Sizing Variable
Travel time is a hidden rep capacity cost. A primary care rep in a dense urban district might cover 12 accounts in a 15km radius with 30 minutes total driving time. A rural rep covering the same number of accounts might drive 120km with 3 hours of travel time.
If your sizing model uses a flat "8 calls per day" assumption for both reps, the rural rep is structurally undercapacitated. Either reduce their call frequency targets to match reality, increase their territory-specific call rate assumption, or accept that their territory will systematically underperform.
Rural territories often require either reduced frequency targets for lower-tier accounts or hybrid models where a rep covers a geographic hub with satellite visits to rural nodes on rotation.
Minimum Viable Territory Size
Below a certain account density threshold, a full-time rep assignment isn't economically viable. The minimum viable territory should generate enough prescribing revenue (at expected market share and conversion rates) to cover the fully loaded cost of a rep plus a reasonable contribution margin.
A simple test: if the total prescribing potential in a territory, at a realistic market share ceiling, doesn't cover 2.5x the rep's fully loaded cost, the territory is either too small (and should be merged with an adjacent territory) or the product isn't commercially viable in that geography.
Product Portfolio Considerations
Single-brand specialist teams and multi-brand generalist field forces serve different commercial purposes and require different sizing logic.
Single-brand specialist teams are appropriate at launch in high-potential specialty markets where deep clinical knowledge and frequent specialist contact are the primary drivers of uptake. A cardiovascular biologic launch may warrant a 40-rep specialist team focused exclusively on cardiologists and nephrologists. These reps need deep clinical knowledge and will see fewer accounts at higher frequency. The PhRMA Code on HCP Interactions sets the voluntary industry standard governing how specialist reps should engage physicians, particularly around educational content and sample distribution.
Multi-brand generalist models work in primary care markets where the rep covers a breadth of products across a GP's prescribing decisions. The rep needs to be competent across a portfolio rather than expert in one product. Call frequency per brand is necessarily lower, but overall rep productivity can be maintained through higher daily call rates.
When to split specialist and primary care forces: If a product has both a specialist indication and a primary care continuation indication, a split model often outperforms a single hybrid force. The specialist force drives initiation; the primary care force drives adherence and continuation. These are different selling conversations, different customer types, and benefit from different training and capability profiles.
Lifecycle Deployment Model
The right field force size for launch is almost never the right field force size at year five. Lifecycle stage is the most important variable in long-term sizing strategy.
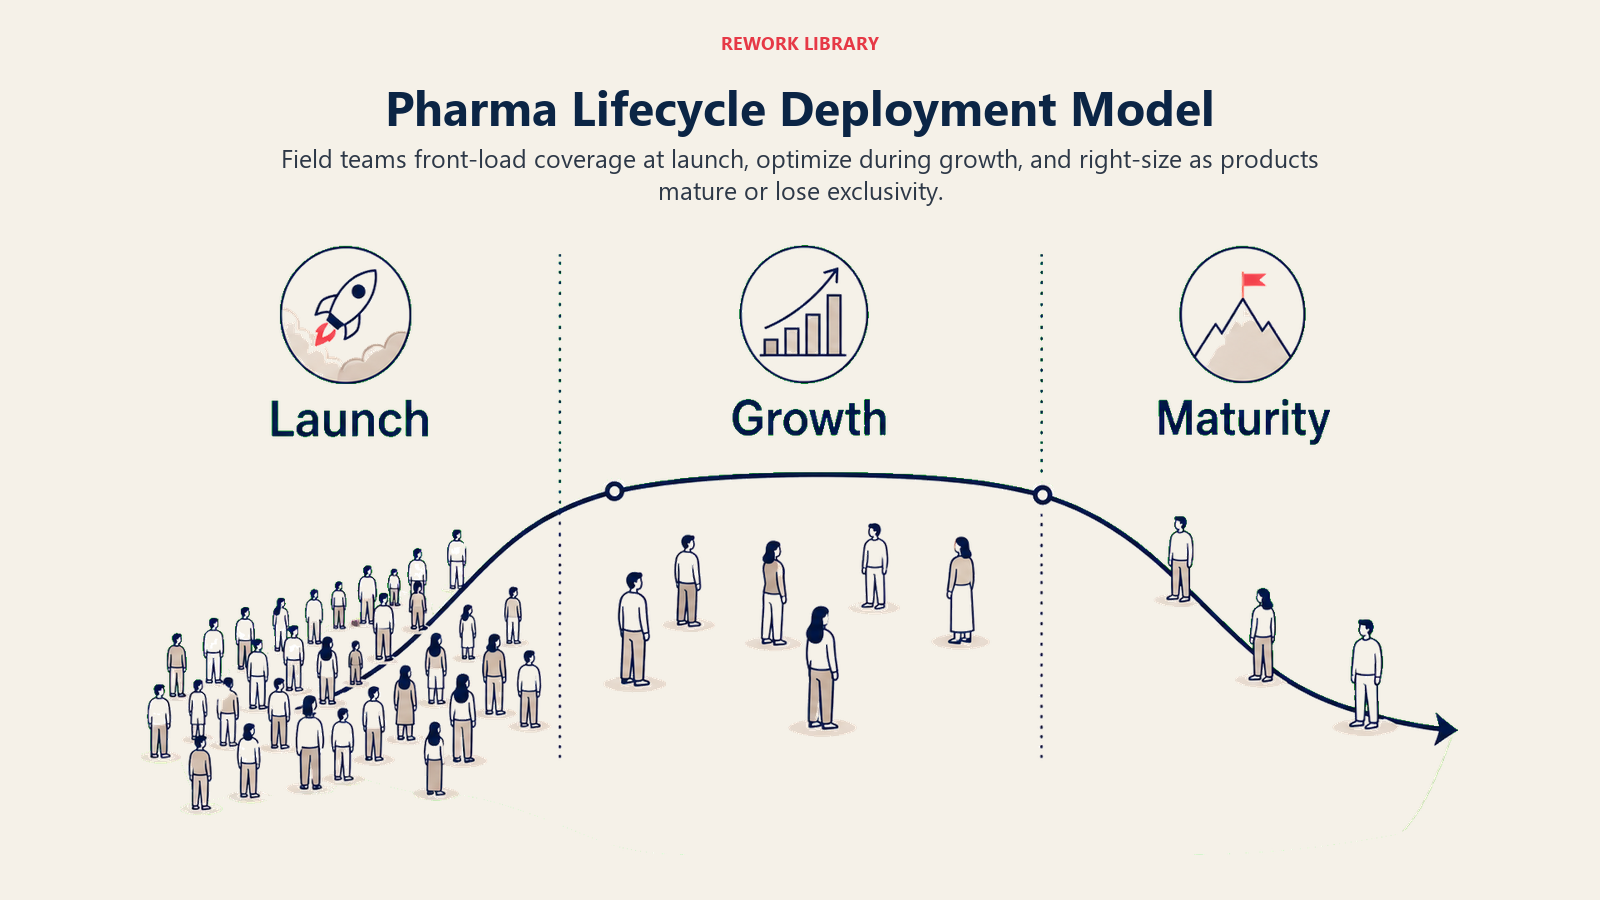
Launch Phase (Years 0 to 2)
Front-load. The prescriber habit formation window at launch is narrow. Physicians form early opinions about a new product based on initial clinical experience, and those opinions are sticky. A field force that's 20% larger than steady-state optimal during launch can establish prescribing habits that generate market share gains worth multiples of the additional headcount cost.
Launch rep count should be calibrated to:
- Target coverage of 80 to 90% of A accounts within the first 90 days (a commonly recommended goal in launch planning frameworks, though exact thresholds depend on territory density and access)
- Achieve first-contact detail with all A and B accounts within the first six months
- Maintain launch frequency targets (typically 20 to 30% higher than steady-state)
Growth Phase (Years 2 to 5)
Optimize for efficiency. You now have prescribing data to validate which accounts are converting, which aren't, and where additional call investment produces incremental script volume. Use this data to refine the account universe, adjust frequency targets, and identify where territory boundaries should shift.
This phase often allows a 10 to 15% reduction from peak launch headcount while maintaining or growing market share, as the force concentrates on proven prescribers rather than the broad-coverage launch approach.
Maturity/LOE Phase (Years 5 and Beyond)
Right-size aggressively. As a product approaches loss of exclusivity (LOE), the marginal value of additional rep visits declines sharply. Generic entry will eventually commoditize the market regardless of rep effort. The commercial question shifts from "how do we grow share?" to "how do we protect share at minimum cost?"
LOE right-sizing typically involves reducing toward 40 to 60% of peak launch headcount (a planning range commercial directors commonly apply, with the exact level depending on competitive intensity and portfolio transition plans), redeploying high-performing reps to new launch products, and using hybrid or contract rep models to maintain minimum coverage cost-effectively.
Deployment Techniques
Zip-Code Clustering
Start with the smallest geographic unit available (zip code, postal sector, or census tract) and cluster adjacent units until each cluster has roughly equal call universe and travel efficiency. Territory boundaries should follow natural geographic features (rivers, major roads, administrative boundaries) where possible to reduce rep confusion about who covers which account.
Workload Equalizer Tools
Commercial sales operations teams use workload equalizer software (Veeva Network, JAVELIN, Salesforce Maps, or dedicated territory design platforms) to run thousands of territory boundary permutations simultaneously and surface configurations that balance workload, potential, and geographic compactness. Manual territory design in a 50-rep field force is a multi-week project. Territory design software reduces it to days with demonstrably better output. McKinsey's pharma commercial analytics research shows that advanced analytics and predictive modeling approaches to commercial spend optimization consistently outperform static geographic or uniform-treatment models for HCP engagement.
GIS-Based Territory Mapping
Geographic Information System mapping overlays account potential data onto road network and travel time data to identify routing inefficiencies, coverage gaps, and optimal call sequencing zones. GIS outputs feed directly into rep-level beat and route journey planning tools.
Re-Sizing Triggers
Field force size shouldn't wait for the annual planning cycle to be reviewed. Certain market events demand an immediate sizing response:
New product launches: If you're launching a second brand from the same rep team, do the workload math before assuming the existing team can absorb the additional call burden. Adding a new brand to a fully loaded field force doesn't add capacity. It dilutes attention across both brands.
LOE events: A competitor's major product losing patent protection changes the competitive call landscape overnight. The calculus of rep investment vs. expected share retention changes materially.
Competitor entry: A new entrant in your category will often launch with an aggressive field force. If your sizing model was calibrated for a two-player market and a third entrant launches with a 60-rep team, your account coverage strategy needs to respond.
M&A restructuring: Post-merger field force integration almost always produces geographic overlap and redundant headcount. Territory rationalization after a merger is one of the highest-return commercial operations activities a sales ops team can undertake. Rep onboarding and coaching frameworks need to be harmonized across merged field forces to maintain capability standards.
Cost Modeling
No sizing decision is complete without a cost model. Commercial directors need to understand the full economics of their field force before adding or removing headcount.
Fully Loaded Rep Cost
| Cost Component | Typical Range (annual, USD) |
|---|---|
| Base salary | $75,000 to $120,000 |
| Bonus at target | $20,000 to $40,000 |
| Benefits (30% of base) | $22,500 to $36,000 |
| Car allowance or fleet | $8,000 to $15,000 |
| Sample budget | $5,000 to $25,000 |
| Training and development | $3,000 to $8,000 |
| CRM and tech tools | $3,000 to $6,000 |
| Management overhead allocation | $10,000 to $20,000 |
| Total fully loaded | $146,500 to $270,000 |
Use $180,000 to $200,000 as a working assumption for a primary care rep in most developed markets. Specialty reps run 20 to 30% higher due to salary competitiveness in clinical talent markets.
Cost per Call
Cost per call = Fully loaded rep cost / Annual productive calls per rep
At $190,000 fully loaded and 1,500 productive calls per year: $127 per call
This figure should inform call frequency decisions. A C-account generating 2 scripts per year at average net revenue of $80 per script generates $160 in revenue from which $127 in call cost must be recovered. That's not a viable economics model if it takes more than 1 or 2 calls per year. The cost-per-call calculation also has direct implications for how you set sales quotas: territories where the economics can't support a full rep headcount should carry adjusted expectations, not the same quota as high-density urban assignments.
Break-Even Prescription Volume
Break-even prescriptions = Fully loaded rep cost / Net revenue per prescription
This tells you how many additional prescriptions a rep needs to generate (above the no-rep baseline) to cover their cost. If the break-even volume is higher than the realistically achievable incremental volume in the territory, the territory isn't commercially viable as a full-time assignment.
Territory analytics and sales dashboards should make these economics visible to commercial leadership on an ongoing basis, not just at budget planning time.
Sizing Is a Living Decision
The most common field force sizing failure is treating the initial model as permanent. Markets shift, product lifecycles progress, competitors enter, formulary decisions change, and the call universe evolves. Field force size should evolve with it.
Best-practice commercial operations teams run a formal sizing review at three trigger points: the annual planning cycle, any major market event (launch, LOE, competitor entry), and whenever actual field productivity metrics deviate significantly from plan assumptions.
Sales ops and field force alignment is the operational infrastructure that makes dynamic resizing possible. Without a sales ops function that can run the model, update the territory maps, and redeploy reps quickly, commercial leadership is always working from outdated headcount assumptions.
The field force that wins isn't the largest. It's the one sized precisely for the market it's competing in, deployed intelligently across the accounts that drive the most value, and continuously recalibrated as the market changes.
Frequently Asked Questions about Field Force Sizing and Deployment
What is workload-based sizing and how is it different from revenue-based sizing?
Workload-based sizing calculates the number of reps needed to call on the target HCP universe at the desired frequency, using the formula: Required FTEs = Total Annual Calls Required divided by (Productive Call Days per Rep times Calls per Day). Revenue-based sizing works backward from revenue targets, asking how many reps would need to hit quota to meet the plan. Workload-based sizing is more accurate because it ties to the actual activity that drives prescribing behavior, while revenue-based sizing can mask territory coverage gaps.
How often should field force size be reviewed?
At a minimum, once annually during planning. But the more reliable standard is to trigger a sizing review at every material market event: a new product launch, a competitor entry, a major formulary change, or a loss of exclusivity event for a key product. Treating the initial sizing model as permanent is the most common field force sizing failure. Markets change, and a field force sized for a two-player market in year one will be systematically miscalibrated after a third entrant launches in year two.
When should a pharma company split specialist and primary care field forces?
When a product has both a specialist initiation indication and a primary care continuation indication, a split force almost always outperforms a hybrid model. The specialist force drives initiation with deep clinical conversations; the primary care force drives adherence and continuation with higher-frequency, shorter calls. These require different training profiles, different relationship approaches, and different daily call rate assumptions. Running one team for both conversations typically produces reps who are competent at neither.
What is the minimum viable territory threshold?
A full-time rep assignment is viable when the total prescribing potential in the territory, at a realistic market share ceiling, covers at least 2.5 times the rep's fully loaded annual cost. Below that threshold, the territory should either be merged with an adjacent one, covered by a part-time or contract model, or flagged as commercially non-viable. Running full-cost rep assignments against territories that can't support the economics dilutes both the rep and the margin.
How does product lifecycle stage affect field force size?
Launch phase typically warrants a field force 15 to 20% larger than steady-state optimal, because prescriber habit formation in the launch window is time-sensitive and early share gains compound. Growth phase allows a 10 to 15% reduction from peak launch headcount as the force concentrates on proven prescribers. By the maturity and loss-of-exclusivity phase, right-sizing toward 40 to 60% of peak launch headcount is often appropriate (a widely used planning range, not a universal rule), with high-performing reps redeployed to new launches.
What does a fully loaded rep cost model need to include?
Base salary, bonus at target, benefits (approximately 30% of base), car allowance or fleet, sample budget, training and development, CRM and technology tools, and management overhead allocation. Many organizations model salary and benefits only and undercount cost per call by 30 to 40%. See the fully loaded cost breakdown table above for the complete component list and working ranges.
Learn More
Build a complete field force commercial operating system:

Senior Implementation Consultant
On this page
- Core Sizing Inputs
- Input 1: Total Addressable Call Universe
- Input 2: Target Call Frequency per Segment
- Input 3: Productive Calls per Rep per Day and Working Days per Year
- The Workload-Based Sizing Formula
- Territory Design Principles
- Geographic Balance vs. Potential-Weighted Balance
- Urban/Rural Mix and Travel Time as a Sizing Variable
- Minimum Viable Territory Size
- Product Portfolio Considerations
- Lifecycle Deployment Model
- Launch Phase (Years 0 to 2)
- Growth Phase (Years 2 to 5)
- Maturity/LOE Phase (Years 5 and Beyond)
- Deployment Techniques
- Zip-Code Clustering
- Workload Equalizer Tools
- GIS-Based Territory Mapping
- Re-Sizing Triggers
- Cost Modeling
- Fully Loaded Rep Cost
- Cost per Call
- Break-Even Prescription Volume
- Sizing Is a Living Decision
- Learn More