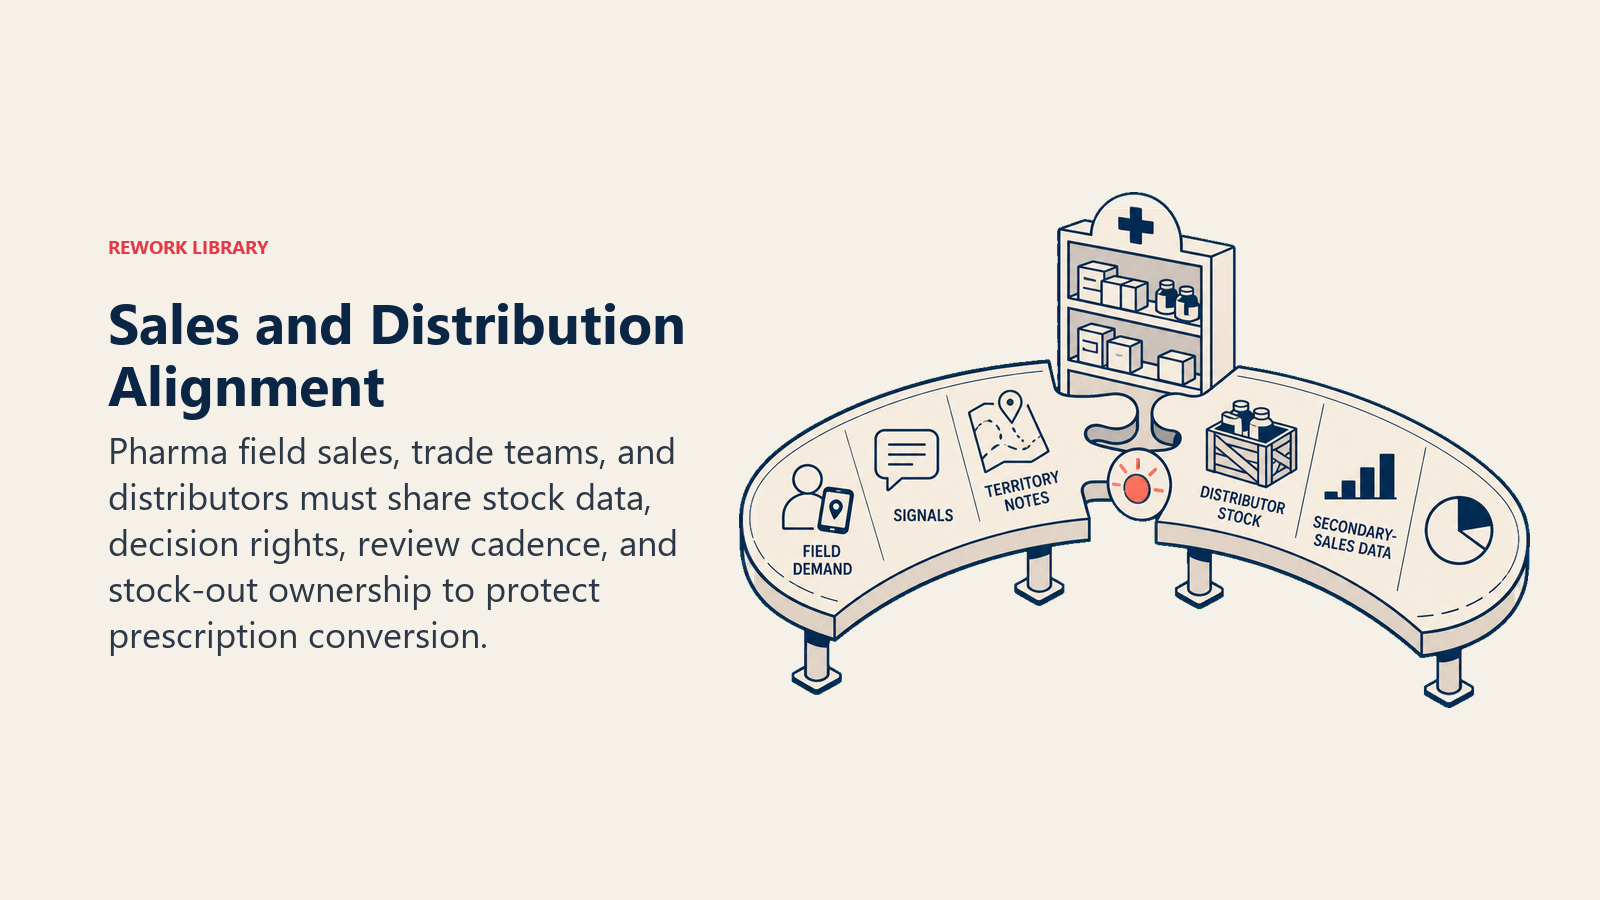
Sales and Distribution Trade Alignment in Pharma: Turning Field Orders into Shelf Availability
Turn this article into takeaways for your work.
Each assistant summarizes the article only for you and suggests best practices for your work.
The rep closes the pharmacist on a new SKU. The territory manager logs it as a win. Three days later, the patient arrives with a prescription, and the shelf is empty. The distributor delivered late, the pharmacist switched the patient to a competitor, and the prescription was gone.
That sequence plays out across pharma territories every week. Not because of weak selling and not because of supply constraints. Because field sales and distribution operate as separate functions with separate cadences and no shared picture of in-market availability. Alignment between these two functions isn't a logistics improvement. It's a revenue protection measure, and the companies that treat it as one consistently convert more prescriptions into actual sales.
How Pharma Distribution Chains Work and Where Field Sales Fits In
Most pharma distribution in emerging and mid-scale markets follows a three-tier model. Understanding where breakdowns happen requires seeing each tier clearly.
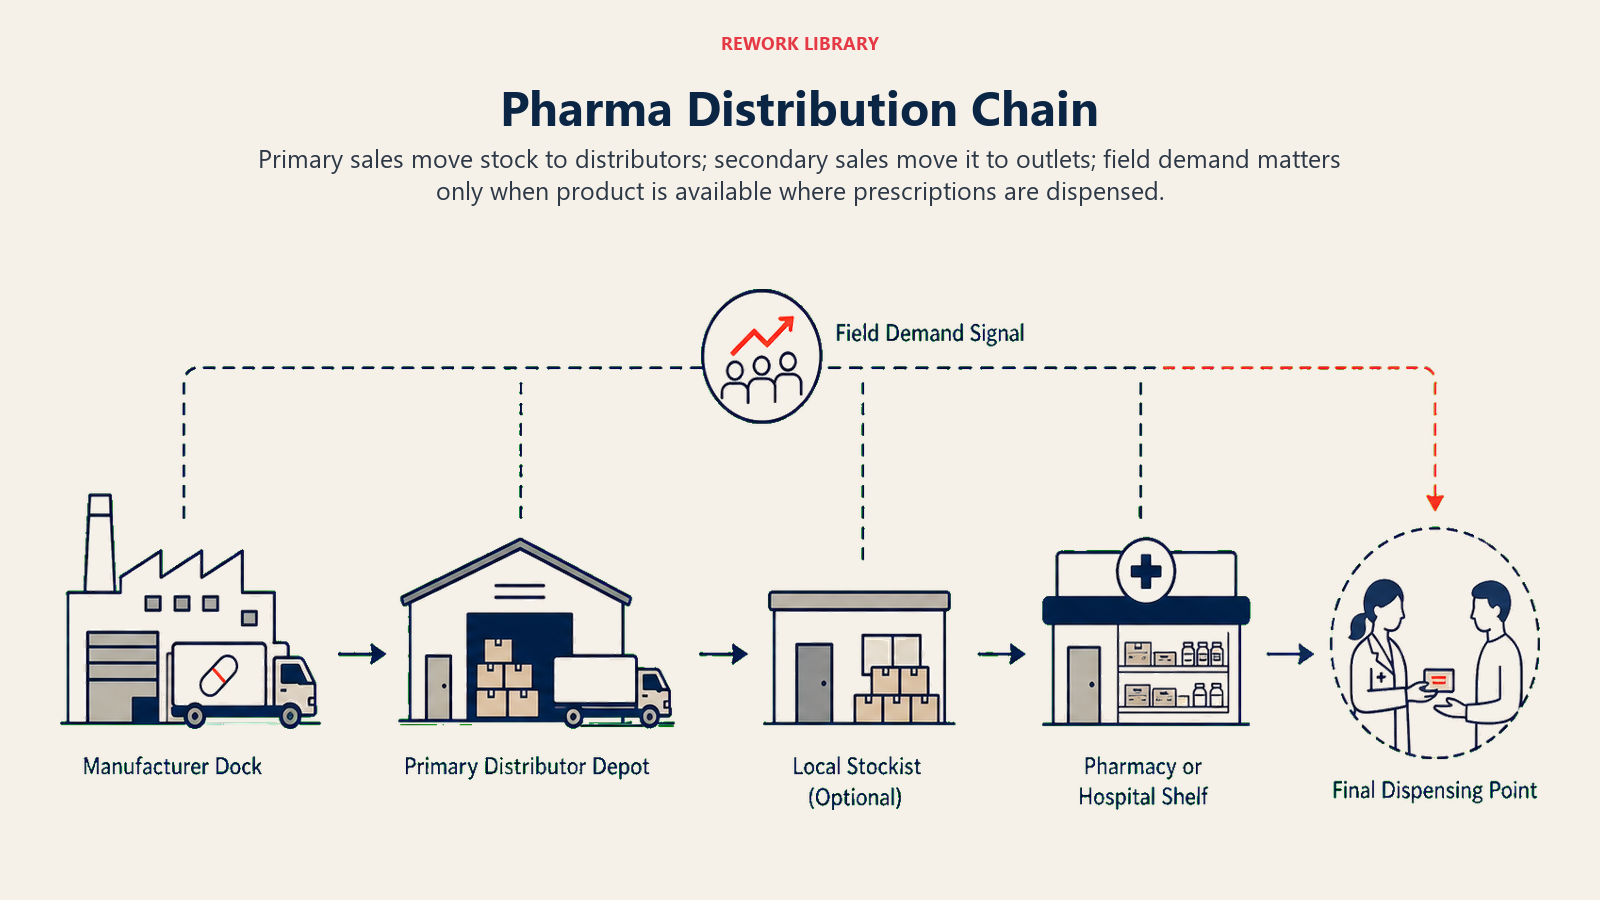
Tier 1 (Primary): Manufacturer to stockist or distributor. The manufacturer ships product to a network of regional distributors or C&F (carrying and forwarding) agents. This is the primary sales layer. Volume moves here on purchase orders, credit terms, and margin agreements. The field force often has no direct visibility into this tier's inventory position unless sales ops provides it.
Tier 2 (Secondary): Distributor to pharmacy or retail outlet. The distributor's own sales team pushes product into pharmacies, drug stores, and sometimes hospital pharmacies. This is secondary sales territory. The field rep may or may not overlap with the distributor salesperson when visiting the same outlet. Often they operate independently, and that independence creates gaps.
Tier 3 (Tertiary): Pharmacy to patient. When a patient presents a prescription, the pharmacy dispenses. Stock-outs at this level create immediate brand switching. Unlike other consumer categories, patient loyalty in an acute episode is low: if your product isn't available, the pharmacist prescribes the closest substitute. A systematic review in Human Resources for Health found that distribution problems are the most frequently cited cause of medicine stockouts, with patients commonly switching providers or accepting alternative treatments when their prescribed medicine is unavailable.
The field rep sits between tiers 2 and 3. They generate demand signals at the outlet level through detailing, pharmacy engagement, and sample drops. But they rarely have authority over what the distributor has in its warehouse or when it will run the next delivery route. That mismatch between where the rep operates and where supply decisions are made is the structural source of most distribution alignment failures.
Key Facts: Pharma Distribution Alignment
- Distribution problems are the most frequently cited cause of medicine stock-outs, with patients commonly switching to alternative treatments when their prescribed medicine is unavailable (Human Resources for Health / PMC9287964).
- ASPE analysis of US prescription drug supply chains describes the manufacturer-to-wholesaler/distributor primary layer as the structural starting point through which product availability downstream is set, see Prescription Drug Supply Chains overview.
- Research on specialty pharmaceutical distribution channels found that manufacturers who restrict secondary market flow and work through authorized distributor networks gain better traceability over what stock reaches pharmacies compared to open wholesale channels, though the study focused on US specialty/biologic products rather than general pharma distribution (PMC3411231).
Why Does Distribution Alignment Fail? Four Recurring Breakdowns
Most pharma commercial leaders know that distribution and field sales aren't perfectly coordinated. Fewer have mapped the specific failure modes precisely enough to fix them.
| Failure Mode | How It Appears | Commercial Impact |
|---|---|---|
| Orders without stock visibility | Rep pushes pharmacy orders without checking distributor's current stock position | Distributor can't fulfill; pharmacy stock-out follows |
| Distributor deprioritization | Distributor shifts focus to higher-margin SKUs during peak season without alerting territory manager | Your SKU disappears from secondary routes |
| Lagging secondary sales data | Secondary sales reports arrive 2 weeks late | Stock-out already happened before ops can respond |
| Trade negotiation without field input | Trade team sets distributor margins without territory demand data | Wrong incentives, wrong coverage priority |
The Three-Tier Pull-Through Model is the named framework for how demand signals and supply responses interact across these three layers: Tier 1 (primary, manufacturer to distributor) is where volume is planned; Tier 2 (secondary, distributor to outlet) is where availability is determined; Tier 3 (tertiary, pharmacy to patient) is where revenue is realized. Field reps operate at the seam of Tiers 2 and 3. Alignment means connecting demand signals at Tier 3 back through Tier 2 so supply decisions at Tier 1 stay ahead of patient demand.
Breakdown 1: Reps push orders without checking distributor stock. When a rep secures a pharmacy order, the instinct is to log the win and move on. But if the territory's distributor is already sitting at low inventory on that SKU, the pharmacy order triggers a paper trail with no product behind it. The rep doesn't know this because they don't have access to the distributor's stock position in real time. The pharmacy manager, expecting delivery in 48 hours, gets nothing. Frustration follows, and the next time a patient asks, the pharmacist recommends what's in stock.
Breakdown 2: Distributor deprioritizes your SKU. Distributors manage dozens of manufacturer relationships simultaneously. During high-season demand (monsoon, holiday, peak prescription months), they prioritize SKUs with better margin, faster turnover, or higher-value rebate structures. If your product sits in the middle of their margin table, it gets deprioritized without anyone notifying your territory manager. The rep keeps calling on pharmacies; deliveries keep lagging.
Breakdown 3: Secondary sales data arrives too late. Primary sales data (what the manufacturer shipped to the distributor) is available almost immediately. Secondary sales data (what the distributor sold into outlets) typically lags two to four weeks in markets where manual reconciliation is standard. By the time the ops team identifies a coverage drop, the pharmacies have been out of stock for ten days. The patient pool for that prescription wave has already been lost.
Breakdown 4: Trade team negotiates without field input. Margin agreements, credit terms, and incentive structures for distributors are set by the trade team, often without a seat at the table for territory managers. But the field has the richest picture of where demand is concentrating, which outlets need more aggressive coverage, and where the distributor is underperforming. Without that input, trade deals get structured for volume at the national level rather than availability at the territory level.
The Alignment Operating Model: Roles, Data, and Cadence
Fixing these breakdowns requires three things operating together: clear role ownership, shared data, and a regular cadence where both functions sit in the same conversation.
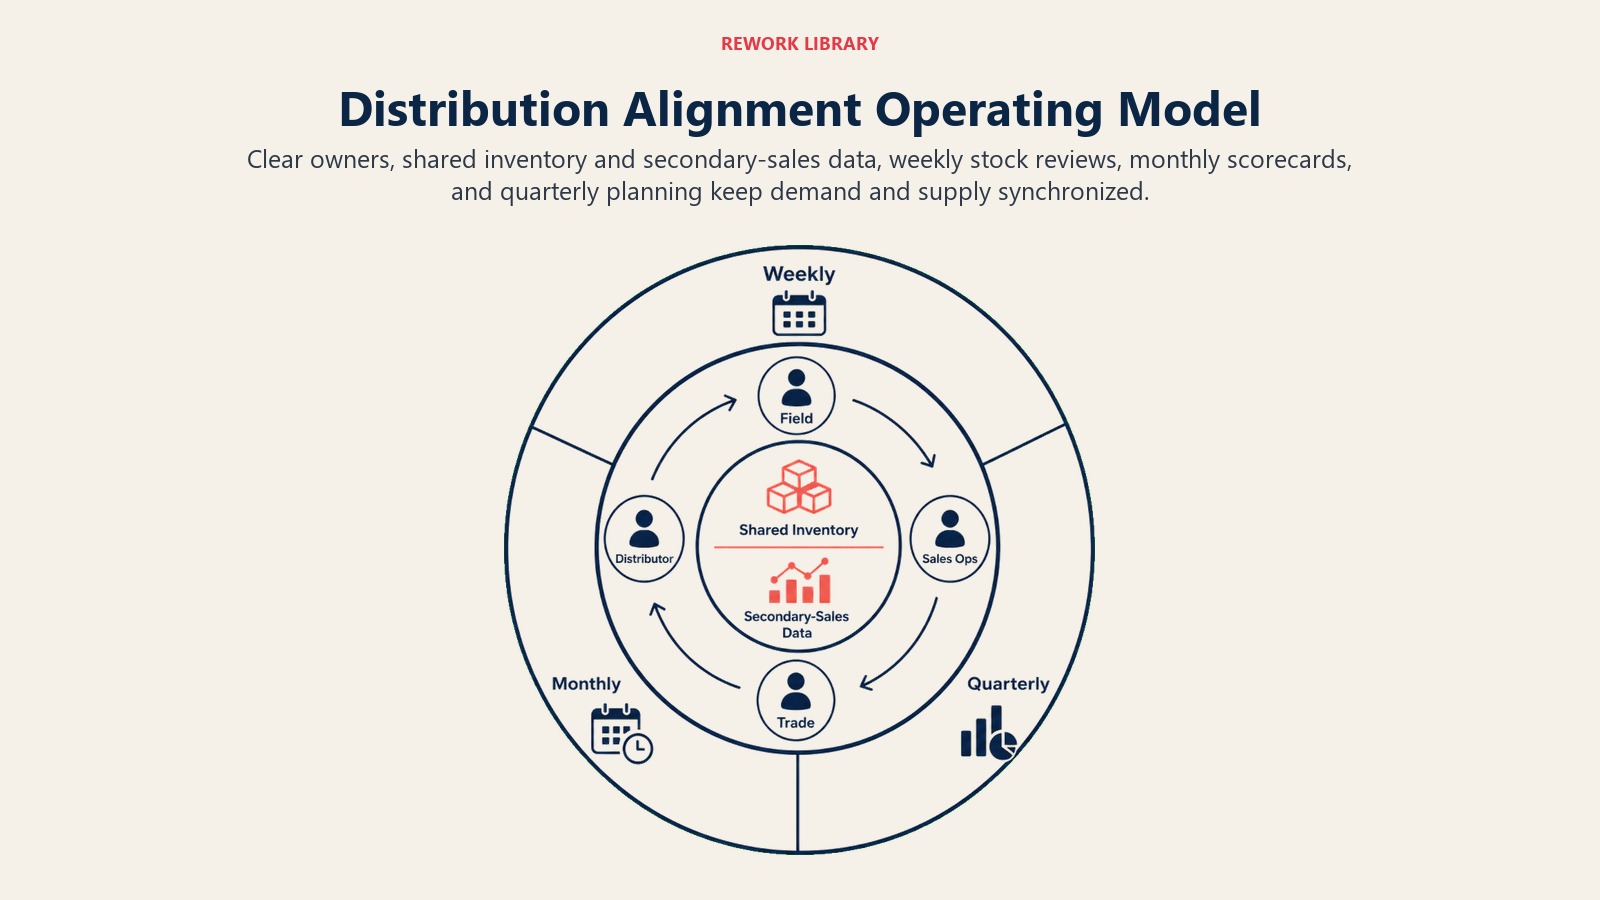
Role Clarity
The field rep's role in distribution alignment is to act as the demand signal at the outlet level. Concretely, that means: capturing pharmacy order requests accurately, reporting coverage gaps immediately (not at the weekly meeting), visiting distributor salespeople on joint route rides when possible, and flagging anomalies like competitor promotions or outlet closures that affect pull-through. The rep is not logistics. But the rep is the earliest warning system.
The trade and distribution team's role is to manage the distributor relationship: credit terms, return policies, margin structures, delivery route scheduling, and inventory financing. They also own the distributor scorecard and are accountable for fill rate and coverage. Without field input, they're managing the relationship blind to what's actually happening at the outlet level.
Sales ops bridges the two. They receive primary sales data, reconcile it against secondary sales when it arrives, and publish a coverage and availability report that both the field and trade teams can act on. They also manage the workflow for reporting stock-outs and triggering emergency re-supply. See the full picture of what this function contributes in Pharma CRM and Sales Force Automation.
Shared Cadence
Without a regular meeting structure, field and distribution alignment reverts to ad hoc escalations, which means problems surface only when they've already damaged revenue.
A functional cadence includes:
- Daily: Rep logs pharmacy orders and flags any stock complaints directly into the CRM or a distributor-linked tool. Anomalies escalate immediately, not at the week's end.
- Weekly: Territory manager and distributor representative hold a joint stock review. Distributor shares current inventory position by SKU; territory manager shares pharmacy demand signals from the week. Gaps get assigned to action owners.
- Monthly: Trade team, territory managers, and ops meet to review the distributor scorecard, adjust credit terms or incentives where needed, and update route priorities based on territory-level demand data.
- Quarterly: Full commercial review including distributor performance against scorecard targets, territory coverage analysis, and a forward-looking demand plan by SKU.
This rhythm isn't bureaucracy. It's the infrastructure that prevents stock-outs from becoming the default operating condition.
Distributor Scorecard: What to Measure in Joint Reviews
A distributor scorecard without field validation becomes a compliance exercise. The best scorecards measure what actually predicts patient availability. The targets below are recommended operational standards that companies commonly build into their distributor contracts; your actual thresholds should reflect your category, geography, and distributor tier.
| Metric | Definition | Recommended Operational Target | Owner |
|---|---|---|---|
| Fill rate | Orders fulfilled vs. orders placed by pharmacies | 95%+ within agreed lead time (set in your distributor contract) | Distributor |
| Order turnaround time | Hours from pharmacy order to confirmed delivery | Under 48 hours in core markets (adjust by geography) | Distributor |
| Secondary sales coverage | Number of active outlets sold vs. assigned outlet universe | 85%+ monthly (calibrate to territory density) | Distributor + field |
| Return rate | Returned product as a percentage of total secondary sales | Under 3% (benchmark against your category norms) | Trade team |
| Out-of-stock incident rate | Number of rep-reported stock-outs per territory per month | Target zero in A-class outlets | Field + distributor |
| Demand signal lag | Days from rep-flagged order to distributor stock update | Under 24 hours | Sales ops |
The field rep's contribution to this scorecard is the out-of-stock incident rate and demand signal lag. These are the two metrics that can't be measured accurately without field input, and they're the most consequential ones for patient availability. The protocol for what happens when those numbers go red is what the next section covers.
Stock-Out Response Protocol: Who Does What When a Territory Goes Dark
When a rep identifies that a key pharmacy or cluster of pharmacies is out of stock, the response needs to be fast and coordinated. Most companies have a protocol in theory. In practice, the rep sends an email, the email goes to a distribution inbox, and the pharmacist runs out of product for four more days.
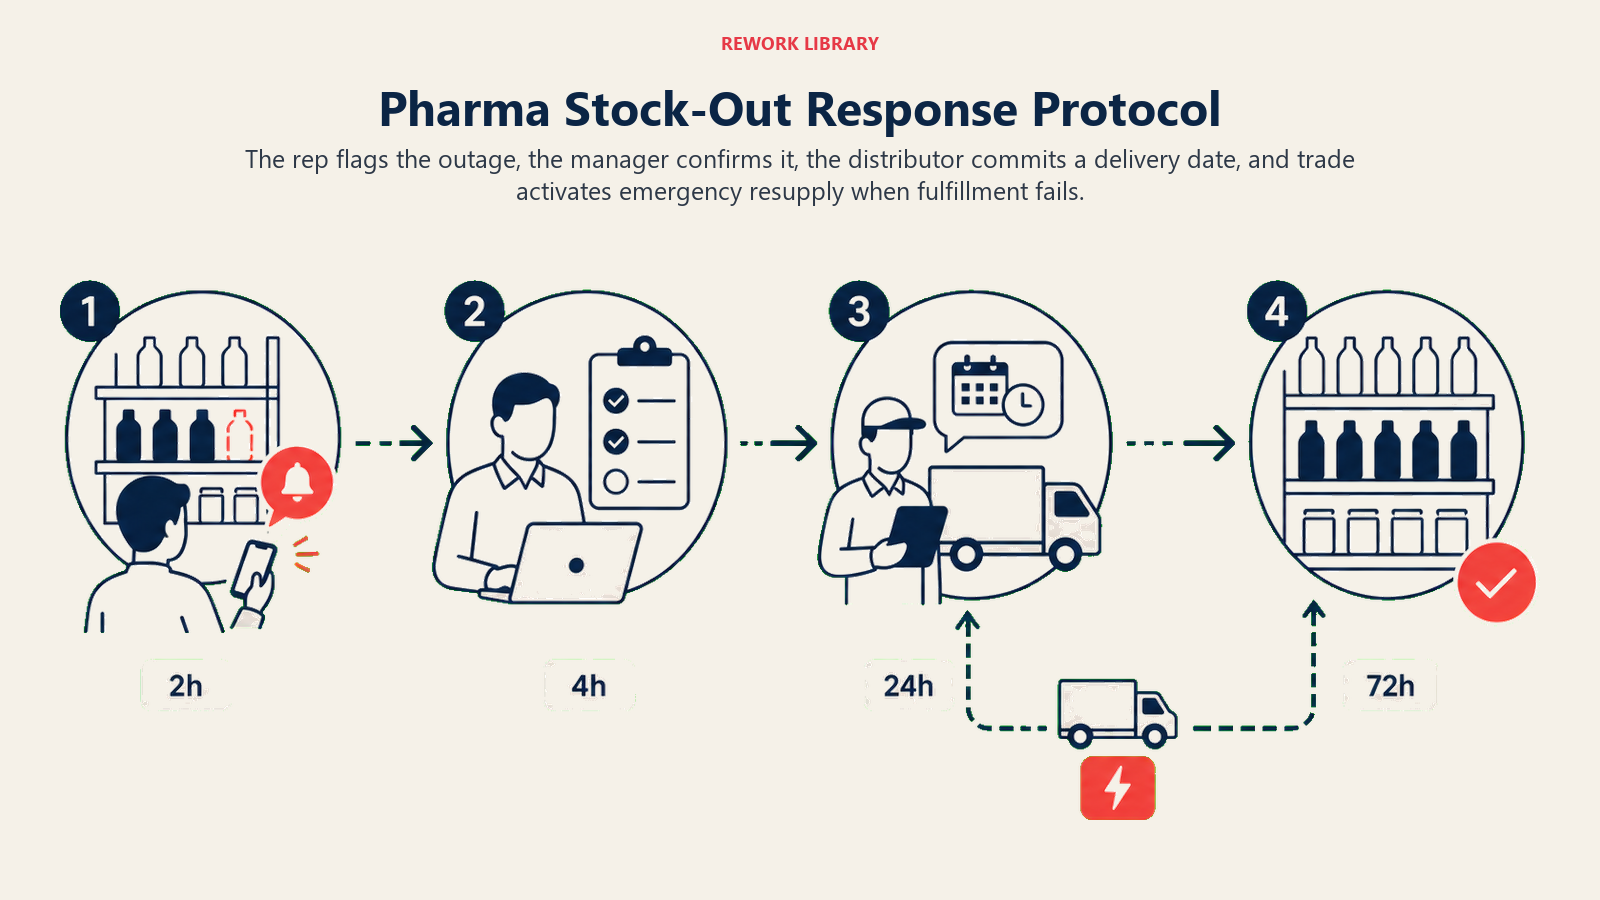
A working stock-out response protocol assigns ownership to each step and sets time limits. The timelines below are a best-practice design that commercial teams commonly adopt; adapt them to your market's logistics infrastructure and distributor capability.
Step 1: Rep flags the stock-out. Within 2 hours of identifying the gap, the rep logs the outlet name, SKU, and estimated sales impact in the CRM. This is non-negotiable. Verbal reports that don't enter the system don't get tracked and don't trigger action.
Step 2: Territory manager confirms and escalates. Within 4 hours, the territory manager verifies the report and contacts the distributor representative directly (not via email alone) to confirm current stock position and nearest available inventory.
Step 3: Distributor acknowledges and commits to delivery timeline. The distributor has 24 hours to confirm a delivery date for the affected outlets. If they can't fulfill within 48 hours from the original flag, the territory manager escalates to the trade team.
Step 4: Trade team activates emergency re-supply if needed. If the distributor can't fulfill, the trade team identifies the nearest alternative distributor or C&F agent, arranges a transfer order, and confirms delivery within 72 hours total from the original flag.
Step 5: Rep returns to outlet post-delivery. Once stock is confirmed restored, the rep visits the pharmacy within 24 hours to rebuild the relationship, check secondary placement, and confirm product is actually on the shelf, not in the storeroom.
Step 6: Ops logs the incident for the monthly review. Every stock-out gets recorded in the monthly distributor review. Patterns across incidents trigger scorecard adjustments and, if persistent, distributor contract reviews.
The protocol works because every step is logged and owned. But a protocol only prevents future stock-outs if it feeds back into the secondary sales data loop, which is the hardest gap to close in most pharma commercial operations.
Closing the Secondary Sales Data Gap
Secondary sales data is the most actionable dataset in pharma distribution: it tells you not just what shipped to the distributor, but what actually reached the outlet. The problem is timeliness. In markets relying on manual distributor reconciliation, the data arrives weeks after the fact. Research on specialty pharmaceutical distribution channels (focused on US biologics and specialty drugs) shows that manufacturers who restrict secondary market flow and work through authorized distributor networks gain better traceability into what stock reaches pharmacies and in what timeframe compared to open wholesale channels.
Closing this gap requires either technology (distributor portal integration, POS feeds from larger pharmacy chains) or process (weekly distributor stock-and-sales uploads as a condition of margin support). Neither is trivial, but both are achievable. The data quality problem here is structurally similar to the CRM hygiene challenges that plague any commercial ops team: stale, incomplete inputs produce forecasts you can't trust. The CRM Data Hygiene framework describes the discipline of defining ownership, enforcing entry standards, and building feedback loops that apply equally well to distributor data contracts.
In the interim, field-reported demand signals are your early-warning substitute. If reps are accurately capturing pharmacy order requests and stock complaints daily, sales ops can triangulate a rough picture of secondary sales coverage without waiting for the formal report. This isn't perfect measurement. But it's faster than a two-week lag, and faster is what prevents stock-outs from persisting.
That data gap is also why distribution alignment doesn't end at the pharmacy shelf.
Distribution Alignment Connects to the Full Pull-Through Chain
Distribution alignment doesn't end at the pharmacy shelf. When a prescription is written and the product isn't available, the pull-through chain breaks regardless of how strong the prescriber relationship is. This is why distribution alignment belongs in the same commercial conversation as prescription generation.
The field rep who generates the prescription and the distribution system that puts product on the shelf are two ends of the same revenue event. If either end fails, the sale doesn't happen. Leaders who manage these functions as separate operations will always have unexplained revenue leakage. Leaders who manage them as co-owners of in-market availability will find their conversion rates and their patient outcomes both improve.
Frequently Asked Questions about Sales and Distribution Trade Alignment in Pharma
What is the difference between primary and secondary sales in pharma distribution?
Primary sales is the volume the manufacturer invoices to its distributor network. Secondary sales is what the distributor then sells out to pharmacies, drug stores, and hospitals. Primary sales hits the P&L immediately but doesn't confirm that product is available to patients. Secondary sales is the commercial reality check: it shows whether distributor stock is actually flowing to the shelf.
Why do field reps often lack visibility into distributor stock levels?
Field reps operate at the outlet end of the chain, generating demand at pharmacies and hospitals. Distributors manage their own inventory systems, and in most markets there is no automatic data feed connecting distributor stock positions to the field force's CRM or SFA tool. Unless sales ops actively bridges that gap with a shared data feed or a regular joint review cadence, reps have no way to check stock before they push pharmacy orders.
What is a reasonable stock-out response timeline for pharma field teams?
A widely adopted best-practice design runs as follows: the rep flags the stock-out within two hours of identifying it; the territory manager confirms and contacts the distributor within four hours; the distributor commits to a delivery date within 24 hours; emergency re-supply from the trade team activates within 72 hours total if the distributor cannot fulfill. These timelines should be calibrated to your market's logistics infrastructure, urban markets with dense distributor networks can often hit these; rural or low-infrastructure markets may need adjusted benchmarks. Every step should be logged in the CRM so the incident feeds the monthly distributor scorecard review.
How often should field teams and distributors hold joint stock reviews?
Weekly is the operational standard for active markets. Territory managers and distributor representatives review current inventory position by SKU and compare it to pharmacy demand signals from the rep's call cycle. Monthly reviews at the trade team level add the scorecard and credit term dimension. Quarterly reviews cover forward demand planning and distributor contract performance.
What metrics belong on a distributor scorecard?
The core scorecard tracks fill rate, order-to-delivery lead time, secondary-sales coverage (percentage of active outlets reached), out-of-stock incident rate by territory, return rate, and demand signal lag. Commonly adopted targets for well-managed markets include 95%+ fill rate and under 48 hours order turnaround in core urban areas, but companies calibrate these against their category and geography. The last two metrics depend on field-reported data, so they can't be measured accurately without rep input during the review cycle.
What causes secondary sales data to lag two to four weeks?
In markets where distributors submit reports manually, a sales agent typically compiles the month's transactions at period end, sends a spreadsheet or PDF to the manufacturer, and ops reconciles it against primary records. Each handoff adds days. The lag compounds when distributors operate multiple depots with separate record-keeping. Van sales apps that capture secondary transactions at the point of delivery eliminate most of this lag by generating real-time records.
Can a pharma company align field sales and distribution without new technology?
Yes, the process foundation matters more than the tools. Defining a joint review cadence, documenting a stock-out response protocol, building a distributor scorecard, and requiring weekly anomaly flags through the existing CRM captures most of the alignment benefit. Technology (distributor portals, van sales apps, SFA inventory modules) accelerates the data flow but does not replace the operating model.
Learn More

Senior Implementation Consultant
On this page
- How Pharma Distribution Chains Work and Where Field Sales Fits In
- Why Does Distribution Alignment Fail? Four Recurring Breakdowns
- The Alignment Operating Model: Roles, Data, and Cadence
- Role Clarity
- Shared Cadence
- Distributor Scorecard: What to Measure in Joint Reviews
- Stock-Out Response Protocol: Who Does What When a Territory Goes Dark
- Closing the Secondary Sales Data Gap
- Distribution Alignment Connects to the Full Pull-Through Chain
- Learn More