RevOps Metrics: The Full-Funnel KPIs Revenue Leaders Should Track
Most revenue dashboards have too many charts and too few decisions.
They show lead volume, meetings booked, pipeline created, win rate, forecast, churn, campaign ROI, activity counts, rep performance, source attribution, and customer health. The problem is not lack of data. The problem is that no one can tell which number should change the operating plan this week.
RevOps metrics should do three things:
- Show where the revenue system is healthy or breaking.
- Connect one team's work to another team's outcome.
- Make the next operating decision clearer.
If a metric does not help leaders decide what to fix, inspect, fund, stop, or standardize, it is probably dashboard decoration.
This guide builds on What Is Revenue Operations? and the Revenue Operations Framework. RevOps metrics are the measurement layer of the full revenue operating system.
Key operating facts
- RevOps metrics should reduce argument, reveal bottlenecks, and make the next operating decision clearer.
- The strongest metrics connect teams and stages: source to pipeline, SQL to opportunity, forecast to actual, onboarding to renewal, health to expansion.
- Metrics need definitions, owners, source systems, caveats, and review cadence before they become executive reporting.
- Do not overemphasize activity metrics unless they connect to conversion, quality, velocity, or revenue outcomes.
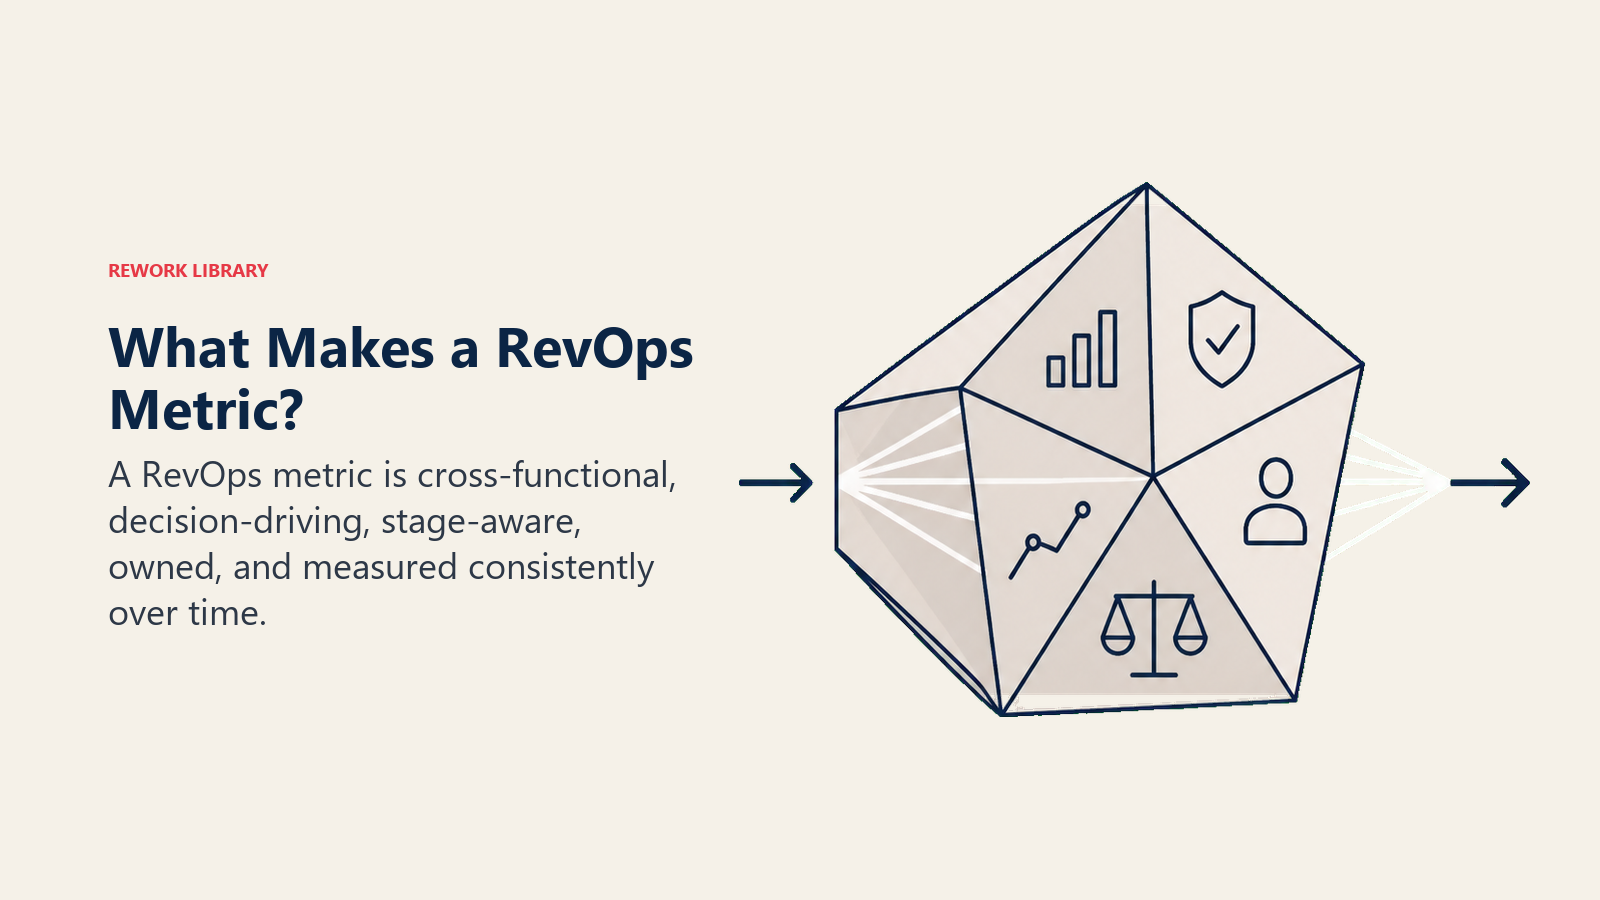
What makes a metric a RevOps metric
A RevOps metric is not just any number in the CRM.
Turn this article into takeaways for your work.
Each assistant summarizes the article only for you and suggests best practices for your work.
It should have five traits:
| Trait | Meaning | Bad version | Better version |
|---|---|---|---|
| Cross-functional | The metric connects at least two teams or stages | Leads created | Lead-to-opportunity conversion by source |
| Decision-driving | A change in the metric leads to an operating decision | Email opens | Meetings, replies, opportunities, revenue |
| Stage-aware | It is tied to a clear lifecycle stage | Pipeline | Pipeline by stage and close period |
| Owned | One team or role is accountable for improving it | Conversion rate | MQL-to-SQL conversion owned by marketing, SDR, and RevOps |
| Consistent | It is tracked the same way over time | Custom spreadsheet number | Governed dashboard metric |
Lead volume alone is not a strong RevOps metric. Lead-to-opportunity conversion by source and segment is stronger because marketing, sales, and RevOps can act on it.
Win rate alone is useful, but not enough. Win rate by segment, source, rep ramp cohort, and deal size can reveal whether the problem is qualification, messaging, sales execution, pricing, or customer fit.
Forecast accuracy is a RevOps metric because it depends on sales discipline, stage definitions, CRM data quality, inspection cadence, and finance planning. CIO Dive summarized Gartner research showing that less than half of sales leaders and sellers had high confidence in forecast accuracy, which is why forecast quality should be treated as a system metric, not only a sales manager judgment call.
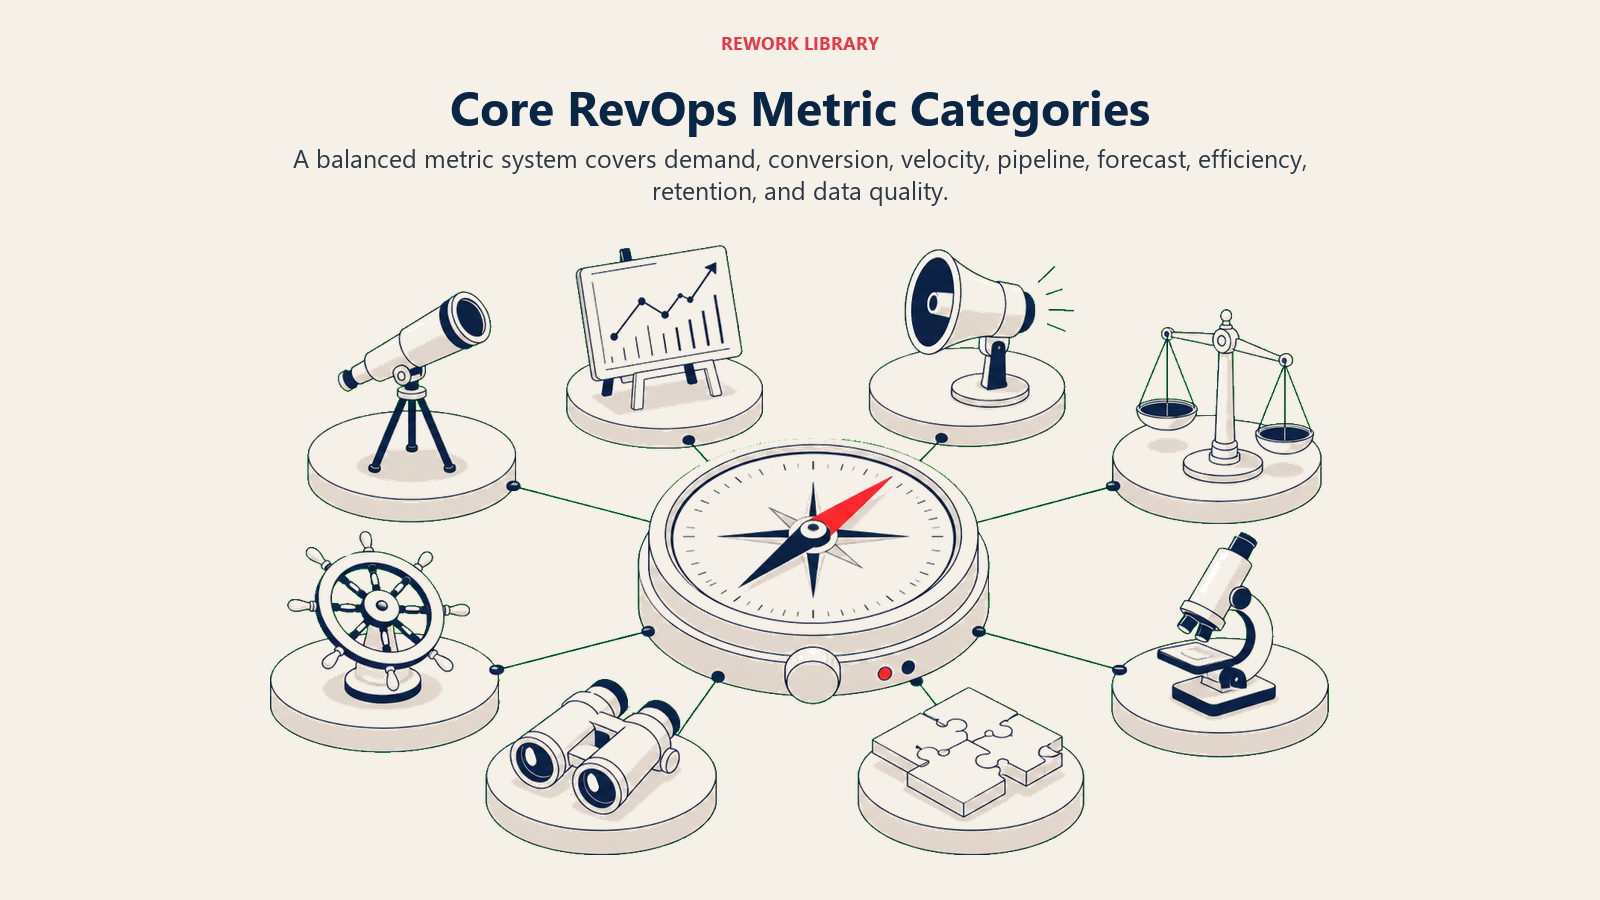
Core RevOps metric categories
| Category | What it tells you | Example metrics |
|---|---|---|
| Demand quality | Whether demand matches the ICP | Visitor-to-lead, lead-to-MQL, source conversion |
| Conversion | Where the funnel leaks | MQL-to-SQL, SQL-to-opportunity, opportunity-to-win |
| Velocity | How fast revenue moves | Lead response time, sales cycle length, pipeline velocity |
| Pipeline quality | Whether pipeline can support the plan | Pipeline coverage, stage aging, stale opportunity rate |
| Forecast quality | Whether leaders can trust future revenue | Forecast accuracy, commit conversion, slipped deals |
| Revenue efficiency | How much growth costs | CAC payback, sales efficiency, revenue per rep |
| Retention and expansion | Whether customers grow after closing | GRR, NRR, renewal rate, expansion pipeline |
| Data quality | Whether the system can be trusted | Field completeness, duplicate rate, CRM freshness |
The best RevOps dashboards include one or two metrics from each category. They do not try to include every metric every team tracks.
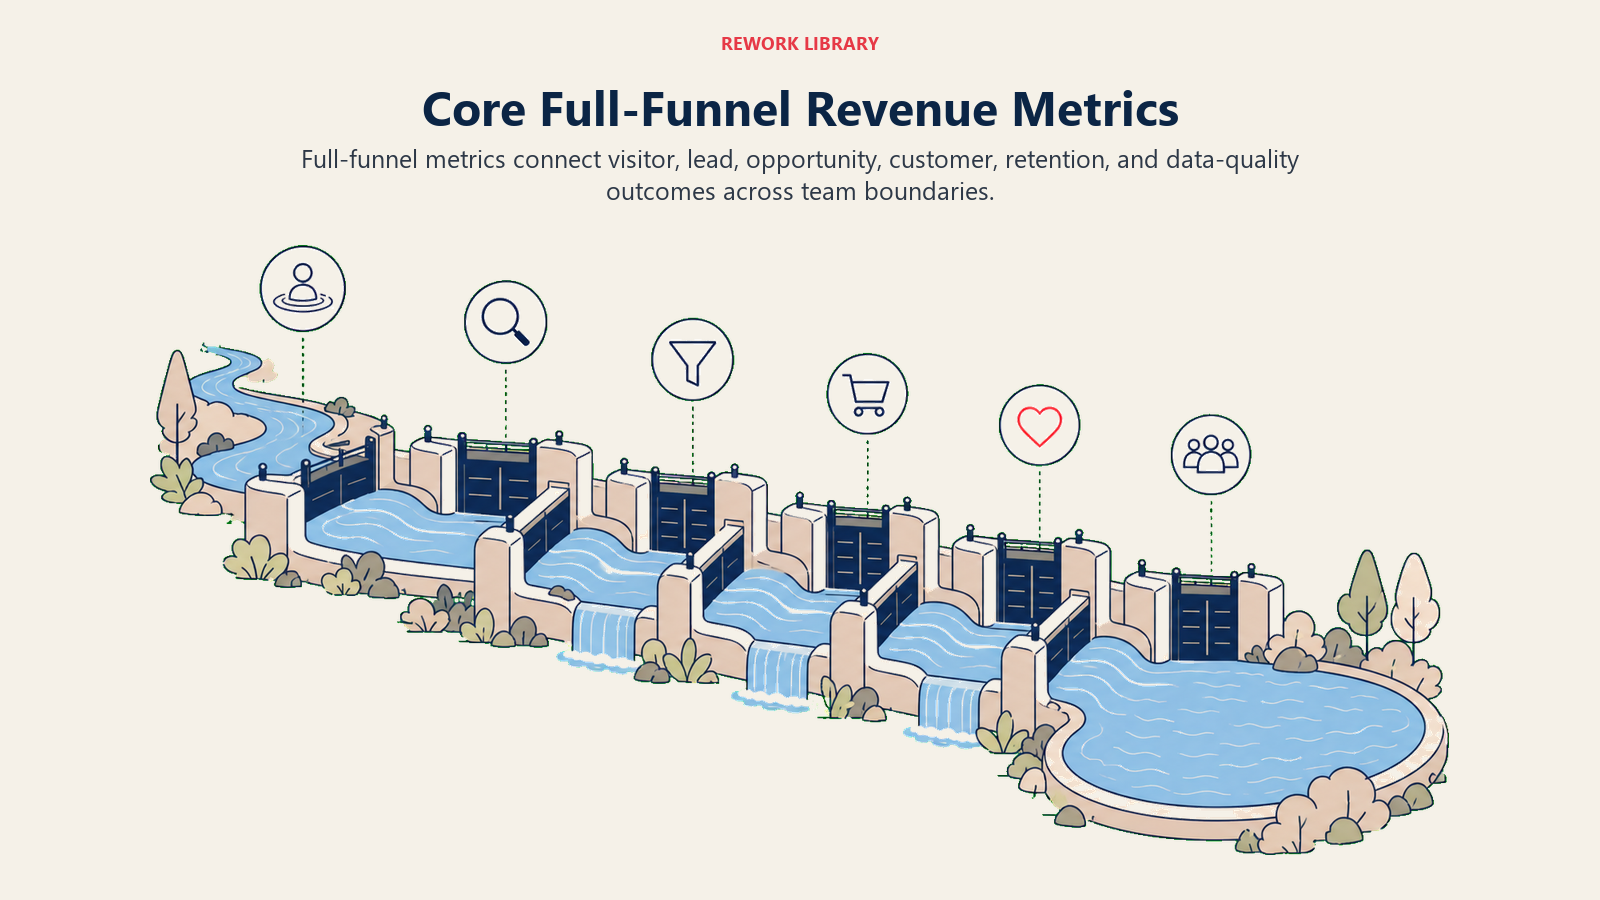
Core full-funnel metrics
| Metric | Owner | Why it matters |
|---|---|---|
| Visitor to lead | Marketing | Shows whether traffic converts into identifiable demand |
| Lead to MQL | Marketing and RevOps | Shows whether lead capture matches qualification rules |
| MQL to SQL | Sales development and RevOps | Shows whether sales accepts marketing-qualified demand |
| SQL to opportunity | Sales | Shows whether qualified conversations become real pipeline |
| Opportunity to closed-won | Sales | Shows deal quality, execution, and fit |
| Sales cycle length | Sales and RevOps | Shows how long revenue takes to convert |
| Pipeline velocity | Sales and RevOps | Combines deal value, win rate, and cycle time |
| Pipeline coverage | Sales and finance | Shows whether open pipeline can support target |
| Forecast accuracy | Sales, RevOps, finance | Shows whether future revenue is inspectable |
| Net revenue retention | CS, finance, RevOps | Shows whether customers renew and expand |
| CRM completeness | RevOps | Shows whether the system has enough data to operate |
| Handoff completeness | RevOps and receiving team | Shows whether teams pass usable context downstream |
Some of these have deeper tactical playbooks. Start with Lead Conversion Rate, Lead Response Time, Pipeline Velocity, Forecast Accuracy, Net Revenue Retention, and the MQL to SQL Handoff Process.
Demand quality metrics
Demand quality metrics answer whether marketing is creating demand the revenue system can use.
The mistake is tracking volume without fit. A source that produces 1,000 leads and 5 opportunities may look successful in a marketing dashboard and weak in a revenue dashboard. RevOps should connect demand volume to acceptance, conversion, pipeline, and revenue.
Track:
- Visitor-to-lead conversion
- Lead-to-MQL conversion
- MQL acceptance rate
- MQL rejection reasons
- Source-to-opportunity conversion
- Source-to-closed-won conversion
This is where marketing and sales need shared definitions. A lead source is not good because it generates names. It is good if it generates qualified demand that converts at an acceptable cost and quality level.
Conversion metrics
Conversion metrics show where records stall or leak between stages.
The most useful conversion view is not only the aggregate funnel. It is conversion by source, segment, motion, product, and time period. If inbound demo requests convert well but content syndication leads do not, the operating decision is different from a generic "MQL conversion is down" diagnosis.
Use conversion metrics to ask:
- Are we attracting the right buyers?
- Are qualification rules too loose or too tight?
- Are reps accepting leads quickly enough?
- Are opportunities being created with enough evidence?
- Are win rates changing by segment or source?
Benchmarks can help orient expectations, but internal trend is usually more actionable. A company selling $5,000 ACV self-serve software and a company selling $150,000 enterprise software should not share one conversion target.
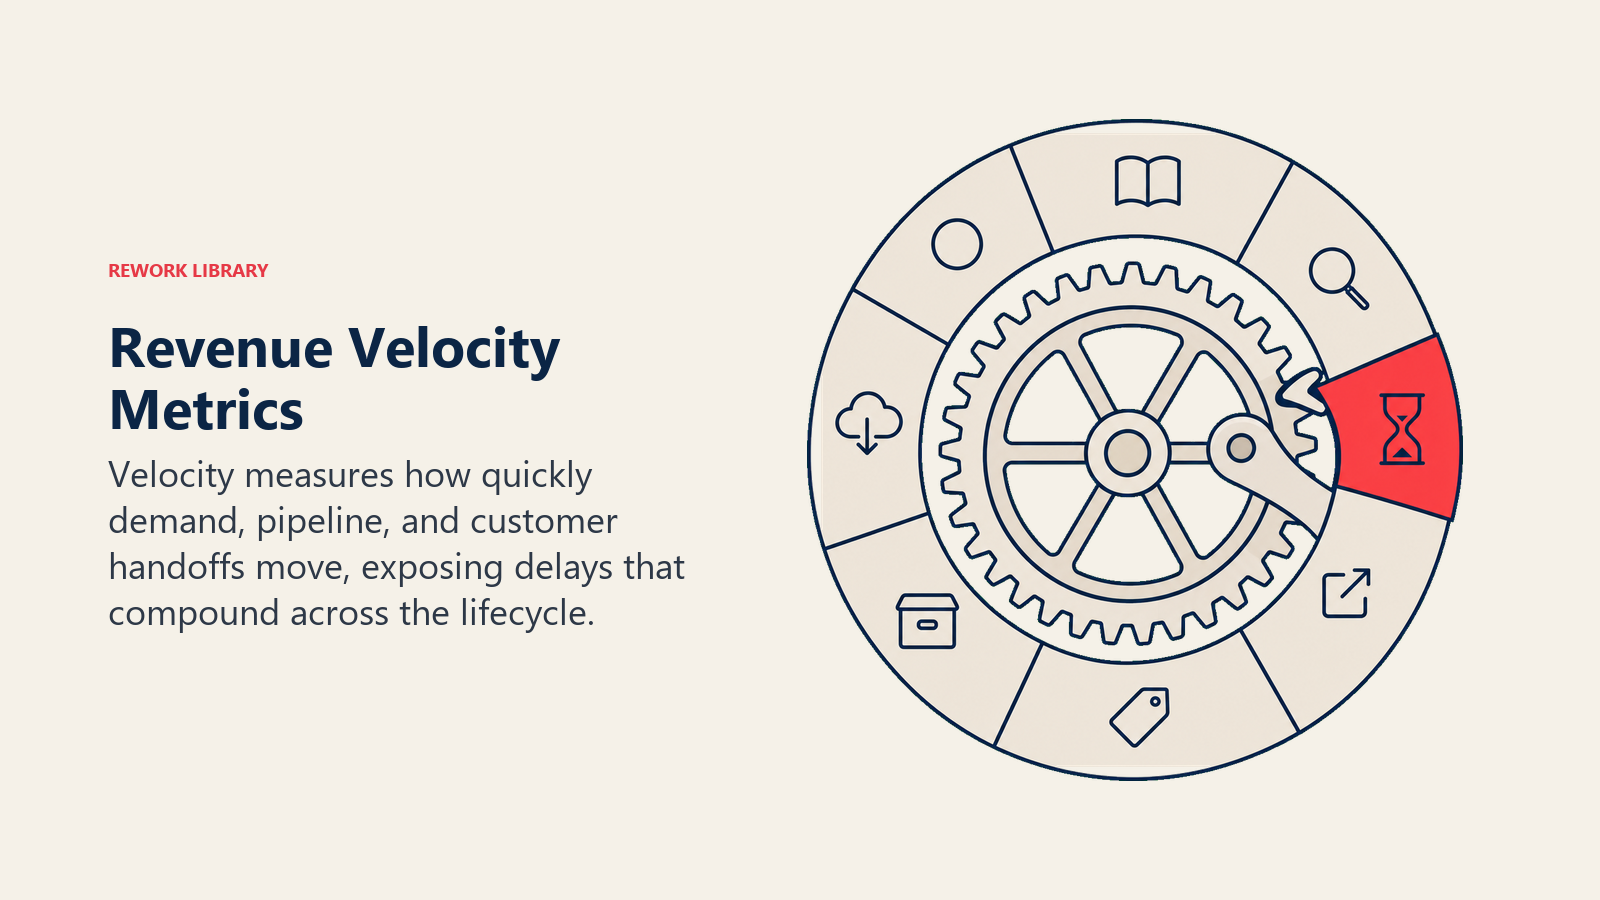
Velocity metrics
Velocity metrics show how quickly revenue moves.
The most common velocity metric is pipeline velocity, which combines number of opportunities, average deal size, win rate, and sales cycle length. But RevOps should also track the smaller timing metrics that explain velocity.
Track:
- Lead response time
- Time from lead to MQL
- Time from MQL to SQL
- Time from SQL to opportunity
- Stage aging
- Sales cycle length
- Time from closed-won to onboarding kickoff
Velocity matters because delays compound. A slow lead response hurts conversion. A slow opportunity stage hides risk. A slow closed-won handoff hurts onboarding. RevOps should treat time as a system health signal.
Salesforce's State of Sales research has found that reps spend most of their time on non-selling tasks. That is why RevOps metrics should include process friction, not only final outcomes.
Pipeline quality metrics
Pipeline quality asks whether the pipeline can support the plan.
The common mistake is treating all pipeline dollars equally. A $500,000 early-stage opportunity with no next meeting is not the same as a $500,000 late-stage opportunity with a signed mutual plan.
Track:
- Pipeline coverage ratio
- Stage aging
- Stale opportunity rate
- Close-date push rate
- Next-step completeness
- Opportunity amount changes
- Pipeline by source and segment
- Pipeline created vs target
Pipeline quality is where RevOps and sales management meet. Sales managers inspect deal reality. RevOps makes the inspection consistent and visible.
Forecast quality metrics
Forecast quality measures whether future revenue is inspectable.
Core metrics include:
- Forecast accuracy by period
- Commit conversion rate
- Best-case conversion rate
- Slipped deals
- Close-date push count
- Forecast change by week
- Stage-to-forecast consistency
Forecast quality is not only a sales performance metric. It reflects stage discipline, data quality, manager inspection, and finance alignment. That is why Pipeline vs Forecast should be understood before designing forecast dashboards.
Retention and expansion metrics
If RevOps stops at closed-won, the company is not running revenue operations. It is running acquisition operations.
Track:
- Gross revenue retention
- Net revenue retention
- Renewal forecast accuracy
- Expansion pipeline
- Customer health trend
- Churn reason by segment
- Closed-won handoff completeness
- Time to onboarded
Retention metrics matter for planning, but they also matter for acquisition quality. If a source creates customers that churn quickly, that source should not be celebrated only because it produces cheap pipeline.
Data quality metrics
Data quality is the quiet layer that makes every other metric credible.
Track:
- Required-field completeness
- Duplicate record rate
- Stale opportunity rate
- Records missing source
- Records missing owner
- Integration sync failures
- Dashboard fields with unclear owner
Do not treat data quality as admin cleanup. Treat it as revenue infrastructure. If the CRM is not trusted, the forecast, attribution, routing, and handoff reports will not be trusted either.
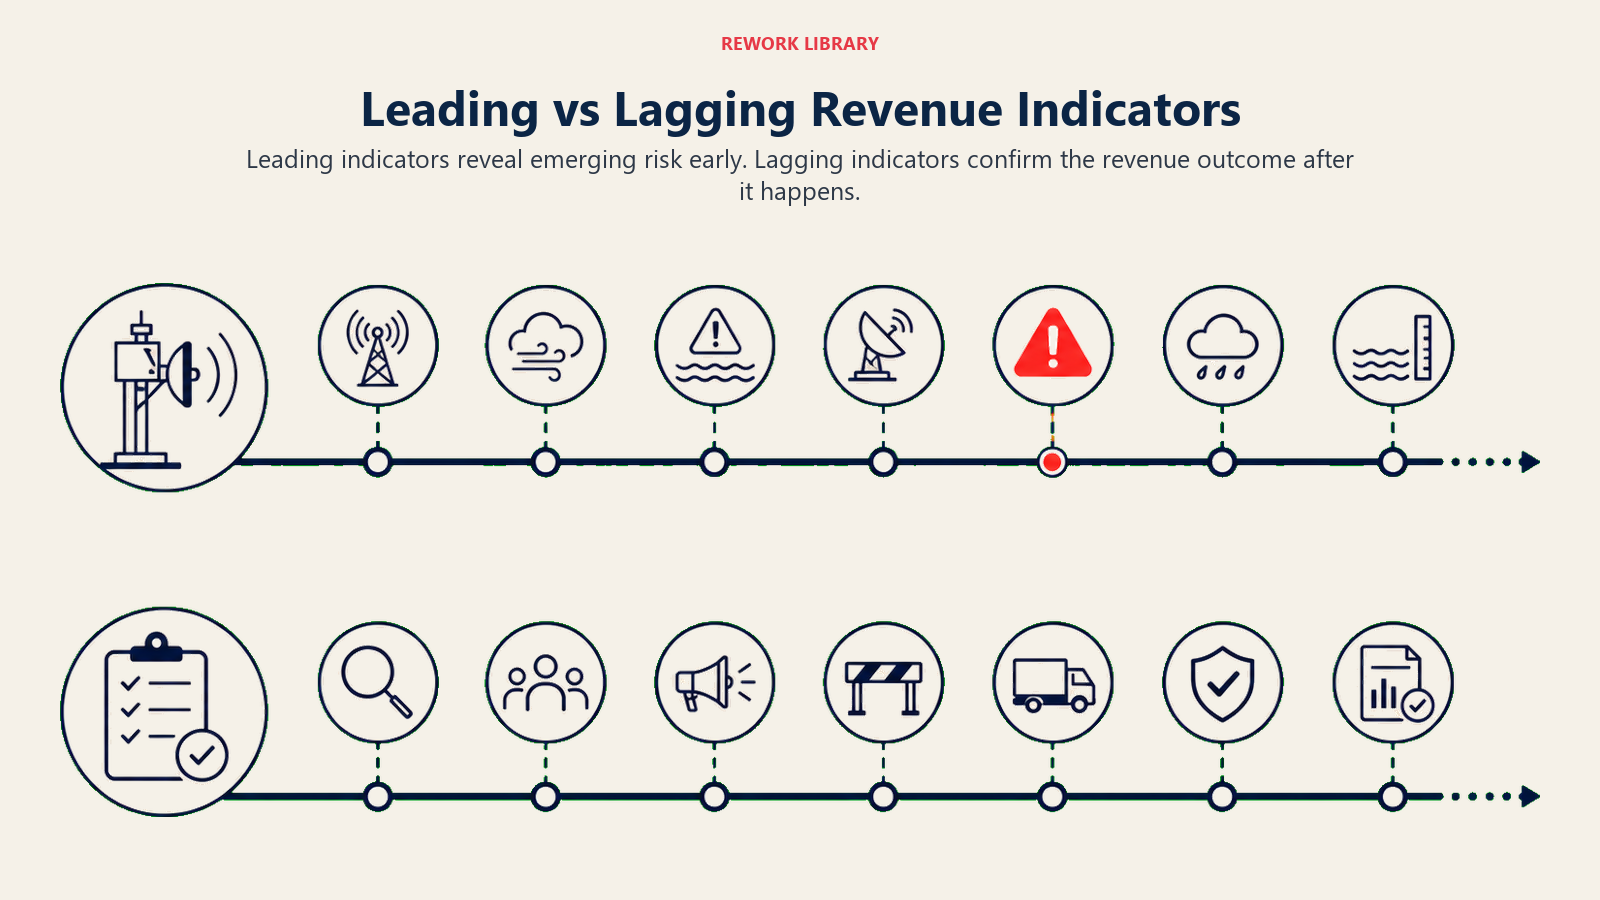
Leading vs lagging indicators
Lagging indicators report what already happened. Leading indicators help predict what is likely to happen.
| Leading indicator | Lagging indicator it informs |
|---|---|
| Lead response time | MQL-to-SQL conversion |
| Stage aging | Slipped deals and forecast miss |
| Meeting-to-opportunity rate | Pipeline creation |
| Pipeline coverage | Quota attainment |
| Field completeness | Forecast accuracy |
| Product usage in first 30 days | Renewal and expansion |
| Handoff completeness | Onboarding success and churn risk |
RevOps needs both. Lagging indicators keep leaders honest. Leading indicators help leaders intervene early.
A forecast miss at the end of the quarter is a lagging signal. Stage aging, stale next steps, and weak commit conversion are leading signals. A churn report is lagging. Poor onboarding completion, low usage, and unresolved implementation risk are leading signals.
Connect each metric to a decision
The fastest way to improve a RevOps dashboard is to add the decision next to the metric.
| Metric changes | First decision to consider | Likely owner |
|---|---|---|
| MQL-to-SQL conversion drops | Review source mix, scoring threshold, and rejection reasons | Marketing, SDR leader, RevOps |
| SQL-to-opportunity conversion drops | Inspect qualification criteria and discovery quality | Sales leader, RevOps |
| Stage aging rises | Tighten manager inspection and next-step rules | Sales managers, RevOps |
| Pipeline coverage falls | Decide whether the gap is demand, conversion, capacity, or timing | CRO, sales, marketing, finance |
| Forecast accuracy falls | Review commit criteria, close-date hygiene, and forecast cadence | Sales, finance, RevOps |
| Handoff completeness falls | Enforce closed-won required fields and CS acceptance rules | Sales, CS, RevOps |
| NRR falls | Review ICP, onboarding quality, adoption, renewal motion, and expansion coverage | CS, sales, RevOps |
| Required-field completeness falls | Reduce field burden or enforce stage gates | RevOps, systems owner |
This table keeps the dashboard from becoming passive. Every core metric should answer: if this number moves, who acts and what decision is now on the table?
Metric governance template
Every executive RevOps metric should have a short definition card.

| Field | Example |
|---|---|
| Metric name | MQL-to-SQL conversion |
| Definition | Percentage of MQLs accepted by sales as SQLs within the review period |
| Numerator | Accepted SQLs |
| Denominator | MQLs routed to sales |
| Source system | CRM lifecycle status plus routing timestamp |
| Owner | RevOps governs definition, SDR leader owns follow-up behavior |
| Review cadence | Monthly funnel review |
| Caveat | Exclude test records, partners, and imported legacy lists |
| Decision | If conversion drops, review source quality, scoring, SLA, and rejection reasons |
This may feel basic, but it prevents most reporting arguments. If a metric has no definition card, it is not ready for executive review.
Benchmark caution
Benchmarks are useful for orientation. They are dangerous as operating targets.
Visitor-to-lead conversion, MQL-to-SQL conversion, win rate, sales cycle length, and net revenue retention vary heavily by industry, ACV, sales motion, product maturity, market category, and customer segment. A high-volume SMB inbound funnel and an enterprise outbound funnel should not share the same benchmark target.
Use external benchmarks to ask better questions, not to replace internal trend lines.
For example, if your MQL-to-SQL conversion is lower than a published benchmark, the next question is not "how do we hit the benchmark?" It is "which sources, segments, or qualification rules are pulling conversion down, and are those leads part of our real ICP?"
Internal trend is usually more actionable than a generic industry average. If conversion improves from 18% to 25% after a scoring change, that matters even if another company's benchmark says 30%.
Dashboard design
Build three dashboard layers.
Executive dashboard
This dashboard should answer: are we on track, and where is the biggest revenue risk?
Keep it tight:
- Revenue plan vs actual
- Pipeline created by segment
- Pipeline coverage
- Forecast accuracy
- Win rate
- Sales cycle length
- Net revenue retention
- Expansion pipeline
- Data quality risk
RevOps working dashboard
This dashboard should answer: what should operators fix?
Include:
- Lead aging
- SLA breaches
- Routing failures
- Source-to-opportunity conversion
- MQL rejection reasons
- Stage aging
- Stale opportunities
- Missing required fields
- Duplicate records
- Handoff completeness
- Forecast slippage
- Renewal risk flags
Functional dashboards
These dashboards should help teams run their own execution.
Marketing needs campaign, source, and content performance. Sales needs territory, activity, pipeline, and rep performance. CS needs onboarding, adoption, renewal, and expansion views. RevOps should govern definitions, but each function still needs a working surface.
Metric ownership model
| Metric area | Primary owner | RevOps role |
|---|---|---|
| Demand quality | Marketing | Define lifecycle rules and source reporting |
| Lead response | Sales or SDR leader | Track SLA and escalation |
| MQL to SQL | Marketing, SDR, sales | Govern definition and rejection data |
| Pipeline creation | Sales | Validate stage and source data |
| Forecast quality | Sales and finance | Maintain forecast definitions and data quality |
| Retention | Customer success | Connect renewal data to revenue reporting |
| Expansion | CS and sales | Standardize expansion pipeline rules |
| Data completeness | RevOps | Own field rules, reporting, and cleanup process |
RevOps should not pretend to own every outcome. It owns the measurement system and the operating process. Functional leaders own performance in their lane.
Common mistakes
Tracking volume without quality. More leads do not help if the lead-to-opportunity rate is falling. More pipeline does not help if stage aging and close-date slippage are rising.
Using open rate as a revenue metric. Email open rate can help a campaign operator, but it is not a revenue metric. Treat clicks, replies, meetings, qualified opportunities, and sourced revenue as stronger signals.
Turning forecast calls into data cleanup meetings. If the forecast call is spent fixing close dates, required fields, and stages, the RevOps data quality process is failing upstream.
Reporting averages without segment context. Average win rate hides major differences by segment, source, ACV, and sales motion.
Adding metrics without decision rights. A metric with no owner becomes a complaint. Every core metric needs an owner and a review cadence.
A practical first RevOps dashboard
If you are starting from scratch, use these twelve metrics:
- Qualified pipeline created
- Pipeline coverage
- MQL-to-SQL conversion
- SQL-to-opportunity conversion
- Opportunity-to-win conversion
- Average sales cycle length
- Pipeline velocity
- Forecast accuracy
- Stale opportunity rate
- Net revenue retention
- Handoff completeness
- CRM required-field completeness
This is enough to find most operating bottlenecks without drowning the team in analysis.
Where Rework fits
A CRM or workflow platform like Rework can help RevOps maintain metric quality when lifecycle stages, ownership, tasks, handoffs, and required fields live in one governed workflow. The metric still depends on process discipline. The system makes that discipline easier to enforce and inspect.
Frequently Asked Questions about RevOps Metrics
What are RevOps metrics?
RevOps metrics are full-funnel KPIs that show how the revenue system performs across marketing, sales, customer success, finance, and systems. They measure conversion, velocity, pipeline quality, forecast quality, retention, expansion, and data quality.
What is the most important RevOps metric?
There is no single universal metric. Pipeline velocity, forecast accuracy, and net revenue retention are often among the most important because they connect multiple parts of the revenue system.
How many metrics should a RevOps dashboard have?
An executive dashboard should stay small, usually 8 to 12 metrics. A RevOps working dashboard can have more because it is used to diagnose issues, not present the entire business at once.
Should RevOps use benchmarks?
Yes, but carefully. Benchmarks help orient expectations. Internal trend lines by segment, source, and motion are usually more actionable than generic averages.
Learn more

Senior Operations & Growth Strategist
On this page
- What makes a metric a RevOps metric
- Core RevOps metric categories
- Core full-funnel metrics
- Demand quality metrics
- Conversion metrics
- Velocity metrics
- Pipeline quality metrics
- Forecast quality metrics
- Retention and expansion metrics
- Data quality metrics
- Leading vs lagging indicators
- Connect each metric to a decision
- Metric governance template
- Benchmark caution
- Dashboard design
- Executive dashboard
- RevOps working dashboard
- Functional dashboards
- Metric ownership model
- Common mistakes
- A practical first RevOps dashboard
- Where Rework fits
- Learn more