Pharma Supply Chain and Inventory Visibility: Closing the Blind Spots Between Factory and Shelf
Turn this article into takeaways for your work.
Each assistant summarizes the article only for you and suggests best practices for your work.
Call it the stock-out tax. Every prescription your medical reps generate that never fills because a pharmacy shelf was empty is a direct charge against your field force investment. You paid for the rep visit, the sample, the clinical education, the relationship. The doctor wrote the script. And then the supply chain absorbed the revenue.
Most pharma commercial teams know this problem exists. Fewer have solved it. The reason is almost always the same: they can see their primary sales (what they sold to distributors) but they're blind to secondary and tertiary sales (what moved from distributor to pharmacy, and from pharmacy to patient). Primary sales data tells you what left your warehouse. It tells you almost nothing about whether product is on a pharmacy shelf when a patient walks in.
Closing that visibility gap is one of the highest-leverage investments a pharma commercial leader can make. It's not an IT project. It's a revenue protection capability.
The Visibility Gap: Three Levels of Sales Data
Pharma companies typically operate across three levels of commercial data, and each level reveals a different picture of commercial performance.
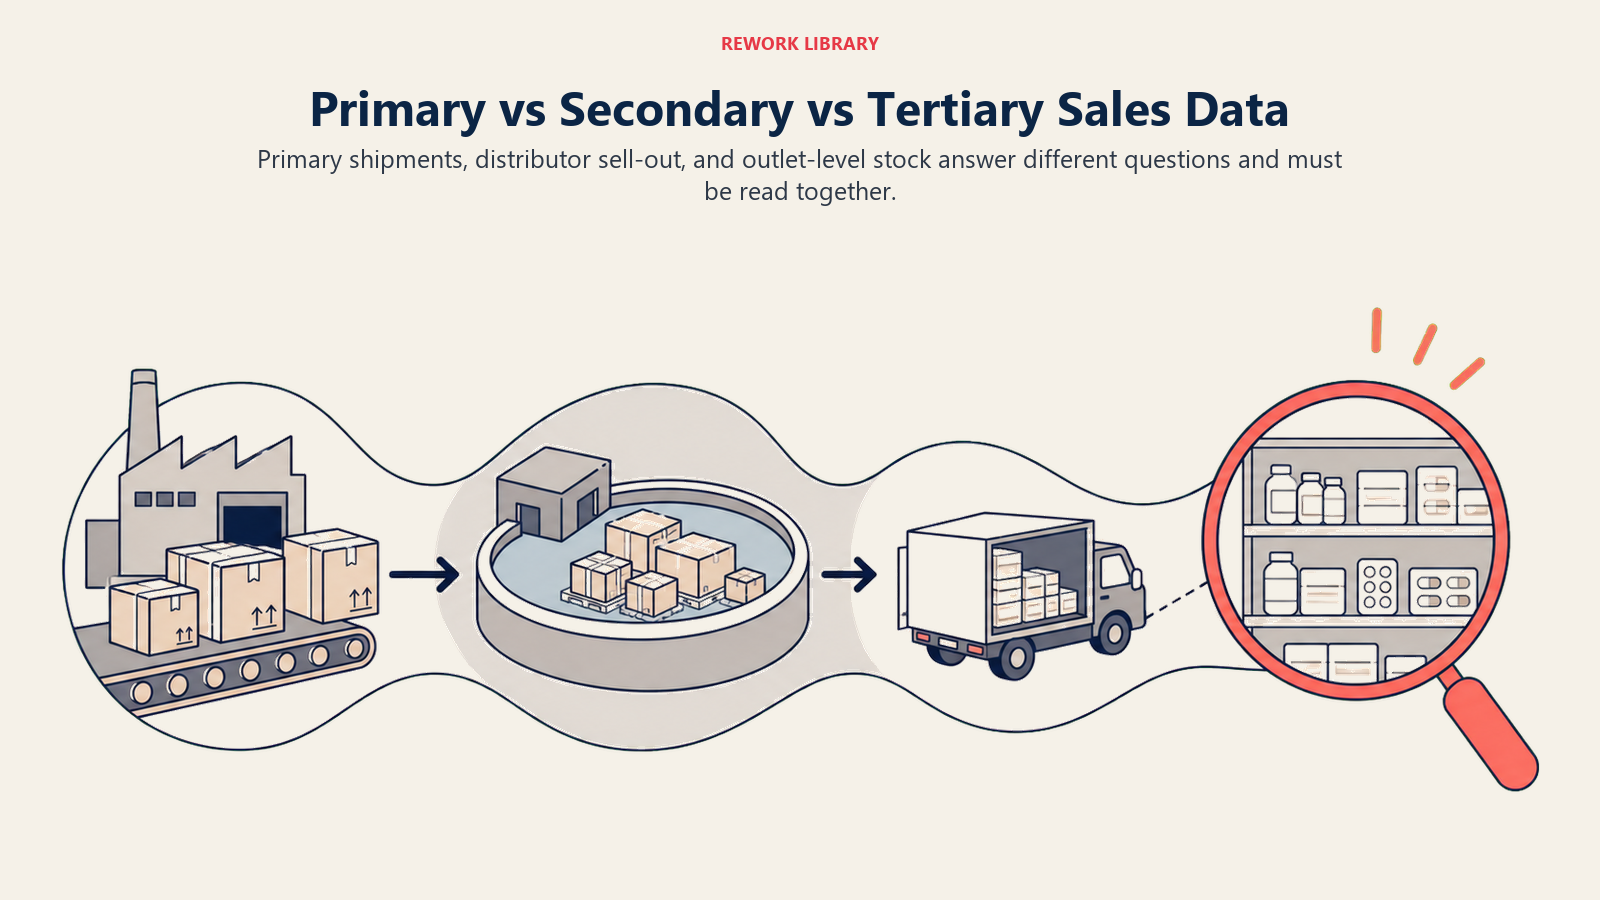
Primary sales is what you invoice to distributors or C&F (carrying and forwarding) agents: the volume that moves from your warehouse into the distribution network. This is the number most finance teams and commercial leaders track, because it's what hits the P&L. But primary sales is a leading indicator of inventory accumulation, not a lagging indicator of actual market penetration. A distributor can take a large primary order to hit a quarterly target and park it in their warehouse, inflating your sales report while the pharmacy shelf stays empty.
Secondary sales is what distributors sell out to the trade: pharmacies, drug stores, hospitals, clinics, and other institutional customers. This is where actual market penetration happens. Secondary sales data tells you which SKUs are moving at which outlet types, where the demand is concentrating geographically, and whether your field force detailing is translating into pharmacy offtake.
Tertiary sales is what pharmacies sell to patients: the final commercial event that corresponds to a prescription being filled. Tertiary data is the hardest to collect in most markets. Where it's available, through pharmacy point-of-sale (POS) integration, retail audit panels, or IMS/IQVIA prescription data, it provides the most direct view of whether prescriptions are converting to revenue.
| Data Level | What It Measures | Data Source | Typical Availability |
|---|---|---|---|
| Primary sales | Manufacturer to distributor | Your own ERP/invoicing | Always available |
| Secondary sales | Distributor to pharmacy/hospital | Distributor reports, DMS, SFA | Partial (coverage varies by market maturity; well-managed markets may reach 60-80% of distributors) |
| Tertiary sales | Pharmacy to patient | POS integration, retail panels, Rx audit | Low to medium (market-dependent) |
Most pharma companies run their commercial operations almost entirely on primary sales data and wonder why their forecasts miss, their field teams argue about territory potential, and their distributors periodically surprise them with return requests on near-expiry stock.
Key Facts: Pharma Supply Chain and Inventory Visibility
- Research on cold chain management at public health facilities in Southwest Ethiopia found median stock-out durations of 23 days and inventory record accuracy rates below 50%, illustrating how poor visibility amplifies temperature-risk exposure in resource-constrained public-health supply chains (PMC8455189).
- Studies on biologics cold chain integrity found that 76% of US Vaccines for Children program providers exposed vaccines to inappropriate temperatures for at least five cumulative hours in a two-week period, with WHO estimating over 50% of global vaccine wastage is attributable to cold-chain breaches, data from public immunization programs that highlights systemic cold-chain risk (PMC7869771).
- Secondary sales data coverage (distributor to pharmacy) varies significantly by market maturity; in well-managed commercial markets, a substantial share of distributors do report secondary data, but coverage gaps mean some channel activity remains invisible on primary-only commercial reporting, the exact share depends on your distributor network and market.
Data Sources and Collection Methods: What You're Working With
There is no single perfect source for secondary and tertiary sales data. What you'll actually work with is a combination of sources with different coverage, latency, and reliability trade-offs.
Van sales apps: When your distributor's salespeople use a mobile order management application to process pharmacy orders in the field, that app generates a transaction record for every delivery. This is your most granular and reliable secondary-sales data source, because it's captured at the point of sale to the pharmacy. The limitation is that it only covers pharmacies the distributor's van sales team actively calls on, and it requires your distributors to be using a capable sales force automation (SFA) tool and sharing the data with you.
Distributor management system (DMS) reports: Many larger distributors use dedicated inventory and order management software that generates secondary-sales reports as a standard output. The quality of these reports varies enormously. Some distributors send clean, structured data weekly. Others send PDF summaries of monthly totals that are essentially useless for operational analysis.
POS integration at key accounts: National pharmacy chains and hospital pharmacies increasingly have point-of-sale systems capable of generating product-level offtake data. Where you have key account agreements with these chains, requesting a POS data feed (or working with a data aggregator who collects it) gives you near-real-time tertiary visibility into your largest-volume accounts.
Manual spot-checks: Field reps recording on-shelf stock levels during pharmacy visits provides tertiary visibility where POS data isn't available. The limitation is that it's a point-in-time snapshot (not a flow measure), it depends on rep compliance, and the data sits in visit reports unless your SFA tool has an inventory module that captures it systematically.
Third-party retail audit panels: Services like IMS Health/IQVIA and local retail panel providers conduct regular surveys of pharmacy stock and offtake across statistically representative outlet samples. These panels give market-level benchmarks and competitive share data, but the sample size means they miss local variations, and the lag time (typically monthly or quarterly) makes them too slow for operational decisions.
Data Collection Comparison
| Source | Coverage | Latency | Reliability | Cost |
|---|---|---|---|---|
| Van sales app (distributor) | Outlets called by van team | Near real-time | High (if data shared) | Low to medium |
| DMS reports | Distributor's full outlet list | Daily to weekly | Medium (format varies) | Low |
| POS integration (chains) | Chain pharmacy universe | Near real-time | High | Medium |
| Field rep spot-checks | Visited outlets only | Weekly (visit cycle) | Medium (compliance-dependent) | Low |
| Retail audit panels | Statistical sample | Monthly | High | High |
For most pharma commercial teams, the practical path to secondary-sales visibility runs through (1) distributor DMS data for the bulk of your coverage and (2) van sales app data for granular outlet-level detail where distributors have capable tools. Everything else fills in the gaps.
Key Inventory Metrics: What to Measure
Once you have data flowing from the distribution channel, you need a defined set of metrics to drive operational decisions. These five metrics cover the core inventory visibility requirement.
Days of stock on hand (DSOH): How many days of current offtake rate the distributor's inventory covers. If a distributor holds 500 units of a SKU and average daily offtake is 25 units, DSOH is 20 days. Track this at the distributor level and, where data allows, at the pharmacy level for your top-volume outlets. DSOH below your reorder trigger (typically 21-28 days) should generate an automatic replenishment alert.
Formula: DSOH = Current inventory quantity / Average daily offtake over trailing 30 days
Stock cover at retail level: The equivalent of DSOH measured at pharmacy level. For key accounts, track how many days of patient offtake the pharmacy's current shelf stock covers. A key account pharmacy with three days of cover on a fast-moving primary care product is a stock-out waiting to happen.
Fill rate by SKU: Of all the orders that distributors (or pharmacies) placed for a specific SKU, what percentage were fulfilled in full? Fill rate below 95% indicates either a supply planning problem upstream or a distributor holding insufficient safety stock. See Distributor and Stockist Management for how to build fill rate requirements into distributor contracts.
Formula: Fill rate = (Units fulfilled / Units ordered) x 100
Expiry risk percentage: What share of stock in the distribution channel is within a defined risk window (typically 90 days) of expiry? High expiry risk is both a financial and a quality risk. It usually indicates one of three things: forecasting error (you over-stocked a SKU against actual demand), detailing failure (your field force didn't generate enough demand to clear the inventory), or distributor stocking practices that favor holding buffer stock on all SKUs regardless of demand.
Formula: Expiry risk % = (Inventory within 90 days of expiry / Total inventory) x 100
Stock-out frequency: How many times in a month did a SKU report zero stock at a distributor or key pharmacy account? Track this by SKU and by outlet category. A single stock-out event at a high-volume hospital pharmacy can cost more in lost revenue than a week of stock-outs across 50 independent pharmacies.
| Metric | Definition | Calculation | Target |
|---|---|---|---|
| Days of stock on hand | Days current inventory covers at current offtake | Inventory / Daily offtake | 21-45 days at distributor level |
| Fill rate | Orders fulfilled in full | Units fulfilled / Units ordered x 100 | Over 95% |
| Expiry risk % | Share of inventory near expiry | Expiry-risk units / Total units x 100 | Under 5% |
| Stock-out frequency | Zero-stock events per month | Count of SKU-location zero-stock occurrences | Zero for priority SKUs |
| Stock cover at retail | Days of patient offtake covered | Shelf stock / Daily patient offtake | 7-14 days at key accounts |
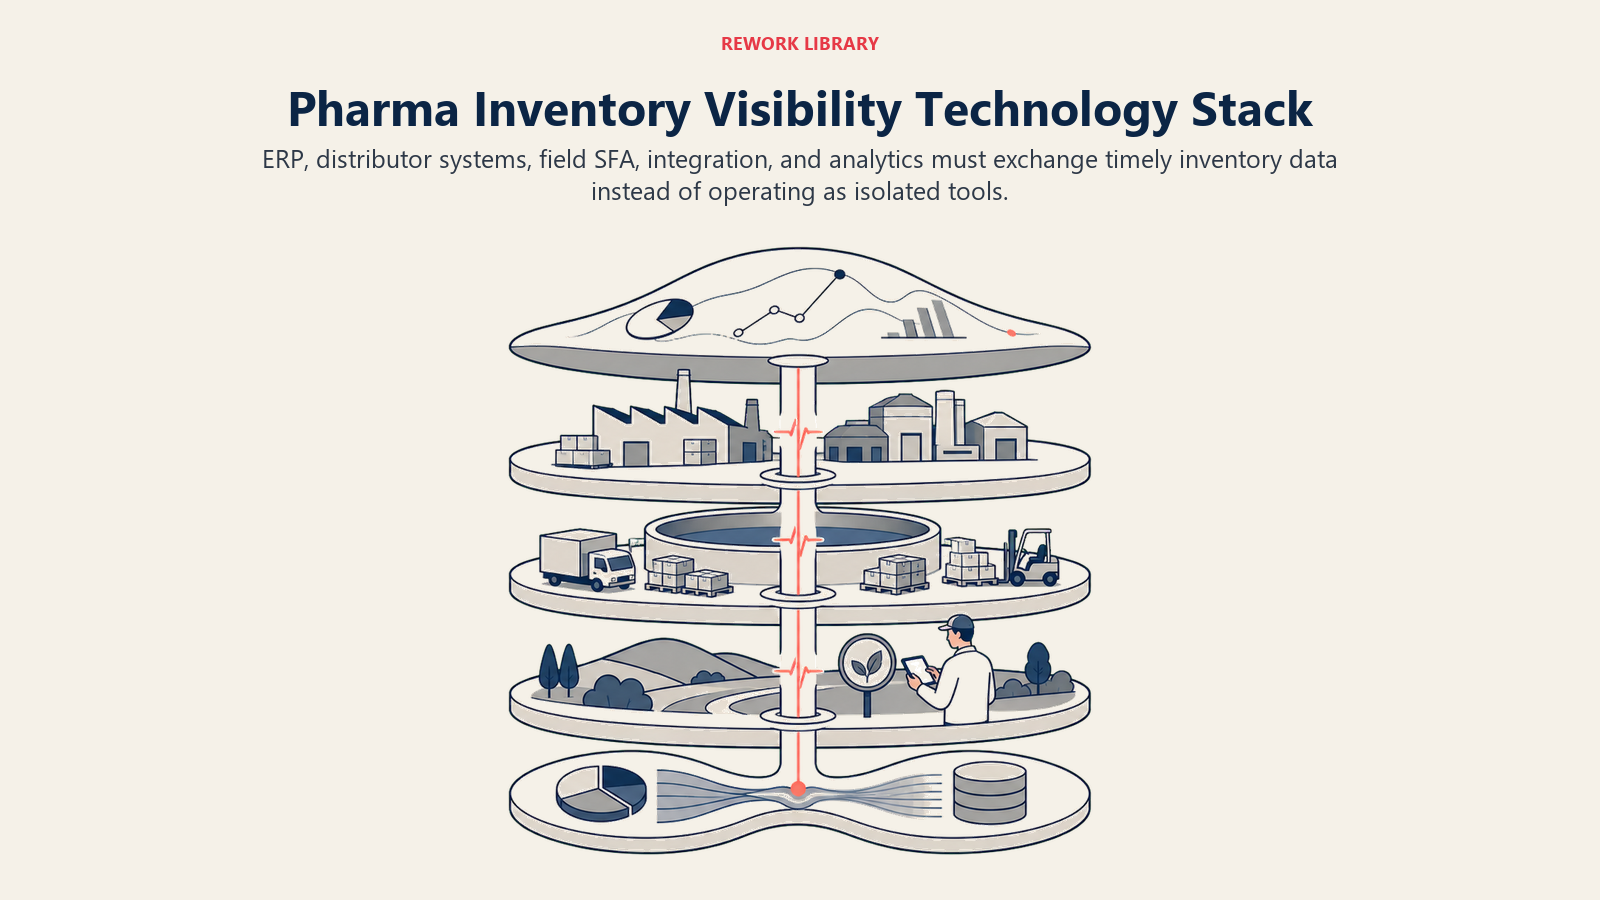
Technology Stack: Building the Visibility Infrastructure
Pharma inventory visibility isn't a single system. It's a data pipeline connecting your enterprise resource planning (ERP) system, your distributors' DMS tools, your field force SFA application, and your commercial analytics platform.
SFA with inventory modules: Your field force automation tool is the collection point for field-observed inventory data. When a rep visits a pharmacy, their SFA app should prompt them to record on-shelf stock for priority SKUs. Modern SFA platforms aggregate this data and flag low-stock pharmacies for follow-up by the distributor van sales team.
Distributor management systems (DMS): The best distributors run their own inventory management software that generates structured secondary-sales and stock-on-hand data. Where this exists, your priority is establishing a data-sharing protocol (API integration, EDI, or even a structured file transfer) that gets that data into your commercial analytics environment with minimal manual handling.
DMS portals (manufacturer-provided): Where distributors don't have capable systems of their own, some manufacturers provide a web portal or mobile app that distributors use to report secondary sales and current stock positions. The data quality improves when your distributors are using a system you control, but adoption requires distributor buy-in and sometimes financial incentive.
IoT (Internet of Things) shelf sensors for key accounts: At hospital pharmacies and large chain pharmacy locations, shelf-level IoT sensors can provide continuous stock monitoring without requiring any manual counting or data entry. These sensors typically use weight or image recognition to track inventory in real time and generate alerts when stock drops below a threshold. The technology is still expensive for broad deployment, but for your 20-30 highest-volume accounts, the stock-out prevention ROI is typically strong.
Demand sensing integration: The most mature pharma commercial organizations link their prescription tracking data (from services like IQVIA or local Rx audit services) to their inventory replenishment triggers. When prescription volumes for a product start rising in a territory, the demand sensing system flags an anticipated increase in channel offtake and generates an early replenishment recommendation before the distributor hits their reorder trigger. This is the difference between reactive restocking and proactive supply planning.
Inventory Visibility Maturity Matrix
| Maturity Level | Data Coverage | Technology | Decision Speed | Revenue Protection |
|---|---|---|---|---|
| Level 1: Primary only | Manufacturer to distributor | ERP invoicing | Reactive (weeks) | Minimal |
| Level 2: Secondary manual | Some distributor reporting | Spreadsheets, email | Reactive (days to weeks) | Partial |
| Level 3: Secondary systematic | 70%+ distributor coverage | DMS integration, SFA | Near-real-time | Good |
| Level 4: Full visibility | Secondary + tertiary at key accounts | SFA + DMS + POS | Real-time | Strong |
| Level 5: Demand sensing | Prescription-linked replenishment | Integrated analytics | Predictive | Maximum |
Most pharma commercial organizations in emerging markets are at Level 1 or Level 2. Moving to Level 3 (systematic secondary-sales visibility from at least 70% of distributors) typically produces a measurable reduction in stock-outs and a corresponding improvement in prescription-to-sale conversion rates within two to three quarters.
Demand Sensing and Reorder Triggers
The Five-Level Visibility Maturity Model (described in the Technology Stack section above) locates most commercial organizations in emerging markets at Level 1 or 2. Moving to Level 3 is the first investment threshold that produces a measurable reduction in stock-outs.
The classical pharma replenishment model is push-based: you forecast primary sales targets, build a production plan, ship to distributors, and hope the market absorbs it. It works tolerably when demand is stable and predictable. It fails badly during new product launches, seasonal demand peaks, and when field force detailing generates a rapid demand shift.
Demand sensing inverts this logic. Instead of starting with a supply plan and pushing it into the channel, you start with signals from the demand end of the chain (prescriptions written, pharmacy offtake rates, patient purchasing patterns) and use those signals to trigger replenishment upstream. This is the same forecasting logic that separates reactive sales planning from predictive commercial management: the Sales Forecasting Methods framework translates to the inventory context by treating distributor DSOH and pharmacy offtake rates as the demand signals that should drive supply-side decisions.
The practical implementation for most pharma commercial teams starts with a defined reorder trigger at the distributor level. When DSOH drops below a threshold (say, 28 days of cover), the distributor receives an automated replenishment alert via their DMS or your ordering portal, and the relevant territory manager receives a corresponding notification in their SFA. The replenishment order is either automatic (if the distributor has agreed to auto-replenishment within defined parameters) or requires a single confirmation step.
Linking this to prescription data from Prescription-to-Pharmacy Pull-Through Alignment creates a more sophisticated trigger: instead of waiting for distributor stock to fall below a threshold, the system uses rising prescription volume as an early warning and advances the replenishment recommendation before the stock drawdown reaches the reorder point.
Pharmacy-level order management connects closely to what happens in the cold chain, which is the compliance dimension of inventory that most commercial leaders underestimate.
Cold-Chain Tracking: The Compliance Dimension
For temperature-sensitive products (biologics, vaccines, protein-based therapeutics, certain hormone formulations), inventory visibility includes a compliance dimension that doesn't apply to ambient-temperature products. A cold-chain break is not just a stock quality issue. It's a patient safety issue and, depending on the market, a regulatory liability.
![]()
Temperature logging requirements: Cold-chain products should move with continuous temperature data from your cold storage facility through the distributor's refrigerated storage and vehicle, to the pharmacy's cold cabinet, and ideally to the point of dispensing. In practice, the weakest link is typically the "last mile" transport between the distributor and the pharmacy, where temperature-controlled vehicles may be unavailable or cold-chain protocols aren't consistently followed. Research on cold chain management at public health facilities in Southwest Ethiopia found median stock-out durations of 23 days and inventory record accuracy rates below 50%, a public-health supply chain context, but one that underscores how poor visibility amplifies temperature-risk exposure across distribution tiers.
Compliance requirements by territory: Regulatory requirements for cold-chain documentation vary by market and product type. In most markets with formal pharmacovigilance frameworks, you need to maintain records of temperature excursions (events where temperature moved outside the specified range) and have a documented process for quarantining and assessing affected product. Studies on biologics cold chain integrity found that 76% of US Vaccines for Children program providers exposed vaccines to inappropriate temperatures for at least five cumulative hours in a two-week period, with WHO estimating over 50% of global vaccine wastage is attributable to cold-chain breaches. These figures are drawn from public immunization programs, but they illustrate the systemic fragility of cold-chain logistics that commercial biologics distribution faces as well.
Liability handoffs: Define in writing at what point temperature liability transfers from manufacturer to distributor, and from distributor to pharmacy. Distributor agreements should specify the temperature excursion investigation and claim process. Without this, disputes about who bears the cost of damaged product can erode distributor relationships and create legal exposure.
Temperature logging technology ranges from simple data loggers (disposable sensors that record temperature over the shipment duration) to real-time IoT systems that transmit temperature alerts during transit. The right technology depends on your product's temperature sensitivity and the value at risk per shipment.
A territory manager who can see distributor days-of-stock-on-hand for priority SKUs alongside their detailing coverage rate holds two things at once: the demand signal they're generating and the supply signal that will determine whether that demand converts to revenue. That combination is not a technology problem. It is a dashboard design decision.
Inventory Visibility as a Commercial Capability
Supply chain and commercial leadership often treat inventory as a logistics metric (managed by operations and supply planning) rather than a commercial metric (owned by the field force leadership who generates the demand). That separation is where the stock-out tax accumulates.
When a commercial leader understands that DSOH and fill rate are lagging indicators of their field force effectiveness, and when they hold themselves accountable for secondary-sales performance rather than just primary offtake, the organization starts managing inventory visibility as a commercial asset. Structuring those metrics into a consistent commercial rhythm is where Workflow Automation pays off: automating the reorder alert, the stock-out notification, and the distributor performance flag removes the human bottlenecks that turn a one-day data lag into a five-day response delay.
The field force generates demand signals at the clinic and hospital level. Secondary Sales Tracking and Pull-Through converts those signals into pharmacy offtake. Inventory visibility closes the feedback loop: when the shelf empties faster than the replenishment cycle, the commercial team gets an early warning, not a lagging monthly report of lost sales.
Build the data infrastructure. Define the metrics. Connect inventory visibility to the same commercial dashboards your field force and their managers look at daily. A territory manager who can see distributor DSOH for their priority SKUs alongside their detailing coverage rate is a territory manager who can prevent stock-outs before they happen.
That's not a supply chain project. That's commercial leadership.
Frequently Asked Questions about Pharma Supply Chain and Inventory Visibility
What is the difference between primary, secondary, and tertiary sales in pharma?
Primary sales is what the manufacturer invoices to distributors or C&F agents. Secondary sales is what distributors sell out to pharmacies, hospitals, and clinics. Tertiary sales is what pharmacies dispense to patients. Each level reveals different commercial information: primary tracks inventory movement into the channel, secondary tracks market penetration at the outlet level, and tertiary tracks whether prescriptions are actually filling. Most pharma companies manage on primary alone, which is why their forecasts miss and their stock-outs go undetected until after the damage is done.
What is days of stock on hand (DSOH) and what is a healthy target?
DSOH measures how many days of current offtake rate a distributor's or pharmacy's existing inventory covers. The formula is current inventory quantity divided by average daily offtake over the trailing 30 days. A healthy range at the distributor level is 21 to 45 days. Below 21 days, replenishment should trigger automatically. Above 45 to 60 days, the parties should investigate to prevent expiry risk. At key pharmacy accounts, seven to fourteen days of cover is the standard target.
How can pharma companies collect secondary sales data from distributors who lack formal systems?
Three practical approaches work in lower-maturity markets. First, require secondary-sales reporting as a contractual condition and provide a structured template that distributors submit weekly. Second, provide a manufacturer-hosted DMS portal or mobile app that distributors use to log their transactions. Third, use field rep-observed stock data during pharmacy visits as a proxy: reps recording on-shelf quantities at key accounts can triangulate secondary sales trends before formal reports arrive. None of these approaches is as reliable as a direct data integration, but all are better than relying on monthly PDF summaries.
What triggers should a pharma company set for automatic replenishment alerts?
A reorder trigger fires when a distributor's DSOH drops below a defined threshold, typically 28 days of cover for standard products. When triggered, the distributor receives an alert through the DMS or ordering portal, and the relevant territory manager gets a notification in the SFA. Emergency reorder triggers at a lower threshold (say 14 days) should simultaneously notify the trade team to prepare a transfer order if the distributor's regular supplier can't fulfill in time.
When is cold-chain monitoring a commercial priority versus a compliance requirement?
Cold-chain monitoring is both simultaneously. The compliance dimension (WHO requirements for continuous temperature logging across every distribution tier) is non-negotiable for temperature-sensitive products. The commercial dimension is that a cold-chain break at the distributor level can void product, eliminate revenue from that batch, and create a customer claim that damages the relationship. IoT temperature sensors at the highest-value cold-chain accounts protect both the compliance record and the commercial relationship.
What does the Five-Level Visibility Maturity Model describe?
It describes the stages pharma commercial organizations move through from primary-only data (Level 1, reactive in weeks) to prescription-linked demand sensing (Level 5, predictive). Most companies in emerging markets are at Level 1 or 2. Moving to Level 3, systematic secondary-sales visibility from at least 70% of distributors, typically produces a measurable reduction in stock-outs and an improvement in prescription-to-sale conversion rates within two to three quarters, making it the first investment-return threshold worth targeting.
Learn More

Senior Implementation Consultant
On this page
- The Visibility Gap: Three Levels of Sales Data
- Data Sources and Collection Methods: What You're Working With
- Key Inventory Metrics: What to Measure
- Technology Stack: Building the Visibility Infrastructure
- Demand Sensing and Reorder Triggers
- Cold-Chain Tracking: The Compliance Dimension
- Inventory Visibility as a Commercial Capability
- Learn More