Territory Analytics and Sales Dashboards: Giving Pharma Field Leaders the Visibility to Win
Turn this article into takeaways for your work.
Each assistant summarizes the article only for you and suggests best practices for your work.
Most pharma dashboards display activity. They tell you how many calls were made, how many health care professionals (HCPs) were visited, how many samples were distributed. And if you ask why a territory is underperforming, the dashboard stares back at you with the same activity metrics it always shows.
Activity data without outcome context isn't commercial intelligence. It's an attendance record. And attendance records don't help a first-line manager coach a rep whose territory is flat, or help a regional director decide where to redirect effort in Q3.
This article is about building territory analytics that actually answer the questions field leaders need to answer: which territories are underperforming relative to potential, why, and what needs to change in the next call cycle.
The Three Layers of Territory Analytics
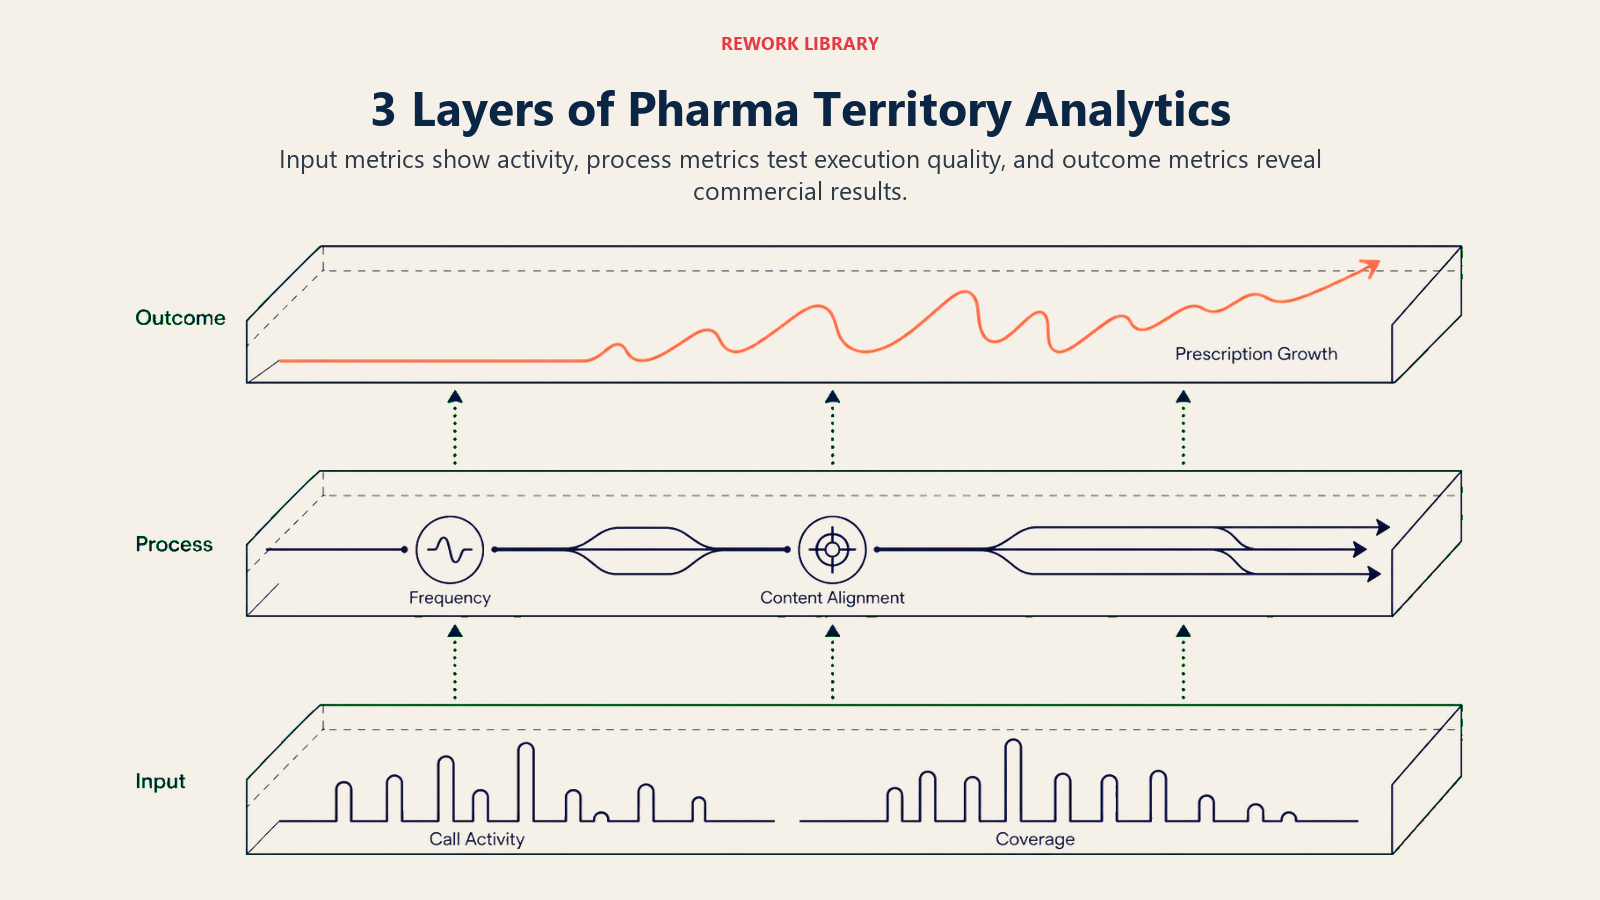
Territory analytics becomes useful when it's organized into three distinct layers that together tell the complete story of field force performance.
Key Facts: Territory Analytics
- A Deloitte analysis found that pharma reps spend roughly two-thirds of their workday on research and administrative tasks rather than direct HCP interaction, and stale dashboards are a direct contributor: when reps can't trust real-time data, they build their own spreadsheets instead of acting on system outputs (Deloitte, 2026)
- HCP prescribing behavior responds to the cumulative pattern of rep interactions rather than individual visits, which is why prescribing audit data carries a 4 to 8-week lag in most markets and why call frequency strategy should be evaluated over full cycles rather than week-by-week
- McKinsey's pharma commercial analytics research confirms that linking CRM activity data, prescribing data, and content engagement into a 360-degree HCP view is the architecture that makes territory analytics trustworthy rather than suspect (McKinsey)
Layer 1: Input Metrics
Input metrics measure what the field force is doing. They're the most available data and the least diagnostic on their own.
- Calls made per day, week, and cycle
- HCPs visited by territory and brick
- Samples distributed by product and territory
- CLM content sessions completed
- Call plan adherence (calls made vs. calls planned)
Input metrics answer: "Is the field force executing?" They don't answer whether execution is producing results.
Layer 2: Process Metrics
Process metrics measure whether the field force is executing according to commercial strategy, not just executing.
- Call plan adherence rate by HCP segment tier (A vs. B vs. C frequency targets)
- HCP coverage rate (% of target universe reached in the cycle)
- Frequency compliance (% of HCPs receiving calls at or above target frequency)
- Content engagement per call (CLM modules used, time on key slides)
- Call quality score (based on rep self-report, manager observation, and CLM data)
Process metrics answer: "Is the field force doing the right things, not just doing things?" A rep making 8 calls a day with 70% frequency compliance against A-segment HCPs is in a very different situation than a rep making 8 calls a day concentrated in easy-to-visit B and C accounts. Input metrics look identical. Process metrics reveal the difference.
Layer 3: Outcome Metrics
Outcome metrics connect field activity to commercial results.
- Prescription share by territory and product
- Secondary sales volume and sell-through rate by territory and brick
- HCP engagement score trend (improving, stable, declining)
- New HCP prescriber acquisition rate
- Market share versus competitor by territory
- Revenue per call (secondary sales lift divided by call frequency)
Outcome metrics answer: "Is the field force's activity producing commercial results?" They're also the metrics most affected by factors outside rep control: competitive launches, formulary changes, supply disruptions, and seasonal prescribing patterns. That's why all three layers need to be visible simultaneously. A territory where inputs are high, process metrics are strong, but outcomes are weak points toward an external factor worth investigating. A territory where inputs are high but process metrics are poor points toward execution strategy problems the manager can address. The three-layer structure mirrors standard commercial metrics frameworks: inputs as activity metrics, process as pipeline health indicators, and outcomes as revenue performance.
The Three-Layer Analytics Stack is the framework that separates operationally useful pharma dashboards from reporting exercises: Layer 1 (input metrics) confirms that the field force is executing; Layer 2 (process metrics) confirms it is executing against commercial strategy; Layer 3 (outcome metrics) confirms whether execution is producing prescribing results. All three must be visible simultaneously, because strong inputs with weak outcomes point to external factors, while strong inputs with weak process metrics point to execution strategy problems the manager can address.
Territory Dashboard Design Principles
Data without design is noise. The difference between a dashboard that changes behavior and a dashboard that gets closed after 30 seconds is whether it gives the right person the right information in the right format to take action.
Role-specific views. A rep needs to see their own call plan adherence, their HCP coverage gap, and their NBA recommendations for the day. A first-line manager needs to see all their reps' coverage and adherence in a single view with flags for individuals falling behind. A regional director needs territory-level performance comparisons and trend lines for the quarter. A national commercial head needs regional rankings, top and bottom territory identification, and product-level performance against plan. One dashboard trying to serve all four audiences serves none of them well.
Right time horizon by role. Reps need daily views. First-line managers need weekly trends. Regional directors need monthly performance against quarterly targets. National heads need quarterly and year-to-date comparisons. A dashboard that shows only monthly data to a rep isn't useful for daily call planning. A dashboard that shows only daily data to a national head creates noise instead of signal.
Actionable signals over data dumps. The test for any metric on a dashboard: can the person viewing it take a specific action based on what they see? If the answer is no, the metric might be valuable for analysis but doesn't belong on an operational dashboard. A rep seeing "HCP Dr. Reyes: 3 calls this cycle, target 4, last visit 12 days ago, next best action: clinical data on pediatric dosing" can act immediately. A rep seeing a table of 200 HCPs with visit history can't.
Mobile-first for field access. Dashboards designed for desktop displays and accessed by reps on iPads in their cars are dashboards that don't get used in the field. Mobile-first means the most critical information for a rep's day fits on a single screen without scrolling, loads quickly on LTE or 4G, and works in low-connectivity environments with cached data.
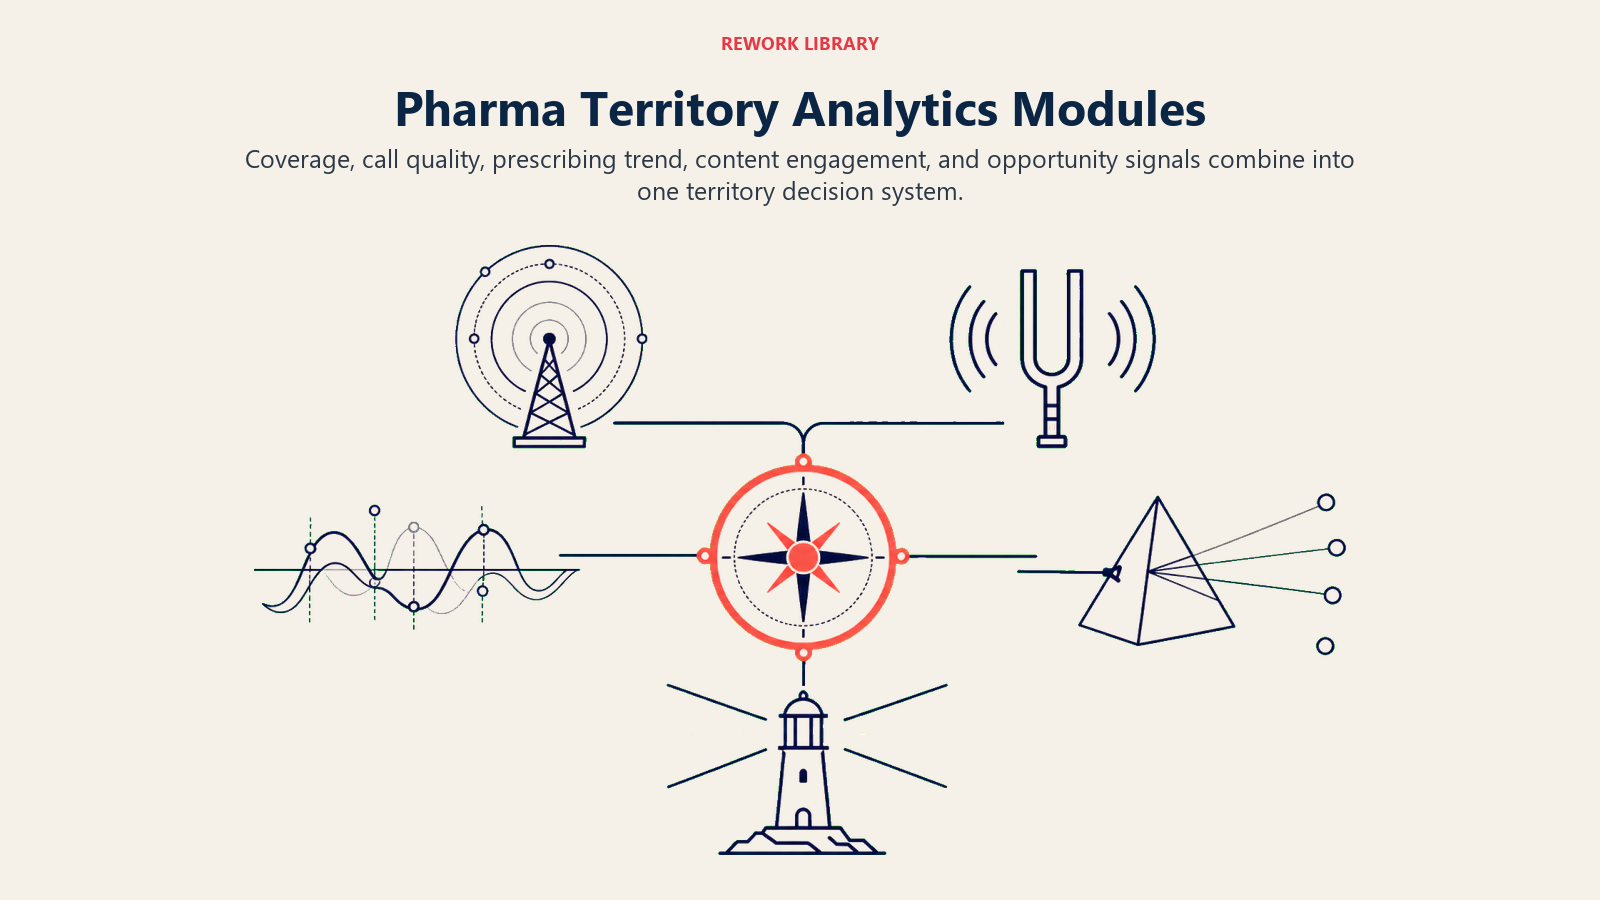
Key Analytics Modules for Pharma Territories
HCP Coverage and Reach Analysis
Coverage analysis answers: which HCPs in the territory universe has the rep visited this cycle, and which haven't been reached? The visualization should make gaps immediately visible, ideally on a map layer showing where unvisited HCPs are clustered geographically.
Coverage reports become actionable when filtered by segment: what percentage of A-tier HCPs have been visited? What percentage of B-tier? Low coverage in A-tier (high-potential prescribers) is a different problem than low coverage in C-tier (low-potential, low-priority). The first suggests a routing or time management problem. The second may be intentional prioritization.
Call Frequency vs. Segmentation Target Compliance
Frequency compliance tracks whether reps are calling on HCPs at the right rate: A-tier HCPs might have a target of 6 calls per cycle, B-tier 3, C-tier 1. A rep visiting 50 unique HCPs at 2 calls each looks busy on input metrics but may be systematically under-calling their A-tier accounts.
The frequency compliance view should show both the average frequency by segment tier and the distribution: what percentage of A-tier HCPs are at or above target frequency, what percentage are below, and by how much. Managers who see this view can immediately identify whether a rep is spreading effort too thin or concentrating it in the wrong segment.
Product-Level Performance by Territory and Brick
Product performance analytics break down secondary sales and prescription trends by product, territory, and the smallest geographic unit available (brick or district). This level of granularity allows managers to identify micro-patterns that aggregate territory data obscures.
A territory where Product A is growing and Product B is flat may have a rep who's particularly skilled at Product A detailing and less confident with Product B's clinical story. Or it may reflect that Product A has formulary access in the territory's dominant health system while Product B doesn't. Both hypotheses lead to different manager actions. The analytics can't answer the question definitively, but they surface the pattern that makes the question worth asking.
Secondary Sales and Inventory Pull-Through
Secondary sales data from distributors and stockists tracks how much product is actually moving out of the channel at the territory level. This is the downstream outcome that follows rep activity and HCP prescribing.
Pull-through analytics compare secondary sales against rep call frequency: are high-call-frequency territories also high-pull-through territories? If not, either the frequency isn't generating prescriptions, or the prescriptions aren't converting to dispensed scripts because of stockist inventory issues. Both diagnostics lead to different actions.
Inventory visibility is particularly important near cycle end and during promotional periods: territories that are losing sales because stockists are out of stock need a different response than territories that have inventory but aren't moving product.
Competitor Activity and Share-of-Voice Signals
Competitive share analytics compare your product's prescription or secondary sales trends against category trends in the same territory. A territory where your product is flat in a growing category is losing share. A territory where your product is flat in a declining category may be holding share.
Share-of-voice signals from field intelligence (rep-captured competitor activity, CLM-recorded objection patterns, and secondary sales ratios) give managers early warning of competitive threats before they show up in lagging prescribing data.
Integrating Multiple Data Sources
Territory analytics are only as complete as the data feeding them. Most pharma commercial operations have at least four distinct data sources that need to integrate into a single analytics view.
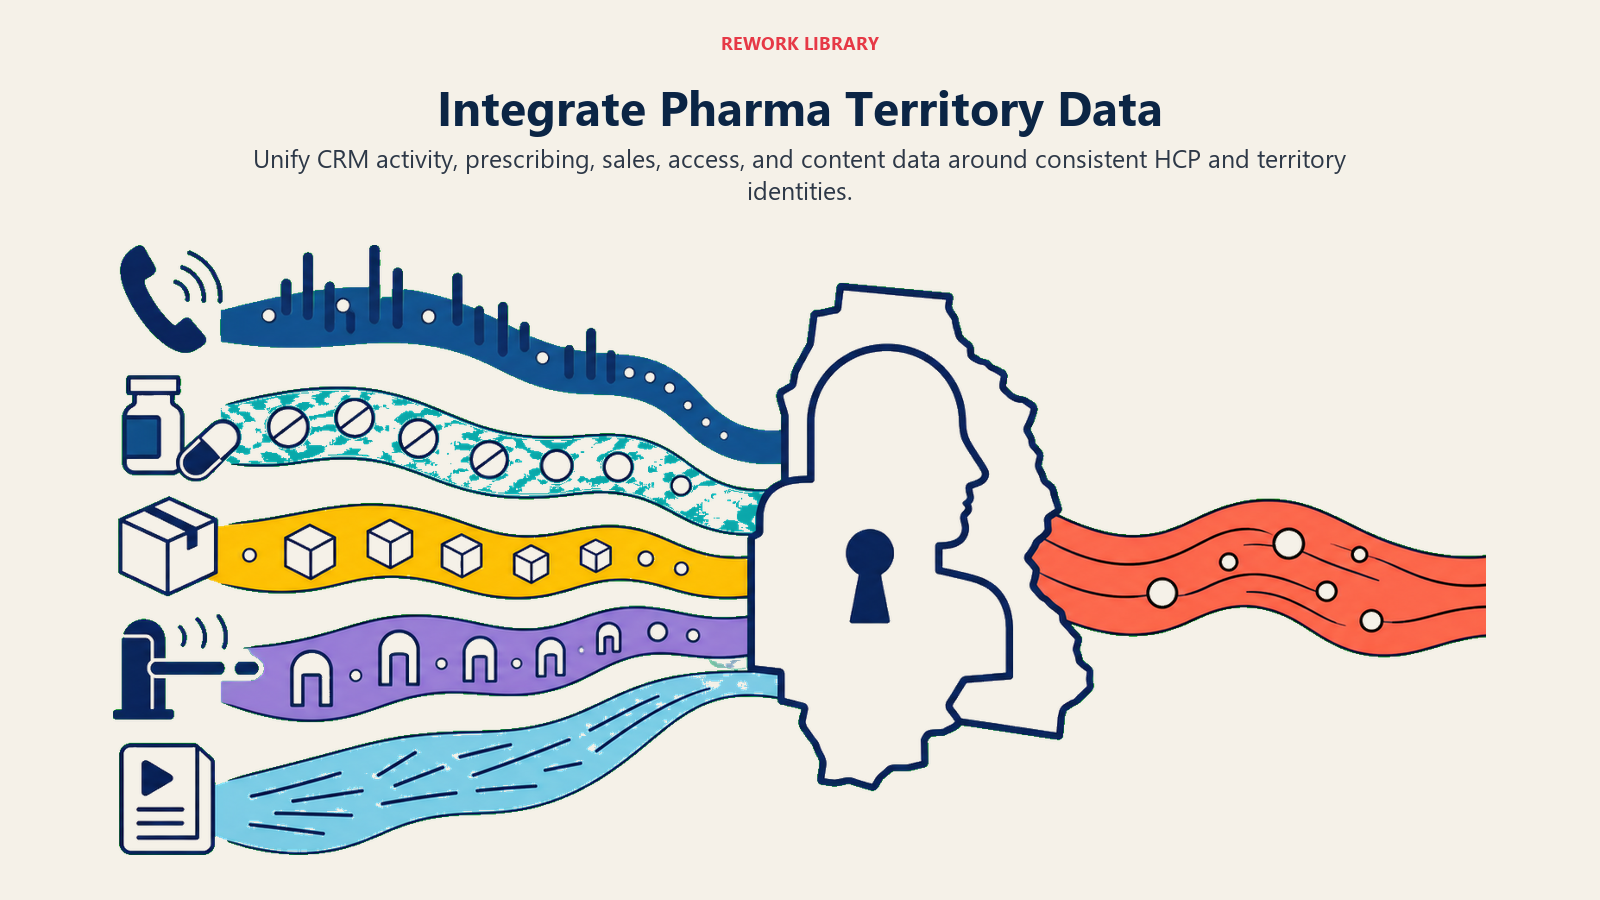
CRM activity data provides call logs, sample records, and CLM engagement data. It's the most current data source, typically available in near real-time.
Secondary sales data from distributors and stockists provides inventory movement and sell-through information. It's typically available with a 1 to 2-week lag depending on data partner agreements and reconciliation cycles.
Prescription audit data from commercial data providers (IQVIA, MIMS, or local market equivalents) provides HCP-level prescribing trends. It's the most valuable outcome data and typically the most lagged: 4 to 8 weeks in most markets. HCP prescribing behavior responds to the cumulative pattern of rep interactions rather than individual visits, which makes this lagged prescribing data essential for understanding whether call frequency strategy is working over full cycles rather than week-by-week.
CLM engagement data provides content performance metrics and HCP interaction scores. It syncs from the CLM platform to the analytics layer, ideally in real-time. The connection between Field Reporting and Closed-Loop Marketing and territory analytics is this data integration: CLM data makes territory analytics richer because it adds content effectiveness data to call volume data.
The integration architecture that makes this work requires a common HCP identifier across all four data sources (so you can join call records, prescribing data, and content engagement for the same doctor), a data warehouse or analytics platform that refreshes on a defined schedule, and a governance model that defines who is accountable for data quality in each feed. The underlying data management and platform considerations are covered in the pharma CRM and sales force automation article.
Manager Coaching with Territory Data
The highest-value use of territory analytics is not reporting to senior leadership. It's first-line manager coaching in the field.
A first-line manager who walks into a ride-along knowing that the rep's A-tier HCP frequency compliance is 62% (against an 85% target), that three of their top-10 prescribers haven't been visited in the last 21 days, and that their CLM engagement rate is the lowest on the team is a manager prepared to have a specific, data-grounded coaching conversation. This is the same discipline that commercial leaders apply through pipeline coverage analysis: knowing not just what's in the funnel but whether the coverage is sufficient to hit the number, and surfacing the gaps before they become misses.
That conversation sounds like: "I see that Dr. Santos hasn't been visited in 3 weeks and she's a Tier A prescriber for our priority product. What's the plan for re-engaging her this cycle?" Not: "How do you feel about your territory coverage?"
Dashboards support coaching when they show managers their reps' data before field visits, when they surface the specific HCPs and metrics most in need of attention (not just overall averages), and when they allow managers to log coaching observations against specific rep data points so patterns can be tracked over time.
Common Analytics Failures
Reporting lag kills relevance. A territory analytics dashboard that updates monthly doesn't help a rep adjust their call plan this week. The lag between field activity and dashboard reflection should be measured in hours, not weeks. If your secondary sales data is 6 weeks old by the time it reaches a dashboard, you're coaching on historical patterns, not current opportunities. Prioritize data freshness in your analytics architecture. A Deloitte analysis of pharma sales rep effectiveness found that reps currently spend roughly two-thirds of their workday on research and administrative tasks, and stale dashboards are a direct contributor: when reps can't trust real-time data, they build their own spreadsheets and workarounds instead of acting on system outputs.
Too many KPIs cause paralysis. A dashboard with 35 metrics doesn't give field leaders more information. It gives them more data to ignore. Identify the 5 to 7 metrics that most directly predict performance and most directly respond to rep behavior, and make those the center of every dashboard view. Everything else can be available on drill-down, but it shouldn't compete for attention with the primary signals.
Disconnected data sources create distrust. When a rep's call record shows they visited 48 HCPs and the territory coverage report shows 41, someone is right and someone is wrong. Until the discrepancy is resolved, no one trusts either number. Data quality issues in territory analytics are credibility problems: when field leaders stop trusting the data, they stop using the dashboards, and the investment is wasted. Maintain a clear data dictionary, a defined reconciliation process, and a published source-of-truth for each metric. McKinsey's pharma commercial analytics research confirms that linking CRM activity data, prescribing data, and content engagement into a 360-degree HCP view is the architecture that makes territory analytics trustworthy rather than suspect. The reference point for KPI integrity connects to Pharmaceutical Sales KPIs and Metrics.
Building a Cadenced Analytics Rhythm
The value of territory analytics depends not just on what the data shows but on when and how often different audiences engage with it.
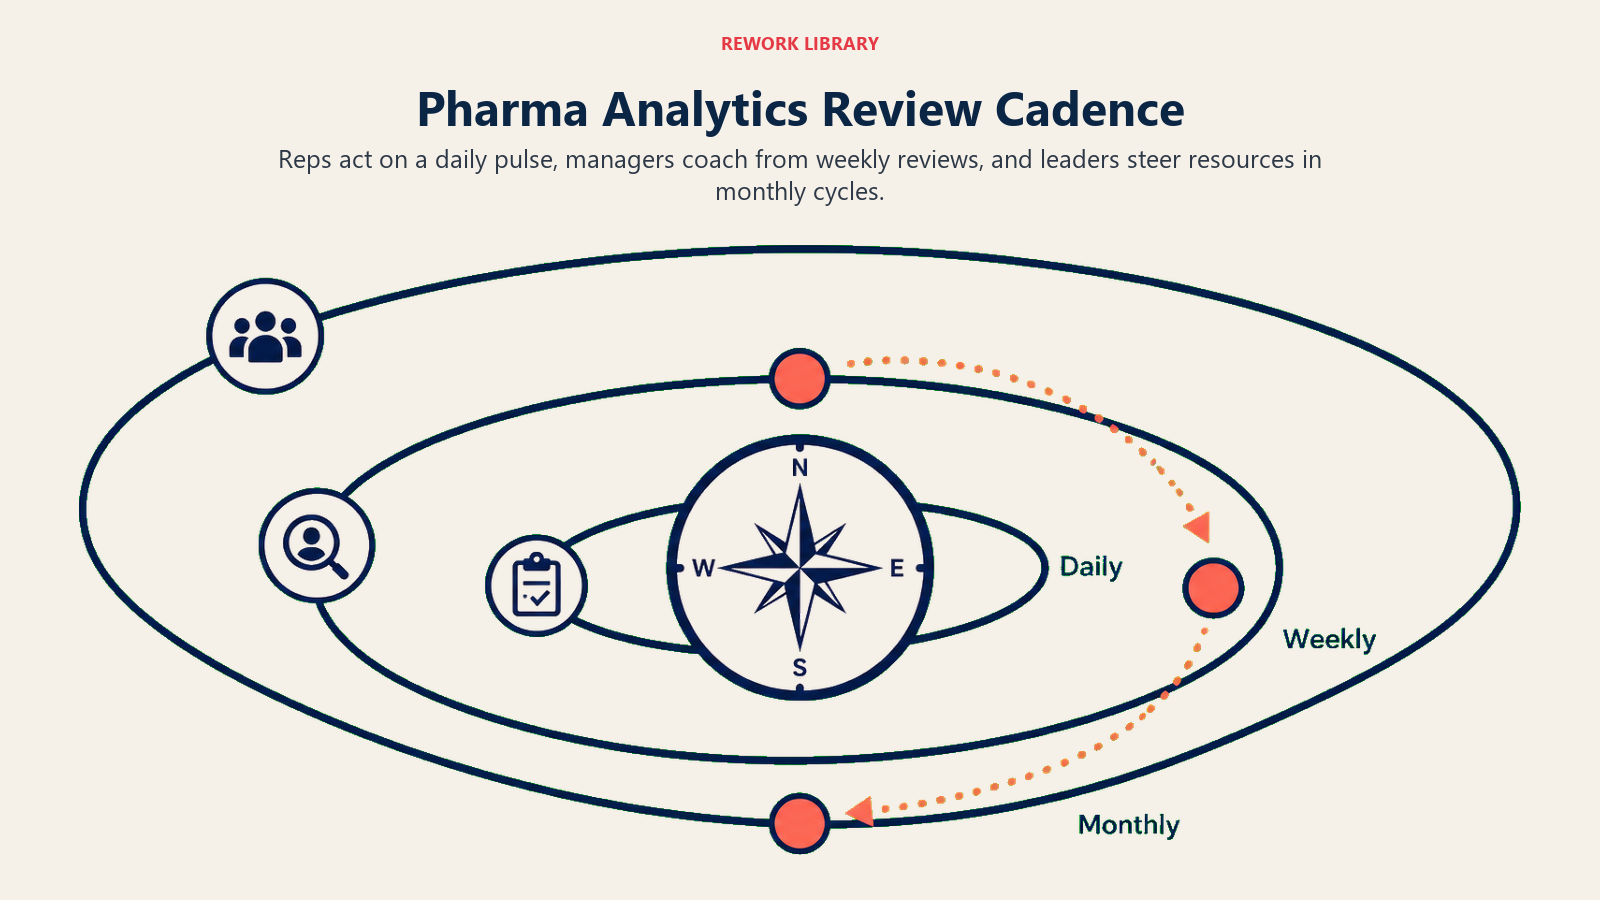
Daily rep pulse. Each morning, a rep reviews their prioritized call plan for the day: which HCPs to visit (based on frequency targets, NBA recommendations, and geographic routing), which products to focus on, any follow-up tasks from prior visits. Takes 5 minutes. Shapes the entire day.
Weekly manager review. Each Monday (or end of the prior week), first-line managers review their team's coverage, frequency compliance, and CLM engagement for the week just completed. They identify the 2 to 3 reps who need coaching attention and the 1 to 2 HCPs per rep who are most overdue for a visit or a different approach. This review feeds the week's coaching calls, field accompaniment planning, and team communication.
Monthly leadership steer. At the start of each month, regional directors and national commercial heads review territory-level performance against quarterly targets, product-level trends against plan, and competitive share movement. This review drives resource allocation decisions: where to increase field effort, where to adjust call plan targets, and where to escalate distributor or formulary issues that field activity alone can't resolve.
| Cadence | Audience | Key Questions | Data Sources |
|---|---|---|---|
| Daily | Rep | Who should I call today? | CRM call plan, NBA engine |
| Weekly | First-line manager | Which reps need coaching? Which HCPs are at risk? | CRM coverage, CLM engagement, frequency compliance |
| Monthly | Regional director | Which territories are off-track? Why? | CRM, secondary sales, prescribing data |
| Quarterly | National head | Where is the commercial plan working? What needs adjustment? | All sources, plus competitive intelligence |
The cadenced rhythm is what separates organizations that use analytics as a management tool from those that file it as an annual reporting exercise. A rep who checks their call plan dashboard every morning makes more targeted calls than one who checks it monthly. A first-line manager who reviews frequency compliance every Monday coaches more specifically than one who waits for quarterly reviews.
For territory-level connection between analytics and territory boundaries, see Secondary Sales Tracking and Pull-Through and Sales Territory Mapping and Account Universe.
Territory Analytics as the Operating System for a High-Performance Field Force
The field force that wins in a competitive pharma market deploys its resources in the right places, with the right content, at the right frequency, and adjusts faster when the market shifts. Headcount and sample budgets matter less than the precision with which they're deployed.
Territory analytics is the operating system that makes that consistency possible. It gives reps the clarity to prioritize their day without second-guessing. It gives first-line managers the data to coach specifically and confidently. It gives commercial leadership the visibility to make resource allocation decisions based on current reality, not quarterly sales cycles.
But analytics don't manage the field. People do. The analytics infrastructure only creates value when it's built into the rhythms of how field leaders actually work: the morning call plan, the Monday team review, the monthly commercial steer. Tools that exist outside those rhythms generate reports. Tools that are embedded in those rhythms change behavior.
Build the dashboards to serve the cadence. Build the cadence to use the dashboards. The commercial teams that do both find that analytics isn't something they review after the quarter ends. It's what shapes every call made during it.
Frequently Asked Questions about Territory Analytics and Sales Dashboards
What is the difference between input, process, and outcome metrics in pharma territory analytics?
Input metrics measure what the field force is doing: calls made, samples distributed, HCPs visited. They confirm activity but not quality or direction. Process metrics measure whether the activity is aligned with commercial strategy: are A-tier HCPs receiving calls at their target frequency, and is the CLM content being used as intended? Outcome metrics measure whether execution is producing results: prescription share, secondary sales pull-through, and HCP prescribing trend. You need all three layers simultaneously because strong inputs with weak outcomes point to external factors, while strong inputs with weak process metrics point to execution problems the manager can fix.
How many KPIs should a pharma territory dashboard show?
Five to seven primary metrics per role-specific view, with everything else available on drill-down. A dashboard that shows 35 metrics gives field leaders more data to ignore rather than more information to act on. The test for any metric on an operational front page is whether the person viewing it can take a specific action based on what they see. If not, it belongs on a secondary view. Rep dashboards should lead with today's call plan, frequency gaps for priority accounts, and any NBA recommendations. Manager dashboards should lead with coverage compliance by rep and the two or three accounts most overdue for visits across the team.
How does prescribing audit data lag affect territory analytics?
Prescribing audit data from providers like IQVIA or MIMS typically arrives with a 4 to 8 week lag in most markets. This means territory analytics must pair current CRM activity data (available in near real-time) with lagged prescribing outcomes. Managers coaching on prescribing trends need to account for this lag: a territory where CRM calls are high this week but prescribing data looks flat is not necessarily underperforming. The prescribing effect of this week's calls won't be visible in the data for 4 to 6 weeks. Quarterly reviews with prescribing trend lines are more reliable than monthly prescribing comparisons.
What data sources need to be integrated for a complete territory analytics view?
Four at minimum: CRM activity data (call logs, sample records, CLM engagement), secondary sales data from distributors and stockists, prescription audit data from commercial providers (IQVIA, MIMS, or local equivalents), and CLM content engagement data from the detailing platform. All four need a common HCP identifier to allow joins across sources. Without it, you have four separate datasets and manual joins that happen irregularly and usually only when a director asks a question no single source can answer.
What is the right cadence for territory analytics reviews at each organizational level?
Daily for reps (call plan and NBA review, 5 minutes every morning). Weekly for first-line managers (coverage compliance and frequency gaps for their team, 30 minutes on Mondays). Monthly for regional directors (territory-level performance against quarterly targets, product-level trends). Quarterly for national commercial heads (regional comparisons, competitive share, resource allocation decisions). The cadence matters as much as the content: organizations that review analytics on the right rhythm use data to change behavior. Organizations that review it irregularly use it to explain results after the fact.
When is a territory analytics discrepancy a data quality problem versus a system problem?
When a rep's call record shows 48 HCPs visited and the territory coverage report shows 41, the discrepancy is a data quality and governance problem: either the HCP master data has duplicate records, territory assignments are misaligned, or the two reports are drawing from different data versions with different refresh schedules. This kind of inconsistency, if left unresolved, destroys field leader trust in dashboards. The fix is a published data dictionary, a defined reconciliation process, and a designated owner for each metric's source of truth, not better dashboards.
Learn More

Senior Implementation Consultant
On this page
- The Three Layers of Territory Analytics
- Layer 1: Input Metrics
- Layer 2: Process Metrics
- Layer 3: Outcome Metrics
- Territory Dashboard Design Principles
- Key Analytics Modules for Pharma Territories
- HCP Coverage and Reach Analysis
- Call Frequency vs. Segmentation Target Compliance
- Product-Level Performance by Territory and Brick
- Secondary Sales and Inventory Pull-Through
- Competitor Activity and Share-of-Voice Signals
- Integrating Multiple Data Sources
- Manager Coaching with Territory Data
- Common Analytics Failures
- Building a Cadenced Analytics Rhythm
- Territory Analytics as the Operating System for a High-Performance Field Force
- Learn More