Sales Territory Mapping and Account Universe: Building the Geographic Foundation for Pharma Field Growth
Turn this article into takeaways for your work.
Each assistant summarizes the article only for you and suggests best practices for your work.
Poorly drawn territories are one of the most expensive invisible costs in pharma field operations. And they're invisible precisely because the problem doesn't show up on a profit and loss statement (P&L) as "territory design error." It shows up as reps who are burning half their day in the car, high-potential accounts that haven't been called in six weeks, and field managers who can't explain why one district is outperforming an adjacent one that looks identical on paper.
The fix isn't more reps or more call frequency requirements. It's returning to the map and asking a harder question: does every rep in this organization have a workable, balanced territory built on a complete picture of their account universe?
Most don't. And that gap is where the revenue goes.
What Is an Account Universe?
Before you can design a territory, you need to know what's in it. The account universe is the complete, defined population of accounts within a geographic area that a rep is responsible for covering. Not the accounts they currently call. The full set of accounts they should be calling.
In pharma field sales, the account universe typically spans four account types:
Pharmacies and drug stores: chain pharmacy outlets, independent pharmacists, franchise drug stores, and specialty dispensing outlets. These are your volume movers, particularly for chronic-therapy brands where patients fill prescriptions on a regular cycle.
Independent chemists and traditional trade: in many Asian and emerging markets, independent chemists represent a substantial portion of prescription fulfillment and OTC sales. These accounts are often undercounted in formal registries.
HCPs and clinics: general practitioners, specialists, and multi-physician clinics. The prescribing accounts. Call patterns here drive the script volume that feeds pharmacy demand.
Hospitals: inpatient and outpatient hospital pharmacies, key opinion leaders within hospital departments, and therapy-area specialists in tertiary centers. Hospital accounts operate on different cycles (formulary reviews, tender calendars) and require different engagement strategies than community accounts.
A common mistake is treating the account universe as the accounts already loaded in the CRM. Those are the accounts someone once decided were worth visiting. The actual universe is larger, and it includes accounts that were never called, accounts that became inactive, and accounts that have opened since the last territory review.
Key Facts: Pharma Territory and Coverage
- At the scale of the global pharmaceutical market, territory data quality is a commercial variable, not an admin task. The US accounts for roughly half of global prescription drug revenue, making account-universe accuracy especially consequential in North American markets.
- The IQVIA OneKey database covers more than 25 million healthcare professionals and 6 million organizations across 117 countries, making it the most reliable external source for potential scoring once an account universe is defined.
- A widely used field planning rule of thumb targets a maximum of 90 minutes of total daily drive time per rep. Beyond that threshold, the company is paying for transit rather than productive relationship time.
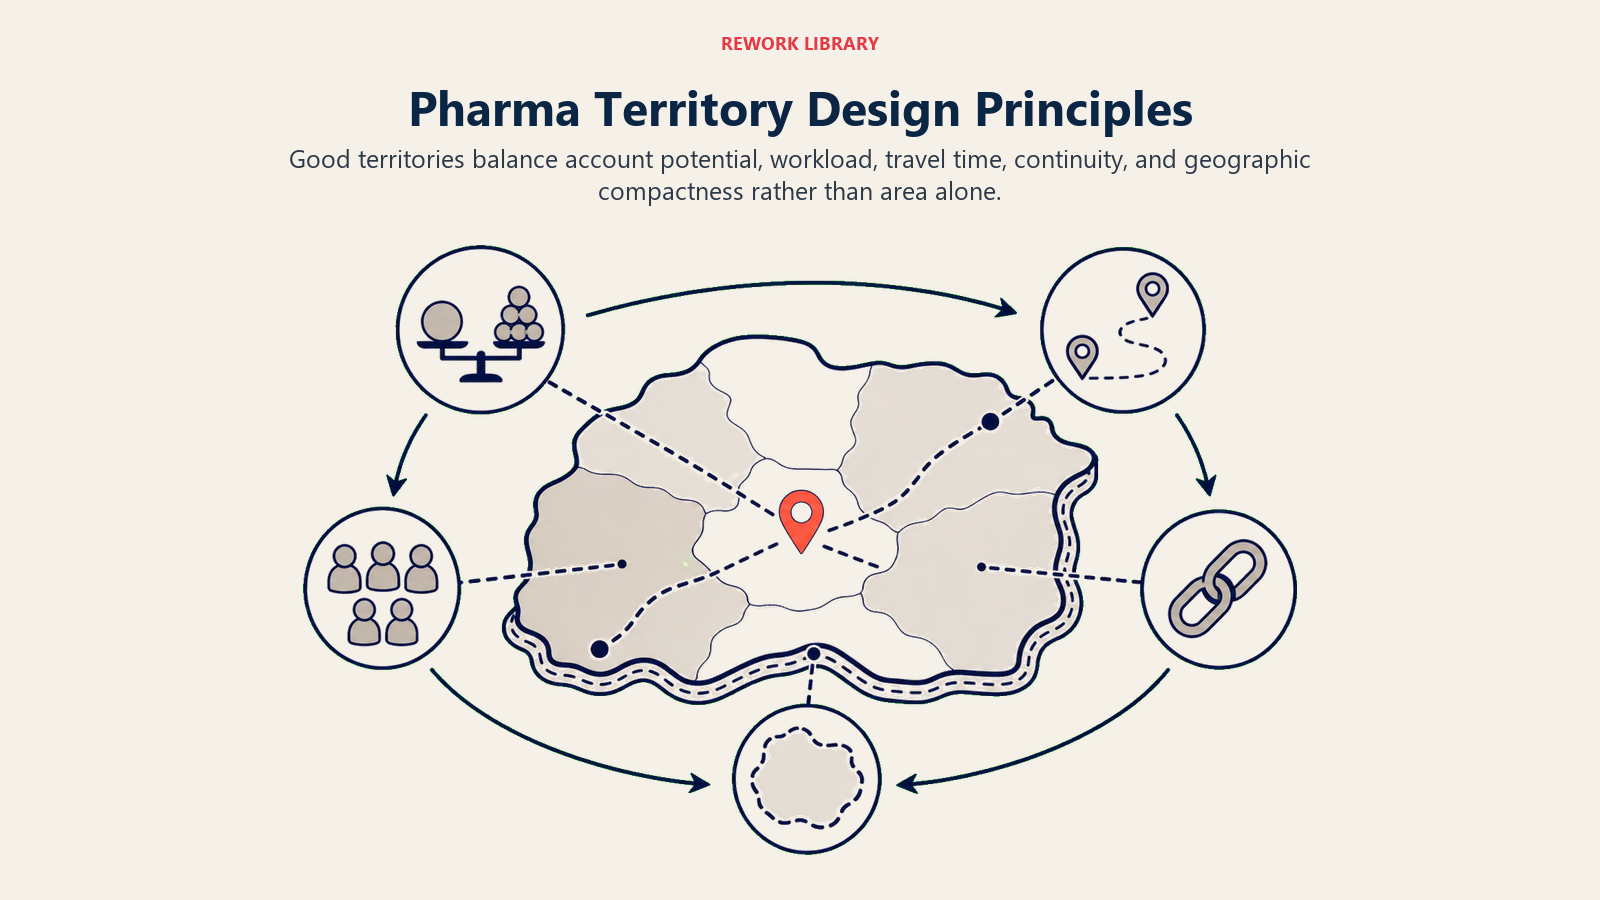
Territory Design Principles
Designing a territory well requires making a series of explicit choices, because every design optimizes for something, and optimizing for the wrong thing creates coverage gaps that cost you prescription volume.
The Potential-Weighted Territory Design principle is the standard most mature pharma commercial organizations apply: design territories around revenue opportunity first, then apply workload guardrails to ensure no single rep is carrying an unworkable call burden. This is the opposite of the more intuitive "equal accounts per rep" approach that produces fair-looking maps but commercially irrational coverage patterns.
Workload Balancing vs. Potential Balancing
These are two different objectives that look similar but produce different territory shapes.
Workload-balanced territories give each rep roughly equal numbers of accounts and total call burden. The logic is equity: no rep should be overwhelmed while another has a light patch. The risk is that equal call burden doesn't translate to equal revenue opportunity, especially when account potential varies significantly within a geography.
Potential-balanced territories distribute revenue opportunity evenly, even if that means one rep covers more accounts or more ground than another because the accounts in their area are smaller. The logic is commercial: maximize the revenue generated per dollar of field-force cost.
Most mature field organizations use a hybrid: potential-weighted design with workload guardrails. If a territory's modeled potential is three times average, you add a headcount to split it rather than expecting one rep to call on it all. The territory potential model also feeds directly into quota design: a quota set without reference to the territory's modeled account universe is either an arbitrary number or a copy of last year's target, neither of which reflects what's actually achievable.
Drive-Time Constraints for Daily Beats
A territory is only workable if a rep can physically execute a full day of calls within it. A widely used planning rule of thumb is a maximum of 90 minutes of total daily drive time, with productive field models targeting 60 minutes or less. Beyond that threshold, you're paying a rep's time to sit in a car rather than build relationships.
Drive-time analysis needs to account for peak-hour traffic patterns, not just straight-line distance. Two accounts that look three kilometers apart on a map might represent 45 minutes of cross-city driving during morning rush hour.
GIS mapping tools allow you to run drive-time isochrones from any anchor point and design territory boundaries that reflect actual travel realities, not cartographic approximations.
Account-Type Mix Per Territory
A territory of 200 pharmacies and no HCPs, or 50 HCPs and no pharmacy coverage, creates structural problems regardless of how well-drawn the geographic boundaries are. The account mix within a territory needs to reflect your brand's commercial model.
For prescription brands where doctor detailing drives pharmacy pull-through, each territory needs a meaningful HCP call list alongside the pharmacy base. For pharmacy-led brands or OTC products, the balance shifts toward outlet density. Hospital-centric brands may require territories organized around hospital catchment areas rather than geographic grids.
Sample Account Mix Ratios by Brand Type
| Brand Model | Pharmacies | HCPs/GPs | Specialists | Hospital Accounts |
|---|---|---|---|---|
| Primary Care Rx brand | 40-50% | 35-45% | 10-15% | 0-5% |
| Specialty Rx brand | 25-35% | 15-25% | 40-50% | 10-20% |
| OTC/self-care brand | 60-70% | 20-30% | 5-10% | 0-5% |
| Hospital tender brand | 10-20% | 10-15% | 20-30% | 40-55% |
These ratios are starting points. Your actual mix should reflect the prescribing and dispensing dynamics of your therapeutic area in your specific market. Getting that mix right depends on having reliable data for each account type, which is where the next challenge usually surfaces.
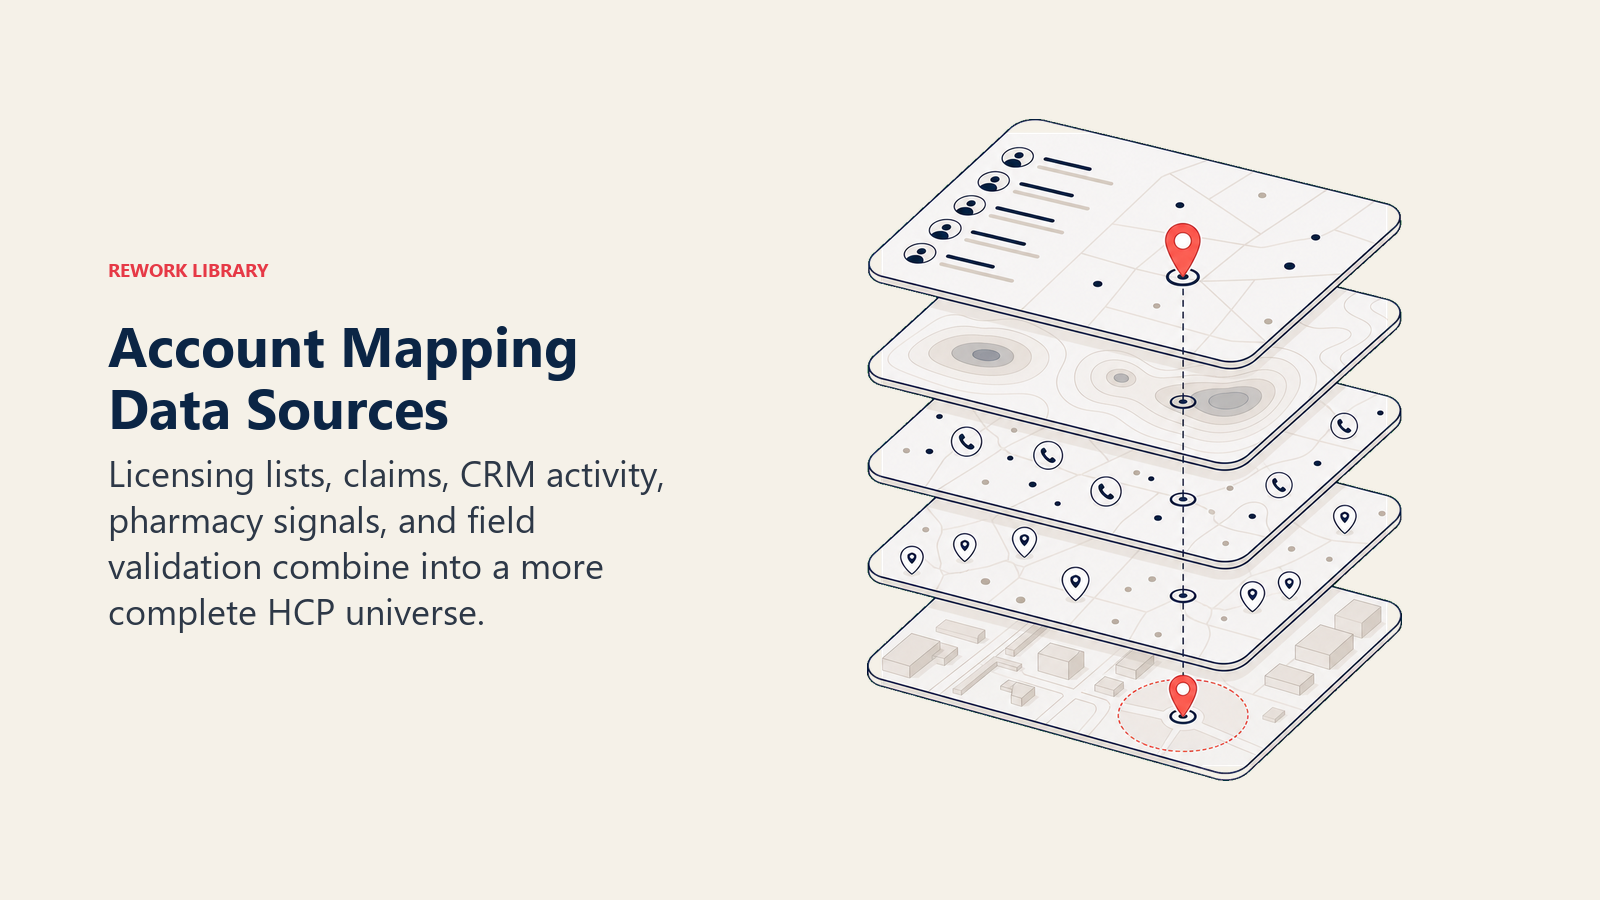
Data Sources for Account Mapping
Building the account universe requires pulling from multiple data sources, because no single source gives you the complete picture.
Pharmacy licensing registries: Health ministries and pharmacy councils in most markets maintain licensing databases of registered pharmacies and dispensing outlets. These are the most authoritative source for the formal pharmacy universe, though they may lag behind actual market activity.
Medical council and HCP directories: Physician licensing bodies maintain registries of practicing doctors. These are useful for building the baseline HCP universe, particularly for identifying specialists by certification type.
Distributor outlet data: In markets with strong distributor networks, your distribution partner's outlet list is often more current than government registries. Distributors know which pharmacies are actually buying, which have closed, and which have opened recently.
CRM historical call data: Your existing CRM contains the accounts your reps have been calling. This data tells you about coverage patterns, visit frequency, and sales performance by account, but it shouldn't be mistaken for the full universe. Accounts not in the CRM aren't necessarily not worth calling. They may just never have been added.
Secondary sales and prescription data: IQVIA data, where available, provides prescription volume by geography, HCP, and outlet. The IQVIA OneKey database covers more than 25 million healthcare professionals and 6 million organizations across 117 countries, making it the most reliable source for potential scoring once you've identified the account universe.
Combining these sources requires deduplication and a master account identifier strategy. This is often where the project bogs down. Invest the data-management effort upfront. A clean account master is the foundation everything else builds on. Once you have it, the question is how to divide accounts into tiers that drive call frequency decisions.
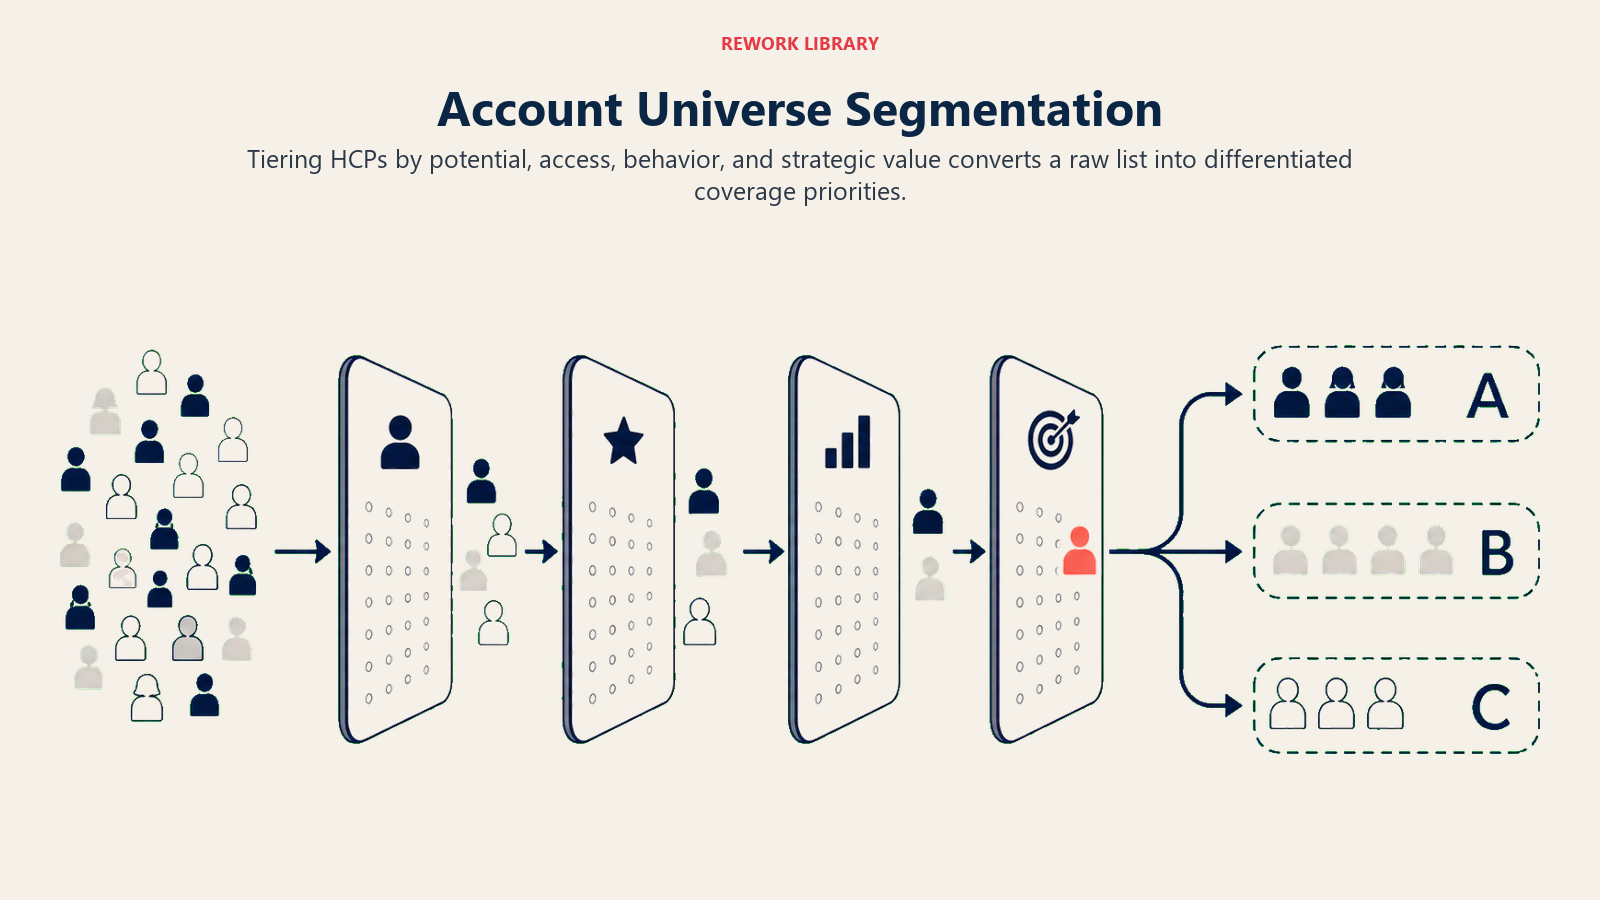
Segmenting the Account Universe
Not every account in the universe deserves the same call frequency. Segmenting accounts into tiers allows you to allocate field time where it generates the most return. For detailed guidance on building the segmentation model itself, see Customer Segmentation and Targeting.
At the territory design stage, what matters is understanding the tier distribution within each proposed territory. A territory with 80% Tier C accounts is either undertasked (the rep won't fill a full day of productive calls) or the territory boundaries are drawn wrong.
Account Universe Tier Framework
| Tier | Account Profile | Target Call Frequency | Typical Share of Universe |
|---|---|---|---|
| Tier A | High prescription volume or purchase potential, strong relationship, responsive to detailing | Monthly or biweekly | 15-20% |
| Tier B | Medium potential, growing volume, or strategic importance (formulary influence, geographic anchor) | Every 6-8 weeks | 30-40% |
| Tier C | Low current volume, maintenance relationship, or new-to-call | Quarterly or digital-only | 40-55% |
When mapping territories, run the modeled tier distribution for each proposed territory and compare it against the benchmark. Territories with too many Tier A accounts need to be split. Territories with too few Tier A accounts are probably too small or covering low-density areas.
Active vs. Lapsed vs. Never-Called Accounts
Beyond tier assignment, the account universe should be coded by relationship status:
Active: Currently being called on a regular schedule, with a recent interaction in the CRM.
Lapsed: Was called in a prior period but hasn't been visited in more than one call cycle. These often represent accounts where a rep relationship broke down, an HCP moved, or the account was deprioritized without a formal decision.
Never-called: Present in the account registry but not in the CRM call history. These are the true white-space accounts, and they represent the most accessible near-term revenue opportunity in many territories.
Lapsed and never-called accounts often represent the fastest accessible revenue in a territory. The brand may already have some presence from prior activity or peer HCP influence. A systematic reactivation approach covering both categories typically yields higher returns per rep hour than opening entirely new relationships, because the groundwork, whether a prior visit, a sample record, or a peer referral, is already partially laid.
Territory Review Cadence
Territories drawn two years ago are wrong today. Markets change. Reps turn over. Products launch and lose exclusivity. Headcount adjusts. Territory reviews ensure that your geographic design keeps pace with commercial reality.
Product launches almost always require territory review. A new product may target a different HCP specialty or a different pharmacy channel than your existing portfolio, which can mean the current territory carve is suboptimal from day one of launch.
Significant headcount changes (more than 10% change in field force size) require rebalancing. Adding reps without redrawing territories means the new reps inherit leftover accounts with no coherent geography. Removing reps without consolidating territories creates patches too large for the remaining headcount to cover properly. Territory boundaries also determine how accounts are routed to reps at the moment of assignment, so any major redesign should be reviewed against your territory-based routing rules to keep account ownership consistent from the first point of contact forward.
Market shifts such as generic entry, major competitor launch, or formulary changes at a key hospital system can dramatically change the potential distribution across a geography. Tier assignments may need to change even if the territory boundaries don't.
Annual review is the minimum standard for stable markets. High-growth or high-change markets benefit from six-month reviews of at least the account tier assignments, even if the territory boundaries don't change.
Territory Review Checklist
- Account universe refreshed against current licensing registries and distributor data
- Potential scores updated with latest secondary sales data
- Tier assignments reviewed and updated
- Drive-time analysis validated for any boundary changes
- Account-type mix verified against brand commercial model
- Lapsed and never-called account lists generated for each territory
- New territory assignments communicated to reps with adequate lead time
Tools and Technology
The days of drawing territories on paper maps are behind most commercial organizations, but the sophistication of technology in use varies considerably.
GIS mapping platforms (Esri ArcGIS, Maptitude, SPOTIO's mapping module) allow territory design based on geographic data layers, drive-time isochrones, and account location plotting. These are the standard tools for territory design projects, though they require data preparation effort.
CRM territory modules (Salesforce Maps, Veeva CRM's territory management, Repsly for smaller teams) integrate territory management directly into the rep's daily workflow. When territory assignments live in the CRM, account assignments stay current when reps change, new accounts are added, and territory boundaries shift. They also enable Territory Analytics and Sales Dashboards that give field managers real-time visibility into coverage.
Field-force automation platforms increasingly combine territory management, call planning, and route optimization in one workflow. A rep sees their territory accounts, their tier assignments, their planned call schedule, and their optimal route sequence in a single interface. This reduces the cognitive load on the rep and increases actual call time by cutting navigation inefficiency.
Whatever technology stack you use, the principle is the same: territory design decisions should be encoded in the system so they govern rep behavior, not just exist in a spreadsheet that sits in a shared drive someone remembers to update twice a year.
A Mapped and Tiered Account Universe Is the Foundation
Territory mapping is often treated as an administrative project, something done once when the field force launches and revisited reluctantly when it breaks. That's the wrong frame.
A properly designed territory structure with a complete, tiered account universe is the base layer that makes every downstream field-force activity executable. Beat and Route Journey Planning can't be optimized without knowing all the accounts in the territory. Call Frequency and Coverage Optimization can't be calibrated without knowing which tier each account sits in. Field Force Sizing and Deployment decisions depend entirely on having a reliable picture of total call burden and account potential by geography.
Get the map right, and everything that runs on top of it gets measurably more productive. Get the map wrong, and you're running a precision sales engine on a broken foundation. The organizations that revisit their territory design with the same rigor they bring to their marketing strategy consistently find revenue they didn't know they were leaving behind.
Frequently Asked Questions about Sales Territory Mapping and Account Universe
What is a pharma account universe and how is it different from the CRM account list?
The account universe is the complete, defined population of accounts within a territory that a rep should be covering, including pharmacies, HCPs, and hospitals. The CRM account list is only the accounts someone previously decided to add to the system. These are not the same thing. Accounts that were never called, lapsed accounts, and outlets that opened after the last territory review are typically absent from the CRM but belong in the true universe. Treating the CRM list as the full universe systematically underestimates coverage opportunity.
What is the difference between workload-balanced and potential-balanced territory design?
Workload-balanced design gives each rep roughly equal numbers of accounts and total call burden. Potential-balanced design distributes revenue opportunity evenly, even if that means one rep covers more accounts because the accounts in their area are smaller. Most mature commercial organizations use a hybrid: potential-weighted design that gives reps proportional revenue opportunity, with workload guardrails that flag territories whose call burden would exceed what one rep can cover.
How often should pharma sales territories be reviewed?
Annual review is the minimum standard for stable markets. High-growth or high-change markets benefit from six-month reviews of tier assignments, even when boundaries don't change. Trigger events that require immediate review include significant headcount changes (more than 10%), new product launches that target different customer profiles, generic entry or a major competitor launch, and formulary changes at key hospital accounts. Product launches almost always require territory review from day one.
What data sources build the most accurate pharma account universe?
The most complete account universe comes from combining multiple sources: health ministry pharmacy licensing registries (authoritative but sometimes lagged), medical council HCP directories (useful for specialist identification by certification type), distributor outlet data (often more current than government registries), CRM historical call data (useful for relationship history but incomplete for universe definition), and IQVIA data where available for potential scoring. No single source is sufficient. Deduplication and a master account identifier strategy are essential investments before the territory design process can proceed reliably.
What drive-time standard should territory designs respect?
A widely used planning rule of thumb is a maximum of 90 minutes of total daily drive time, with productive field models targeting 60 minutes or less. Beyond that threshold, the organization is funding transit rather than productive HCP and pharmacy relationships. Drive-time analysis must account for peak-hour traffic patterns, not straight-line distance. Two accounts that appear close on a map may represent 45 minutes of cross-city driving during morning rush hours.
How do you use tier distribution to validate a proposed territory design?
Run the modeled tier distribution for each proposed territory and compare it against the benchmark (roughly 15 to 20% Tier A, 30 to 40% Tier B, 40 to 55% Tier C). A territory with 80% Tier C accounts is either undertasked (the rep won't fill a productive day) or drawn across a low-density area that can't support the headcount. A territory with excessive Tier A concentration needs to be split so high-value accounts receive adequate frequency from a dedicated rep.
Learn More

Senior Implementation Consultant
On this page
- What Is an Account Universe?
- Territory Design Principles
- Workload Balancing vs. Potential Balancing
- Drive-Time Constraints for Daily Beats
- Account-Type Mix Per Territory
- Data Sources for Account Mapping
- Segmenting the Account Universe
- Active vs. Lapsed vs. Never-Called Accounts
- Territory Review Cadence
- Tools and Technology
- A Mapped and Tiered Account Universe Is the Foundation
- Learn More