Pharma Field Sales Economics: Cost, Coverage, and Return on Field Investment
Turn this article into takeaways for your work.
Each assistant summarizes the article only for you and suggests best practices for your work.
Every pharma commercial director eventually faces the same conversation with their CFO: "We have 200 reps visiting doctors. What's the return on that?"
Most can't answer it precisely. They know their headcount budget. They know their sales numbers. But the link between individual rep activity and revenue outcomes lives in a black box, measured at best by primary sales volume and at worst by call reports that tell you someone showed up.
That's a capital allocation problem. Field forces are expensive assets, and the true cost of a single rep runs far higher than most headcount plans reflect. At the scale of a 200-person field force, "we do detailing and it drives scripts" isn't good enough. You need an economic model your CFO will trust and your commercial team can actually use.
This article builds that model. It covers the full cost of a field rep, how to attribute revenue to field activity, the key economic ratios that govern field productivity, and how to make headcount decisions on a defensible financial basis.
The Full Cost of a Field Rep
The first mistake in field economics is treating salary as the cost. Salary is typically 40-50% of the true cost. The rest gets buried in functional budgets that don't make it onto a single P&L line.
Here's a realistic total cost of ownership model for a single pharmaceutical medical rep, based on standard headcount planning components. Actual figures vary by country, therapeutic area, and company size:
| Cost Component | Emerging Market (USD) | Developed Market (USD) |
|---|---|---|
| Base salary | $25,000 - $40,000 | $65,000 - $90,000 |
| Incentive compensation (target) | $8,000 - $15,000 | $20,000 - $35,000 |
| Vehicle / transport | $4,000 - $8,000 | $8,000 - $15,000 |
| Samples and promotional materials | $5,000 - $12,000 | $10,000 - $20,000 |
| CRM, tools, device costs | $1,500 - $3,000 | $3,000 - $6,000 |
| Training (initial + ongoing) | $2,000 - $4,000 | $5,000 - $10,000 |
| Management overhead (pro-rated) | $3,000 - $6,000 | $8,000 - $15,000 |
| Benefits, taxes, employer contributions | $5,000 - $10,000 | $15,000 - $28,000 |
| Total cost per rep (annual) | $53,500 - $98,000 | $134,000 - $219,000 |
When you run this calculation across your field force, the number is usually larger than expected. And that's before you account for the indirect cost of management time, HR overhead, and commercial support functions that enable the field to operate.
This full cost figure is the starting point for every economic conversation about field investment. If you're analyzing a headcount increase, you're not evaluating a salary line. You're evaluating a fully loaded annual commitment, ranging from roughly $54,000 in lower-cost emerging markets to over $200,000 in developed markets, plus a 12-to-24-month ramp before that rep reaches full territory productivity.
Key Facts: Pharma Field-Force Cost Reality
- A single medical rep in a developed market costs $134,000 to $219,000 per year fully loaded as a planning estimate, well above the salary line that typically appears in headcount planning.
- At a $150,000 total rep cost in mature markets, the cost per HCP call runs $115 to $170, meaning a rep visiting a low-prescribing GP at 12 times per year can easily run a net-negative ROI on that account relationship.
- Deloitte research found biopharma reps spend roughly two-thirds of their workday on non-customer-facing tasks, capping productive call time to about one-third of total hours worked.
Revenue Attribution: Connecting Reps to Revenue
Revenue attribution in pharma is genuinely difficult. A doctor doesn't write a prescription because of one visit. Prescribing behavior is shaped by a combination of detailing, sampling, peer influence, patient demand, and habit. Isolating the rep's contribution requires deliberate modeling.
Each requires choosing an attribution model upfront. This is the same decision sales operations teams face when selecting sales forecasting methods: you have to define what counts as field-influenced before you can measure it. The three most practical attribution approaches are:
Territory Contribution Analysis
Compare prescription trends and market share in territories with active, high-quality coverage versus territories where coverage has been inconsistent or a rep has been vacant. The difference in prescribing trajectory over a 6-to-12-month window gives you a field effect estimate. This won't be perfect, but it's better than assuming all sales would exist without the field force.
Prescriber-Level Detailing Correlation
Track whether doctors who receive visits at or above target frequency prescribe at higher rates than those visited below target frequency. Use your CRM data to segment prescribers by call frequency and compare prescribing behavior between segments. A strong correlation between visit frequency and prescribing rate is the most direct evidence of field impact. The pharmaceutical sales growth model framework explains why this correlation operates through demand generation and loyalty levers specifically. Once attribution is established, the next question is which ratios actually govern profitability at the call level.
Sample-to-Script Conversion
For brands where sampling is active, track how often a prescriber who receives samples subsequently writes a prescription within 30 to 60 days. The sample-to-script conversion rate, multiplied by the average prescription value over a patient treatment cycle, gives you the direct ROI on your sampling budget. This is one of the cleanest attribution calculations available in pharma field economics.
What Are the Key Economic Ratios for a Pharma Field Force?
Understanding the pharmaceutical sales KPIs and metrics is important, but field economics lives in the ratios that govern profitability at the visit, territory, and channel level.
Cost Per Call
Cost per call is calculated by dividing the total annual cost of a rep (fully loaded) by the number of productive calls they make per year.
A rep working 220 days per year, making 4 to 6 calls per day, completes 880 to 1,320 calls annually. That call ceiling is partly a function of travel and admin load: research from Deloitte found biopharma reps spend roughly two-thirds of their workday on non-customer-facing tasks. At a total rep cost of $80,000, that's $60 to $90 per call. In developed markets at $150,000 total cost, the range is $115 to $170 per call.
Cost per call benchmarks by customer type vary significantly:
| Customer Type | Avg. Cost Per Call | Notes |
|---|---|---|
| Primary care doctor | $80 - $150 | High frequency, moderate prescribing volume |
| Specialist / consultant | $100 - $200 | Lower frequency, high prescribing volume |
| Pharmacy / drug store | $40 - $80 | Higher call density possible |
| Hospital account | $150 - $350 | Longer call, fewer per day, committee dynamics |
The cost per call calculation makes territory and account prioritization decisions concrete. If calling on a low-prescribing GP costs $120 per visit and that GP writes two prescriptions per month at $15 gross margin each, you need 4 calls to break even on margin from that relationship. If your call plan specifies 12 visits per year to that GP, you're losing money on the relationship before sampling costs.
Revenue Per Rep Per Territory
Total territory revenue (or contribution margin, if you have a product-level profit and loss statement, P&L, by territory) divided by the number of reps covering that territory. This number tells you the baseline productivity of your field deployment. When compared across territories with similar potential, it reveals efficiency gaps: territories where coverage investment is not converting to proportional revenue.
Field Force ROI
At the aggregate level, field ROI is the incremental revenue attributable to field activity divided by total field investment. If your total field cost is $20 million and your revenue attribution model suggests that $80 million of your $120 million revenue is field-driven (the rest coming from market access, marketing pull, and existing prescribing habits), your field ROI is 4x before accounting for direct product costs.
Most commercial teams don't calculate this ratio explicitly. Building it requires making attribution assumptions that are uncomfortable in their imprecision. But the alternative is making headcount decisions without any financial framework at all. The sizing calculation in the next section turns those assumptions into a defensible number.
Field Force Sizing Economics
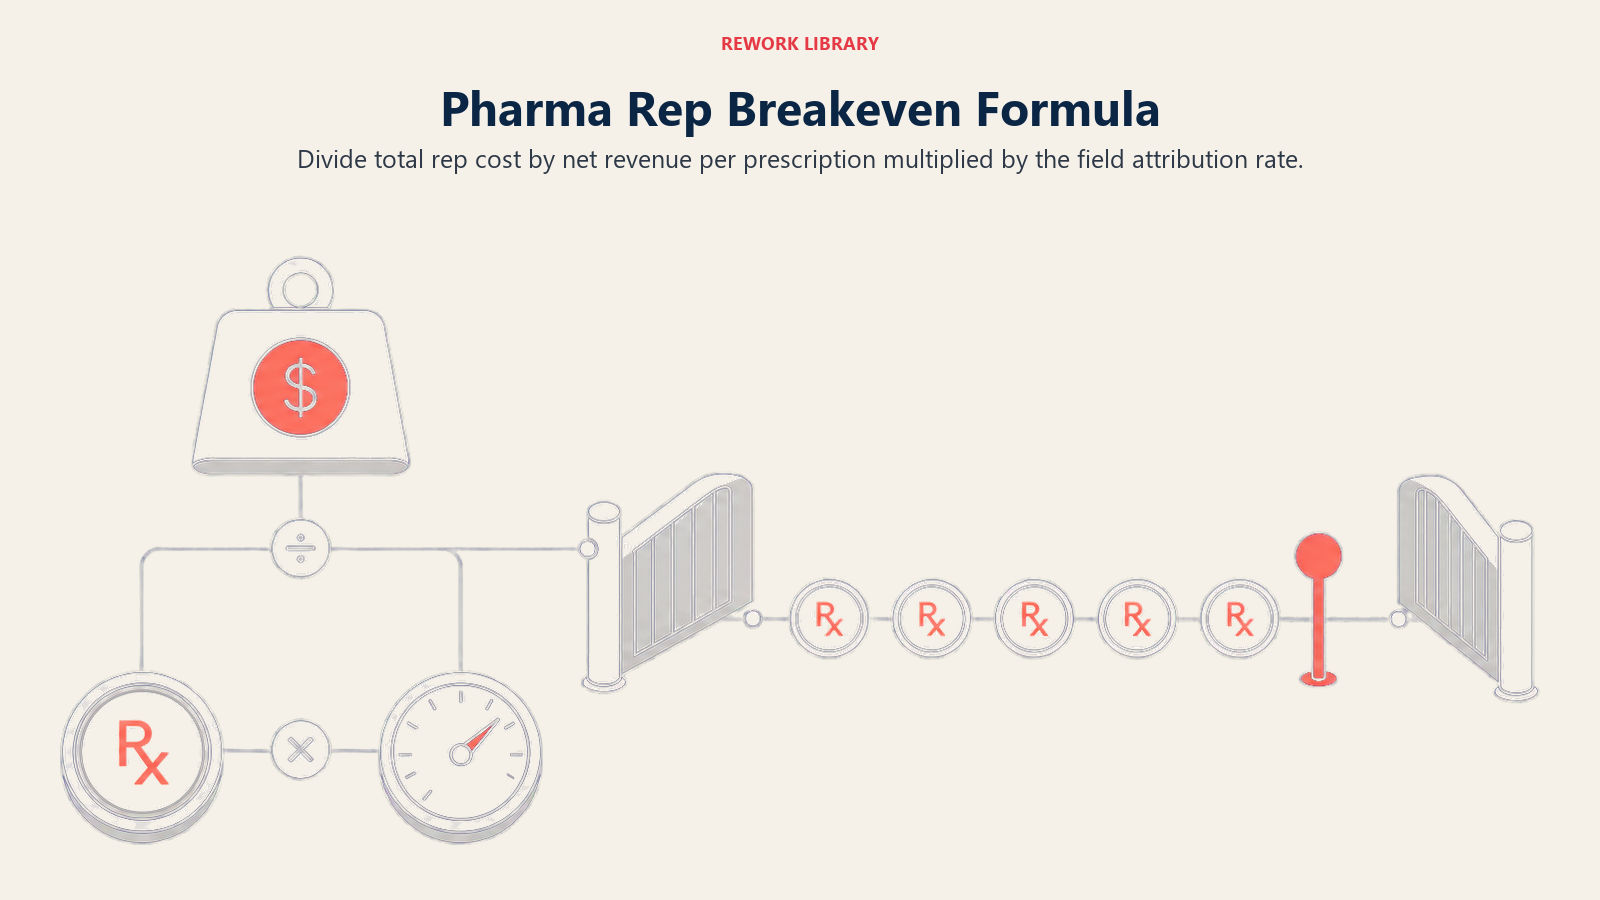
The Breakeven Coverage Formula is the standard tool for answering headcount questions: divide total rep cost by the product of net revenue per prescription and your field attribution rate. The result tells you exactly how many incremental prescriptions a new rep must generate to justify the investment. Used consistently, it converts headcount debates from gut-feel arguments into financially defensible decisions that a CFO can audit.
 The headcount question comes up every planning cycle: should we add reps? Should we cut? The economic framework for answering this is built on a breakeven call calculation.
The breakeven calculation asks: given the cost of one additional rep, how many incremental prescriptions or unit sales need to result from their activity to justify the investment?
Basic formula:
Breakeven prescriptions = Total rep cost / (Avg. net revenue per prescription x Attribution rate)
Example: A rep costs $100,000 per year fully loaded. Net revenue per prescription over a patient treatment cycle is $200. Your attribution model suggests 60% of prescriptions in active territories are field-influenced.
Breakeven prescriptions = $100,000 / ($200 x 0.60) = $100,000 / $120 = 833 incremental prescriptions per year
That's roughly 70 incremental prescriptions per month that the new rep needs to generate. Whether that's achievable depends on the prescribing potential in the available territory, which requires call frequency and coverage optimization analysis before the hire is approved.
When to add headcount: when uncovered or undercovered territories have demonstrably high prescribing potential that current reps can't reach at adequate frequency. The process mirrors sales capacity planning in any revenue function: model the available opportunity, estimate the rep capacity needed to cover it at target frequency, and compare that against current headcount before committing to a hire.
When to optimize instead: when current reps are visiting low-potential accounts at high frequency, and redistributing that effort across the existing footprint would capture the same potential without additional headcount cost.
Channel Mix Impact on Economics
The mix of time your field force spends across pharmacies, doctors, and hospitals has a direct impact on your field economics. Shifting effort from one channel to another changes cost per call, changes revenue attribution patterns, and changes the timeline to revenue realization.
Doctor detailing typically has the highest revenue impact per call but requires longer relationship cycles before prescribing behavior shifts. Pharmacy coverage has lower cost per call and faster sell-through impact but limited direct influence on prescription volume. Hospital selling has the highest cost per call and the longest sales cycle but generates the highest revenue per win.
A commercial team that shifts reps from primary care doctor coverage to pharmacy pull-through activity will typically see faster secondary sales improvement but slower new-to-brand prescription growth. The right mix depends on your brand's maturity stage and where the primary growth constraint sits.
Your territory analytics and sales dashboards should make the channel allocation visible at the rep, manager, and regional level so that channel mix decisions can be managed rather than assumed.
Without an external prescription benchmark, breakeven calculations often rest on internal sell-in data that overstates the real prescription base available to an incremental hire.
Common Economic Mistakes
Over-investing in low-prescribing doctors. The classic field economics error. A call plan that covers every doctor in a geography regardless of prescribing potential spreads rep time across hundreds of low-ROI contacts while high-volume prescribers don't receive adequate frequency. Targeting analysis driven by prescribing data, not geography, is the fix. IQVIA's National Sales and Prescription data covers roughly 90% of the pharma market through wholesaler tracking and is the standard source for this kind of prescriber-level segmentation.
Under-serving high-volume pharmacies. Pharmacy channel investment is often managed separately from HCP coverage and doesn't always receive proportional attention. A pharmacy that sells 200 units per month of your product but receives a rep visit once per quarter has significant pull-through risk: stock gaps, competitor substitution, and pharmacist indifference that bleeds revenue you've already generated at the prescriber level.
Ignoring pull-through costs in the total ROI calculation. Measuring field ROI only on primary sales (sell-in to distribution) overstates commercial effectiveness. Secondary sales (sell-out from pharmacy) is the real revenue signal. If your pull-through costs are high and your sell-in-to-sell-out ratio is weak, your actual field ROI is lower than your primary sales dashboard suggests.
Treating samples as a marketing cost rather than a sales investment. Samples are the single highest-converting sales tool in most pharma field models. But sampling budgets are often set as a percentage of revenue rather than built from a sample-to-script conversion model. Running the conversion calculation by product, by prescriber segment, and by call type turns sampling from a default expense into a managed investment with a calculable return.
Building a Field Economics Dashboard Your CFO Will Trust
A field economics dashboard doesn't need to be complex. It needs to be consistent, honest about its attribution assumptions, and reviewed at the same cadence as financial reporting.
The essential metrics for a CFO-grade field economics view:
- Total field investment (fully loaded, by region)
- Revenue attributable to field activity (by product and channel)
- Cost per call by customer type and region
- Revenue per rep by territory
- Sample-to-script conversion rate by product
- Headcount breakeven by region (incremental prescriptions needed per additional rep)
- Primary vs. secondary sales gap by market
When these numbers live in the same report and are updated monthly, headcount decisions move from intuition to analysis. The CFO can see the return on the field investment, the commercial director can see where the ROI is strongest and weakest, and the conversation shifts from "we need more reps" to "here's where additional coverage is economically justified."
Frequently Asked Questions about Pharma Field Sales Economics
What is the true fully loaded cost of a pharma medical rep?
The fully loaded cost includes salary, incentive compensation, vehicle and travel, samples and promotional materials, CRM and device costs, training, management overhead, and employer tax and benefits contributions. As a planning benchmark, emerging markets commonly run in the range of $54,000 to $98,000 per year; developed markets typically run $134,000 to over $200,000. Salary alone is usually 40 to 50% of that total, so headcount decisions based only on salary lines systematically underestimate the real investment.
How do you calculate cost per call for a pharma rep?
Divide the rep's total annual cost (fully loaded) by the number of productive calls they complete in a year. A rep working 220 days and making 4 to 6 calls per day completes 880 to 1,320 calls annually. At $80,000 total cost in an emerging market, that's $60 to $90 per call. In developed markets at $150,000 total cost, the range rises to $115 to $170 per call. Cost per call makes account prioritization decisions financially concrete.
What is the breakeven calculation for adding a new pharma rep?
Divide the rep's total annual cost by the product of net revenue per prescription and your field attribution rate. For example: $100,000 cost, $200 net revenue per prescription, 60% attribution rate gives a breakeven of 833 incremental prescriptions per year, or roughly 70 per month. Whether the available uncovered territory has that prescribing potential is the key question before any hire is approved.
What is the difference between field ROI and revenue per rep?
Revenue per rep is total territory revenue divided by rep count, a productivity ratio that reveals coverage efficiency. Field ROI is the incremental revenue attributable to field activity divided by total field investment, a return calculation that requires making explicit attribution assumptions. Both matter, but field ROI is the more useful metric for CFO-level conversations because it answers whether the field force earns more than it costs.
Why is secondary sales a more reliable metric than primary sales for field ROI?
Primary sales (sell-in) measures units invoiced to distributors and pharmacies. Secondary sales (sell-out) measures units actually dispensed to patients. Measuring field ROI on primary sales overstates commercial effectiveness when channel inventory loading is present. A field force that achieves high sell-in but poor sell-out is building distributor inventory, not market share. Secondary sales corrects for this and gives a cleaner picture of real field impact.
When should a pharma company optimize its existing field force instead of adding headcount?
Optimize when current reps are spending significant time on low-potential accounts, or when territory designs are misaligned with account potential distributions. If redistributing existing coverage would unlock high-potential accounts that aren't receiving adequate frequency, that's a territory and targeting fix, not a headcount problem. Adding reps before fixing coverage patterns means the new reps inherit the same inefficiency. Channel mix choices, explored next, have their own direct impact on the economics.
How should sampling budgets be set in a field economics model?
Sampling budgets work best when built from sample-to-script conversion data rather than set as a percentage of revenue. Track how often a prescriber who receives samples subsequently writes a prescription within 30 to 60 days. Multiply that rate by the average prescription value over a patient treatment cycle to get the direct ROI per sample unit. This turns sampling from a default expense into a managed investment with a calculable return per dollar spent.
Learn More

Senior Implementation Consultant