Prescription-to-Pharmacy Pull-Through Alignment: Closing the Demand-Supply Gap in Pharma Field Operations
Turn this article into takeaways for your work.
Each assistant summarizes the article only for you and suggests best practices for your work.
A doctor writes the script. The patient walks to the pharmacy. The pharmacist checks the shelf and says, "Sorry, we're out." The patient leaves with a competitor brand substituted or, worse, walks out without any medicine at all.
That moment costs your company a sale that your medical rep spent weeks building. It's not a supply chain failure in isolation. It's an alignment failure. Two halves of the same revenue engine were never designed to talk to each other.
Pull-through alignment, getting Rx demand and pharmacy stock synchronized in the same territory at the same time, is one of the most important operational priorities in pharma commercial. And it's consistently underinvested. Most pharma organizations manage prescription demand and stock availability as separate functions: separate reporting lines, separate KPIs, and separate weekly meetings. The gap between those two worlds is where revenue disappears.
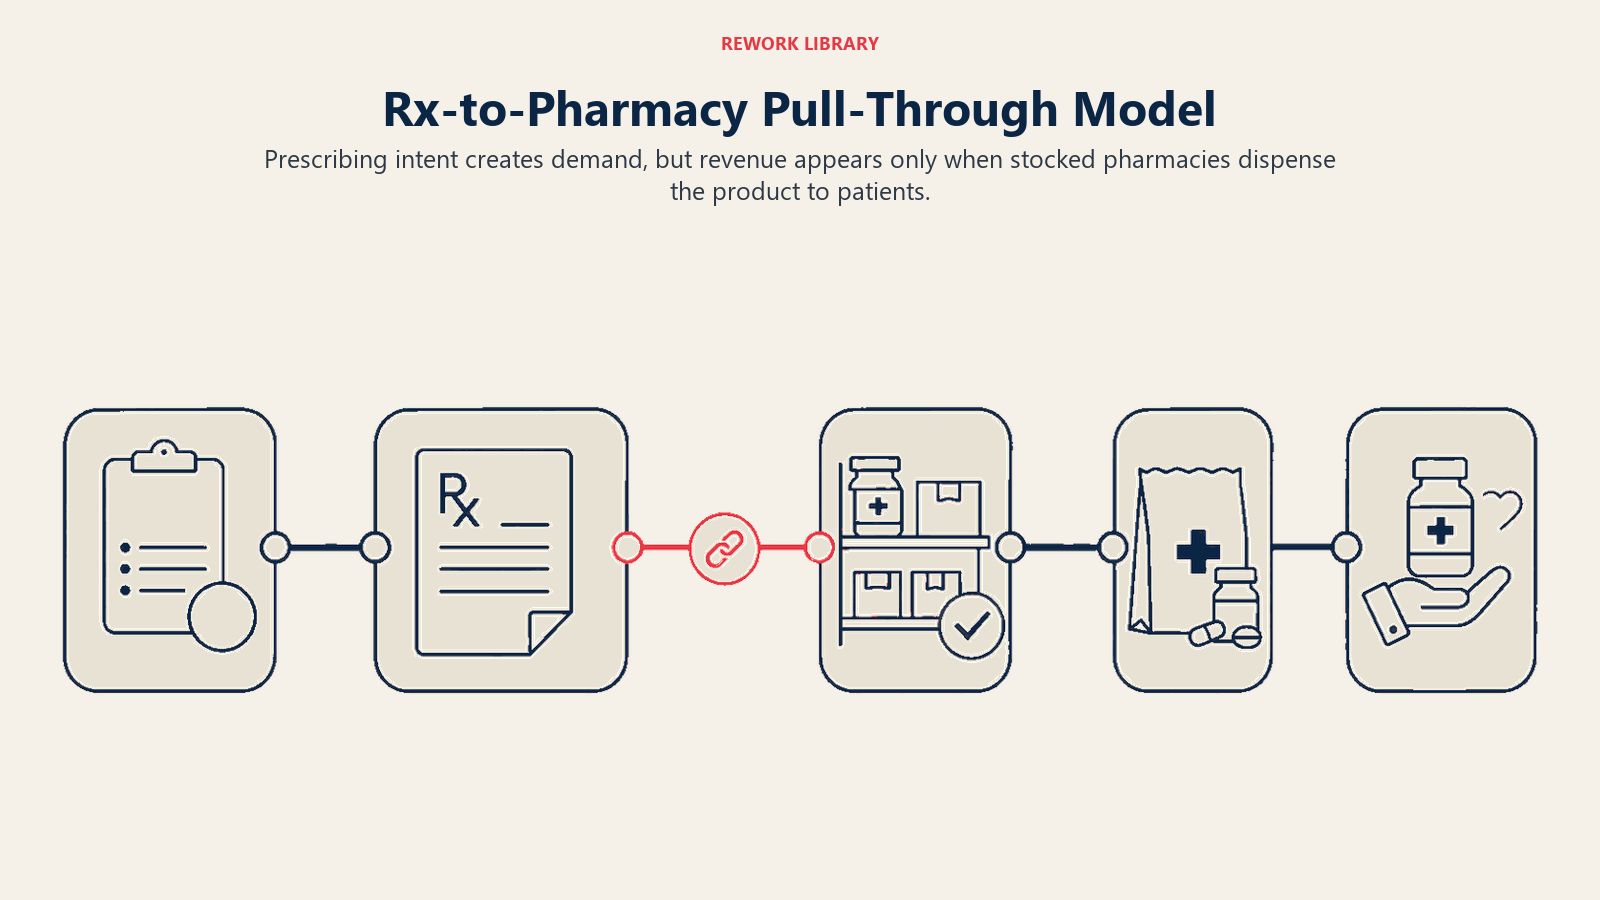
The Rx-to-Pharmacy Pull-Through Model Explained
Pull-through describes the sequence from prescription to patient purchase: a doctor's prescribing decision generates demand (the "pull"), and that demand is fulfilled when the product is on the pharmacy shelf (the "push"). When both sides work in sync, every prescription converts to a dispensed unit and a captured sale. When they don't, you generate demand you can't fulfill.
Key Facts: Pull-Through Alignment
- Roughly one in four patients does not fill a written prescription within 90 days, based on research on prescription fill rates for chronic medications (PMC, 2018: https://pmc.ncbi.nlm.nih.gov/articles/PMC6221733/).
- When a pharmacy is out of stock, therapeutic substitution is far more common than waiting: patients who cannot fill their prescription often accept whatever the pharmacist substitutes, and many do not return to the original brand (PMC, 2018: https://pmc.ncbi.nlm.nih.gov/articles/PMC10397711/).
- Deloitte's research on pharma commercial model transformation found that operating with distinct subfunction roles and investment strategies "can lead to fragmented investments that tend to optimize return on investment at the subfunction level, often at the expense of the enterprise," leaving each team optimizing its own metrics while overall commercial performance suffers (Deloitte Insights, 2025: https://www.deloitte.com/us/en/insights/industry/health-care/future-of-commercial-in-pharma.html).
The demand side is the domain of your medical reps and medical science liaisons (MSLs). They build relationships with health care professionals (HCPs), communicate clinical evidence, position your brand in the prescribing decision, and generate what the industry calls primary demand: the intention to prescribe. This work is invisible to the pharmacy system. A script written in a clinic is not a data point that automatically triggers a replenishment order at the chemist down the street.
The supply side is the domain of your pharmacy reps and trade/distribution teams. They negotiate shelf space, manage stock levels, process orders, and ensure that when a patient presents a prescription, the product is physically available. This work happens in a completely different customer relationship, often managed by a different sales force, measured by a different set of KPIs, and reviewed in a different meeting.
That structural separation is the root cause of the pull-through gap.
Why the Two Sides Operate on Different Cycles
Medical reps plan their HCP visits on a call frequency model: see the highest-decile prescribers most often, run through the promotional message, and aim for a script commitment or a favorable mention in the next prescribing decision. The outcome is measured in prescription volume, and the feedback loop is slow, typically 30-90 days through prescription audit data.
Pharmacy reps work on a stock and order cycle tied to distributor replenishment windows, which can be weekly, bi-weekly, or monthly depending on the geography and the distributor relationship. Their KPIs center on fill rates, shelf share, and order compliance. They have no reliable signal telling them that the medical rep two territories over just ran a successful detailing blitz and is about to generate a surge in demand.
The result is a systematic mismatch. Demand spikes when field detailing is intensive. Stock levels don't respond because the pharmacy side has no early-warning system. Prescriptions go unfilled. The medical rep's effort converts to nothing, and the patient relationship with the pharmacist may result in a therapeutic substitution that is difficult to reverse once the patient has established a new refill routine.
Where Alignment Breaks Down: Common Failure Points
The failure modes are predictable. Understanding them is the first step to closing the gap.
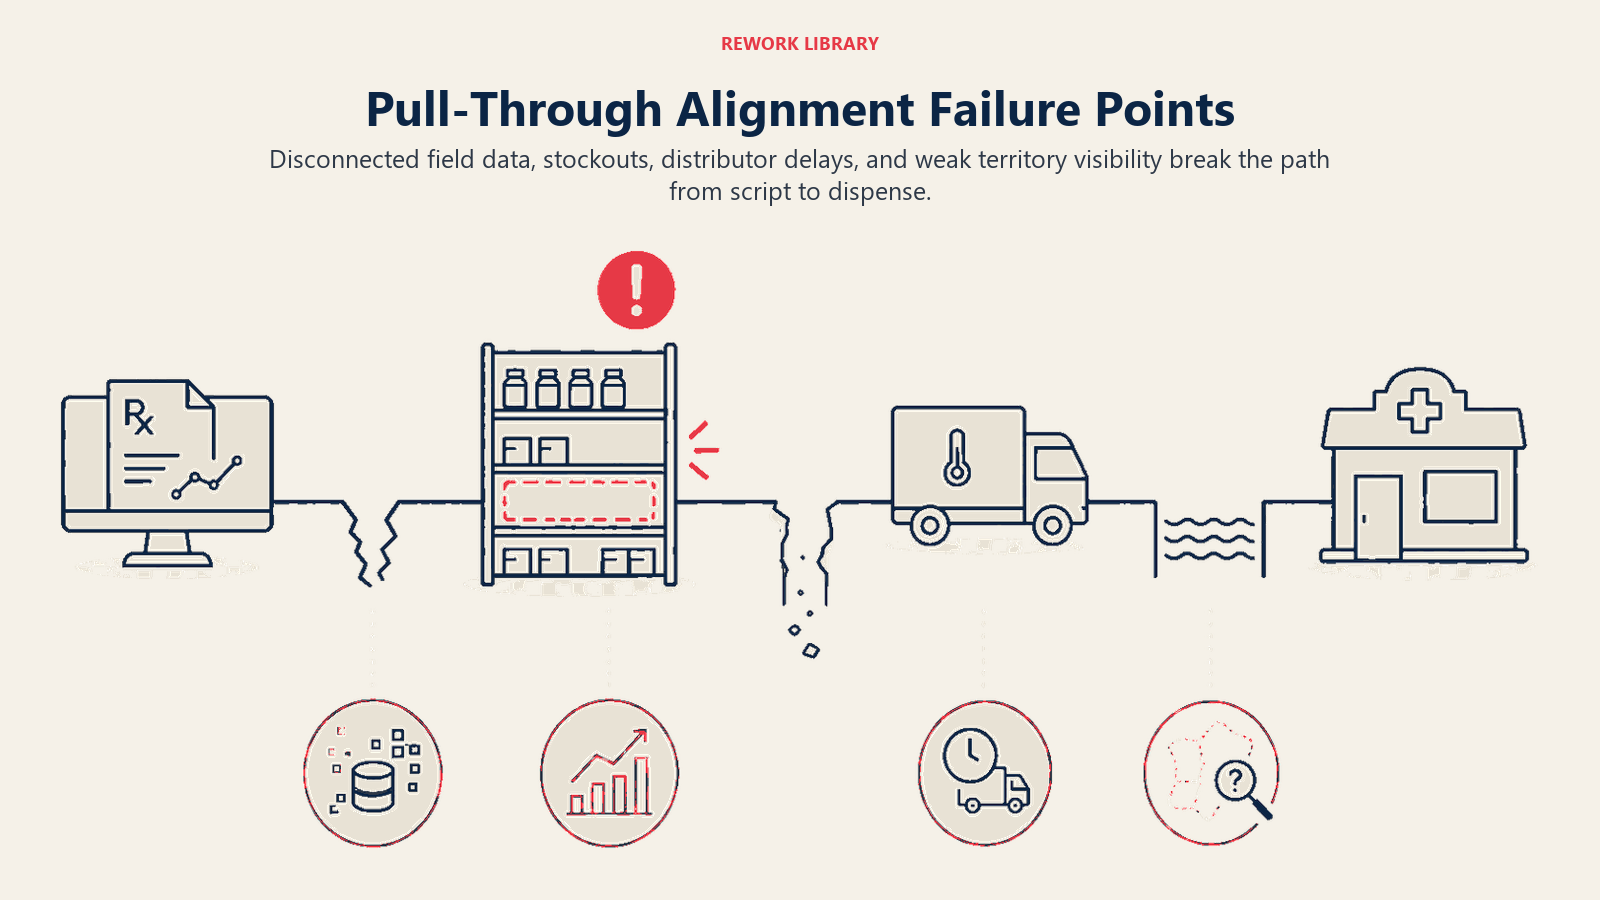
Failure 1: Parallel field forces with no shared intelligence. The medical rep visits the doctor and records the call in the CRM. The pharmacy rep visits the chemist and records stock levels in a separate system. Neither rep knows what the other is doing in the same territory. No one is asking: "Are we detailing into a stocked territory right now?"
Failure 2: Stock-out during peak detailing windows. The brand team runs a promotional push, the medical reps increase call frequency, HCPs start prescribing at a higher rate, and the pharmacies haven't been pre-loaded with inventory to handle the surge. The stock-out happens at exactly the moment demand is highest. This is the most expensive version of the alignment failure because you've paid for the demand generation and received nothing for it.
Failure 3: Distributor lag between field order and shelf replenishment. Even when the pharmacy rep places a replenishment order promptly, distributor lead times can be three to seven days in many markets. If the medical rep is actively detailing during that window, you're generating prescriptions that can't be filled before the stock arrives.
Failure 4: No pull-through diagnostic at the territory level. Most pharma organizations can measure primary sales (shipments from manufacturer to distributor) reasonably well. Far fewer have clean, timely data on secondary sales (distributor to pharmacy) and almost none can see tertiary sales (pharmacy to patient) at territory level in real time. Without that three-tier visibility, you can't diagnose where the breakdown is occurring.
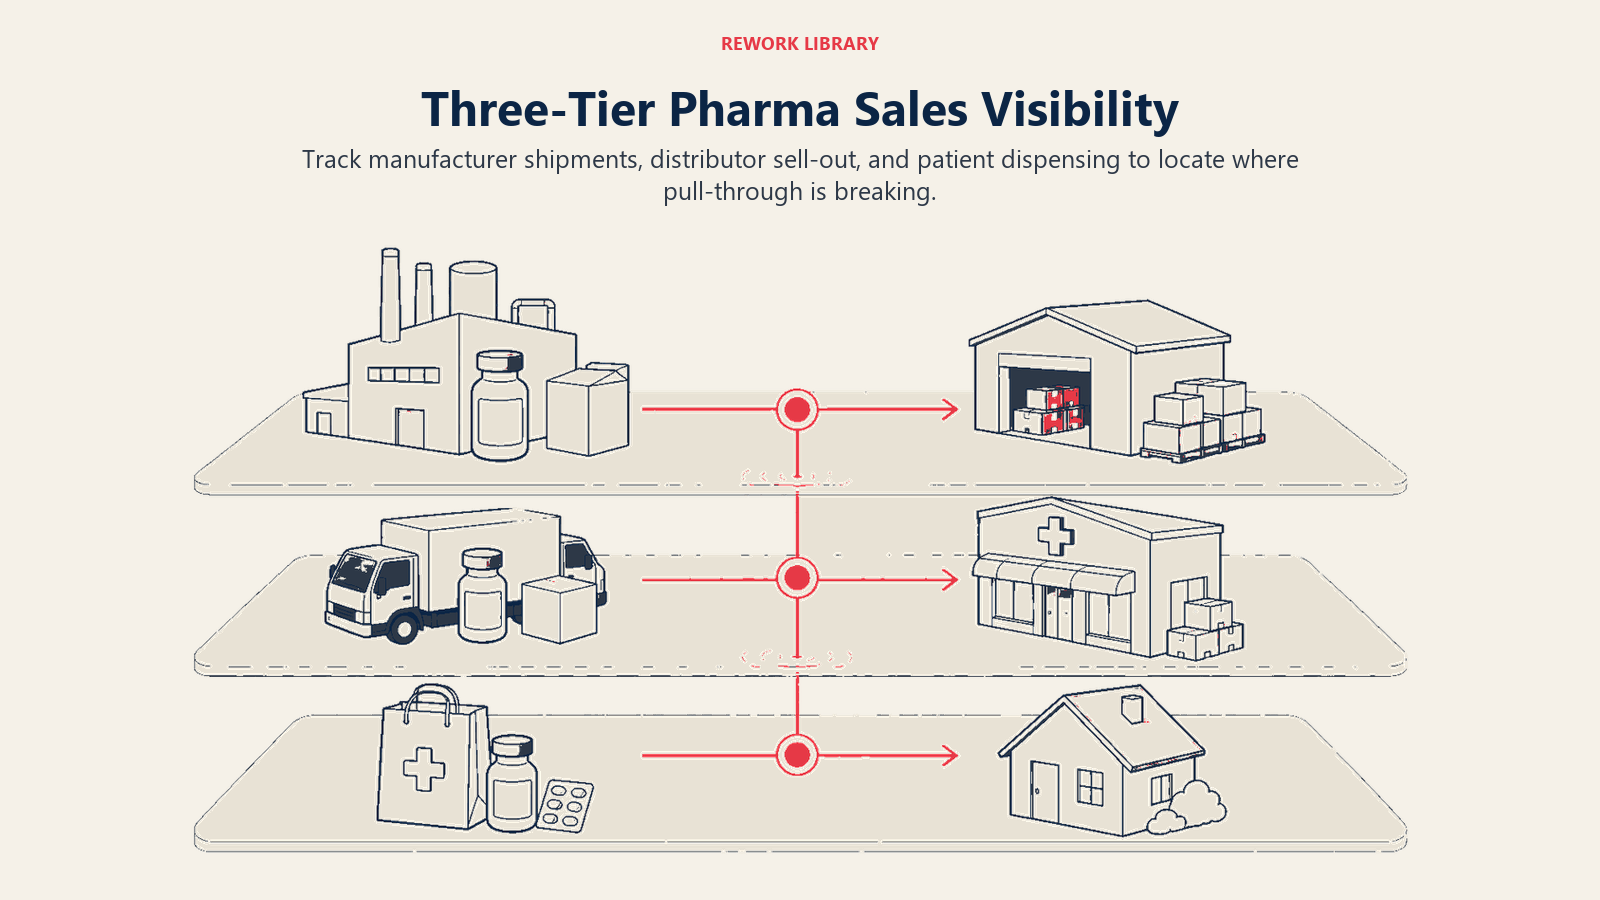
The Pull-Through Tracking Framework: Three-Tier Sales Visibility
The foundational requirement for pull-through alignment is a three-tier sales tracking model that connects prescription demand to physical dispensing. The pharmaceutical distribution chain runs from manufacturer through wholesale distributors to retail pharmacies, and pull-through data gaps mirror each handoff in that chain.
| Sales Tier | From | To | What It Measures | Typical Data Source |
|---|---|---|---|---|
| Primary sales | Manufacturer | Distributor | Product shipped into distribution channel | Company ERP / distributor invoices |
| Secondary sales | Distributor | Pharmacy / chemist | Product reaching the pharmacy shelf | Distributor sell-out reports |
| Tertiary sales | Pharmacy | Patient | Actual dispensing, closest proxy to Rx fulfillment | IQVIA/IMS prescription data; pharmacy POS where available |
Most pharma organizations have reasonable primary sales visibility. Secondary sales data is patchy and often delayed. Tertiary sales require third-party prescription data and may have a 4-8 week lag in many markets. Research on prescription fill rates for chronic medications shows that roughly one in four patients does not fill a prescription within 90 days, which means tertiary data gaps hide a material share of demand that never converts.
The pull-through gap lives between secondary and tertiary. When secondary sales (pharmacy orders from distributor) are not keeping pace with tertiary sales (actual dispensing rates driven by prescriptions), a stock-out is imminent or already occurring. The measurement task is to close that gap in data visibility so field teams can see the problem in time to act.
Key pull-through diagnostic metrics by territory:
| Metric | Definition | Target Signal |
|---|---|---|
| Script velocity | Rx volume per territory per week (from Rx audit or CRM proxy) | Trending up: increase pharmacy stock alerts |
| Stock depth | Units on hand at pharmacy level in territory | Below safety stock: trigger emergency order |
| Secondary fill rate | Distributor orders fulfilled vs. requested | Below 95%: distributor constraint identified |
| Pull-through ratio | Tertiary units dispensed / primary units shipped | Declining trend or ratio well below historical baseline: channel inventory building without dispensing |
| Stock-out incidence | Pharmacy visits where product unavailable / total visits | Above 5%: territory alignment crisis |
See also: Secondary Sales Tracking and Pull-Through for the full data architecture behind this model.
Cross-Functional Roles and Responsibilities
Pull-through alignment requires four functions to share intelligence and act on a common signal. This table defines what each role owns and where handoffs occur.
| Function | Pull-Through Responsibility | Signal They Generate | Who Receives It |
|---|---|---|---|
| Medical rep | Prescription demand generation; early warning of HCP prescribing intent shifts | Call report indicating script commitments and prescribing momentum | Sales ops, pharmacy rep team lead |
| Pharmacy rep | Stock availability at point of dispensing; reorder triggers when safety stock breached | Pharmacy order and stock management reports; stock-out flags | Distributor, trade team, sales ops |
| Sales operations | Secondary sales data pull; territory-level pull-through score calculation; cross-team reporting | Weekly pull-through dashboard by territory | Commercial leadership, field managers |
| Distribution/trade | Distributor relationship management; replenishment scheduling aligned with detailing calendar | Distributor fill rates; delivery lead times by geography | Pharmacy rep team lead; sales ops |
The critical handoff that most organizations miss: the medical rep's detailing calendar must be visible to the pharmacy rep covering the same territory. Not necessarily in real time, but weekly. A medical rep planning a high-frequency detailing push to five key prescribers in a district should trigger a pharmacy rep stock check in that district's top five dispensing pharmacies before the push begins.
This is not complex. It requires a shared territory mapping, a weekly cross-team communication cadence, and a rule: "If detailing intensity goes up in a territory, stock depth goes up first."
For the full trade partnership model that supports this, see Sales and Distribution Trade Alignment.
Cadence and Governance: The Weekly Pull-Through Review
Pull-through alignment is not a strategic initiative. It's an operational habit. The mechanism that sustains it is a structured weekly review meeting that brings the right data to the right people at the right cadence. The same principle that drives forecast governance in revenue operations applies here: a fixed cadence, shared data, and clear decision rights prevent the slow drift where everyone knows the number is wrong but nobody owns correcting it. Deloitte's research on pharma commercial model transformation found that when commercial subfunctions operate with distinct investment strategies, organizations commonly optimize at the subfunction level at the expense of the enterprise, leaving each team hitting its own targets while overall pull-through suffers.
Weekly Pull-Through Review: Recommended Structure
| Agenda Item | Owner | Duration | Output |
|---|---|---|---|
| Territory pull-through scorecard review | Sales ops | 15 min | List of territories below pull-through threshold |
| Stock-out alerts and recovery plan | Pharmacy rep manager | 10 min | Emergency order actions assigned |
| Detailing calendar for the coming week | Medical rep manager | 10 min | Territories with high detailing intensity flagged for pharmacy team |
| Distributor fill rate and lead time update | Trade/distribution lead | 10 min | Constraints identified; mitigation scheduled |
| Pull-through score trend and escalations | Commercial director | 5 min | Escalations to leadership if chronic stock-outs persist |
Total time: 50 minutes. Attendance: medical rep field manager, pharmacy rep field manager, sales ops lead, trade/distribution representative. The commercial director chairs and decides escalations.
The output of this meeting is not a report. It's a set of actions: stock pre-loads scheduled, emergency orders placed, detailing calendars adjusted where stock cannot be pre-loaded in time. The meeting only works if actions from the prior week are reviewed at the top.
Connecting Pull-Through to Marketing Execution
Pull-through alignment doesn't stop at the field level. It requires marketing and field sales alignment so that campaign timing, promotional pushes, and product launches are sequenced against confirmed stock availability in target territories.
A product launch that sends medical reps into the field before the distributor has loaded pharmacies in their territories is not a launch. It's an exercise in demand generation that the supply chain isn't ready to fulfill. The brand team's campaign calendar and the trade team's distribution schedule need to be synchronized at least four weeks in advance for any major promotional push.
The practical test before any field acceleration: "Is the stock there?" If the pharmacy rep network can't confirm stock depth at the top 20% of pharmacies by volume in each territory, the medical detailing intensity should not increase. This seems obvious. In most pharma organizations, it's not a formal gate. Making it one is what turns pull-through alignment from theory into a measurable KPI.
The Pull-Through Score: A Single KPI for Shared Accountability
The most effective organizational mechanism for sustaining pull-through alignment is a single, visible pull-through score that all three field forces, medical reps, pharmacy reps, and trade teams, can see and are held accountable for.
A pull-through score at its simplest:
Pull-Through Score = (Tertiary units dispensed in territory / Primary units shipped to territory in the same period) x 100
As a starting point for calibration: a score in the mid-80s or above typically indicates the channel is clean, with most of what you're shipping reaching patients. A score that falls toward 70 or below warrants investigation, as it often signals inventory building in the channel without converting to patient dispensing. These thresholds are illustrative; the right alert levels will depend on your therapy area, product lifecycle stage, and historical baseline. Track direction and trend rather than treating any single threshold as a universal standard.
The score becomes a shared KPI when it appears in every field manager's weekly dashboard alongside rep-level metrics. When the medical rep manager sees that their territory's pull-through score is low, they ask the pharmacy rep manager what's happening with stock. When the pharmacy rep manager sees the score rising, they know the medical rep team is generating prescriptions that need inventory support.
The pull-through score works because it can't be gamed by one team alone. You can't increase it by prescribing more if the pharmacy is out of stock. You can't increase it by loading more inventory if prescriptions aren't being written. It forces both halves of the revenue engine to work in sync. That's what makes it the right shared KPI for this kind of cross-functional accountability.
Conclusion: Rx Pull and Stock Push Are Two Halves of One Revenue Engine
The prescription-to-pharmacy pull-through gap is not a supply chain problem, not a sales execution problem, and not a marketing problem. It's a coordination problem between functions that were designed to work in parallel and need to be redesigned to work together.
The organizations that close this gap share three characteristics. First, they have three-tier sales visibility: primary, secondary, and tertiary data that gives them a real-time picture of the channel. Second, they run a weekly pull-through review that brings medical, pharmacy, trade, and sales ops into the same conversation with the same data. Third, they measure pull-through as a shared KPI that creates accountability across all teams, not just for individual field forces.
A shared pull-through score doesn't just track performance. It changes the conversation. Instead of "why aren't the prescriptions converting?" and "why isn't the stock there?" you get one question every week: "What's our pull-through score, and what are we going to do about it?"
That single question is worth more than a hundred field reports filed separately.
Frequently Asked Questions about Prescription-to-Pharmacy Pull-Through Alignment
What is pull-through alignment in pharma field operations?
Pull-through alignment means synchronizing prescription demand generated by medical reps with pharmacy stock availability managed by pharmacy reps, so that every script written by an HCP can be dispensed when the patient presents. The gap between these two sides is where demand is generated but revenue is lost, usually invisible to commercial teams who measure primary sales but not secondary or tertiary dispense rates.
Why do medical rep and pharmacy rep cycles create a pull-through gap?
Medical reps work on a 30-90 day feedback loop tied to HCP call frequency and prescription audit data. Pharmacy reps work on a weekly or bi-weekly stock and order cycle tied to distributor replenishment windows. Neither side has automatic visibility into the other's activity. When a medical rep runs a detailing push, the pharmacy side has no early warning system to pre-load stock in the affected territory.
What are the three tiers of pharma sales and why do all three matter for pull-through?
Primary sales measure manufacturer-to-distributor shipments, secondary sales measure distributor-to-pharmacy deliveries, and tertiary sales measure pharmacy-to-patient dispenses. Pull-through requires all three to stay in sync. A gap between primary and secondary indicates distributor inventory building. A gap between secondary and tertiary indicates pharmacy accumulation without patient demand. Each failure type requires a different commercial response.
What is a pull-through score and how is it calculated?
A pull-through score is calculated as tertiary units dispensed in a territory divided by primary units shipped to that territory in the same period, multiplied by 100. A score in the mid-80s or above typically indicates a healthy channel where most shipped product is reaching patients. A score trending toward 70 or below warrants investigation and often signals channel inventory building without conversion, pharmacy accumulation, stockouts at dispense, or a patient fill-rate problem. The right alert thresholds will vary by therapy area and product lifecycle stage; treat these numbers as a calibration starting point rather than fixed industry standards.
What should happen before a medical rep runs a high-frequency detailing push?
Before any significant increase in detailing intensity, the pharmacy rep network should confirm stock depth at the top 20% of pharmacies by volume in the relevant territory. If stock cannot be confirmed, the medical detailing calendar should be adjusted or delayed. The formal test is simple: "Is the stock there?" This gate is not standard in most pharma organizations but represents one of the highest-leverage changes a commercial operations team can make.
How do you run a weekly pull-through review meeting?
The meeting should cover five items: territory pull-through scorecard review by sales ops to identify accounts below threshold; stock-out alerts and recovery plans owned by the pharmacy rep manager; detailing calendar for the coming week flagged by the medical rep manager for pharmacy pre-loading; distributor fill rate and lead time update from the trade team; and trend escalations chaired by the commercial director. Total runtime is under 60 minutes. The output is a set of specific actions, not a report.
What makes the pull-through score effective as a shared KPI?
The pull-through score cannot be gamed by either field force in isolation. Increasing detailing intensity raises prescriptions but cannot increase the score if pharmacies are out of stock. Loading more pharmacy inventory raises availability but cannot increase the score if prescriptions are not being written. It creates genuine cross-functional accountability because both teams must perform for the number to move.
Learn More

Senior Implementation Consultant
On this page
- The Rx-to-Pharmacy Pull-Through Model Explained
- Why the Two Sides Operate on Different Cycles
- Where Alignment Breaks Down: Common Failure Points
- The Pull-Through Tracking Framework: Three-Tier Sales Visibility
- Cross-Functional Roles and Responsibilities
- Cadence and Governance: The Weekly Pull-Through Review
- Connecting Pull-Through to Marketing Execution
- The Pull-Through Score: A Single KPI for Shared Accountability
- Conclusion: Rx Pull and Stock Push Are Two Halves of One Revenue Engine
- Learn More