Call Frequency and Coverage Optimization: Visiting the Right Accounts at the Right Cadence
Turn this article into takeaways for your work.
Each assistant summarizes the article only for you and suggests best practices for your work.
Picture a rep who is in the field five days a week, hitting 30 accounts before Friday afternoon, logging every visit faithfully into the CRM. At the end of the quarter, she's below target. Her manager checks the data and finds the problem in under a minute: she's visiting C-tier drug stores at the same cadence as her top-two chain pharmacies. Quantity is up. Productivity is down.
Call frequency looks like an operational detail. It isn't. It's a resource allocation decision that shapes everything downstream: how many scripts get written, how strong pharmacy shelf position holds, and whether your most productive HCPs see your rep often enough to stay loyal to your brand. When frequency is set by habit or by how the previous rep organized the route, the field force leaks performance every single day without anyone noticing until the quarterly review.
Why Frequency Matters More Than Volume
Key Facts: Call Frequency and Coverage
- Pharmaceutical field force research consistently finds that call quality, not call count, predicts prescribing behavior change in health care professionals (HCPs).
- As a planning benchmark, reps in dense urban territories may complete 12 to 14 face-to-face calls per day; rural reps with long drives between stops typically manage 7 to 9, a gap that makes territory sizing decisions critical before any frequency target is set.
- Coverage gaps at A-tier accounts create a competitive risk: the longer the gap, the more time competitor reps have to fill the relationship vacuum, making recovery speed a commercial priority.
The instinct in many pharma commercial teams is to maximize call volume. If 20 visits a day is good, 25 must be better. But call quality degrades as reps stretch thin. A rep rushing to hit a visit count skips the stock check, shortens the clinical conversation to a brochure hand-off, and leaves before the pharmacist has actually committed to an order.
Research across field-force effectiveness programs consistently shows that call quality, not call count, predicts prescribing change. Research on physician-industry interactions, including a systematic review published in PLOS ONE, found that rep contact influences prescribing attitudes, but the direction of that influence depends heavily on the quality and relevance of each engagement. A 90-second detail built around the right patient type and a specific trial result moves behavior. Five minutes of social chat with a product mention at the end doesn't. When a rep spreads visits too thin, every interaction drops toward the second category.
There's also a physician fatigue effect. An HCP who sees the same rep three times in two weeks with no new clinical message stops listening. The visit is logged. The prescription doesn't follow. Optimal frequency for HCPs is typically tied to the depth of clinical engagement, not a fixed calendar rhythm.
The discipline is to concentrate visits where they drive incremental value, and pull frequency back where accounts are stable, loyal, or genuinely low-potential. That's not abandoning accounts. It's managing territory as a portfolio.
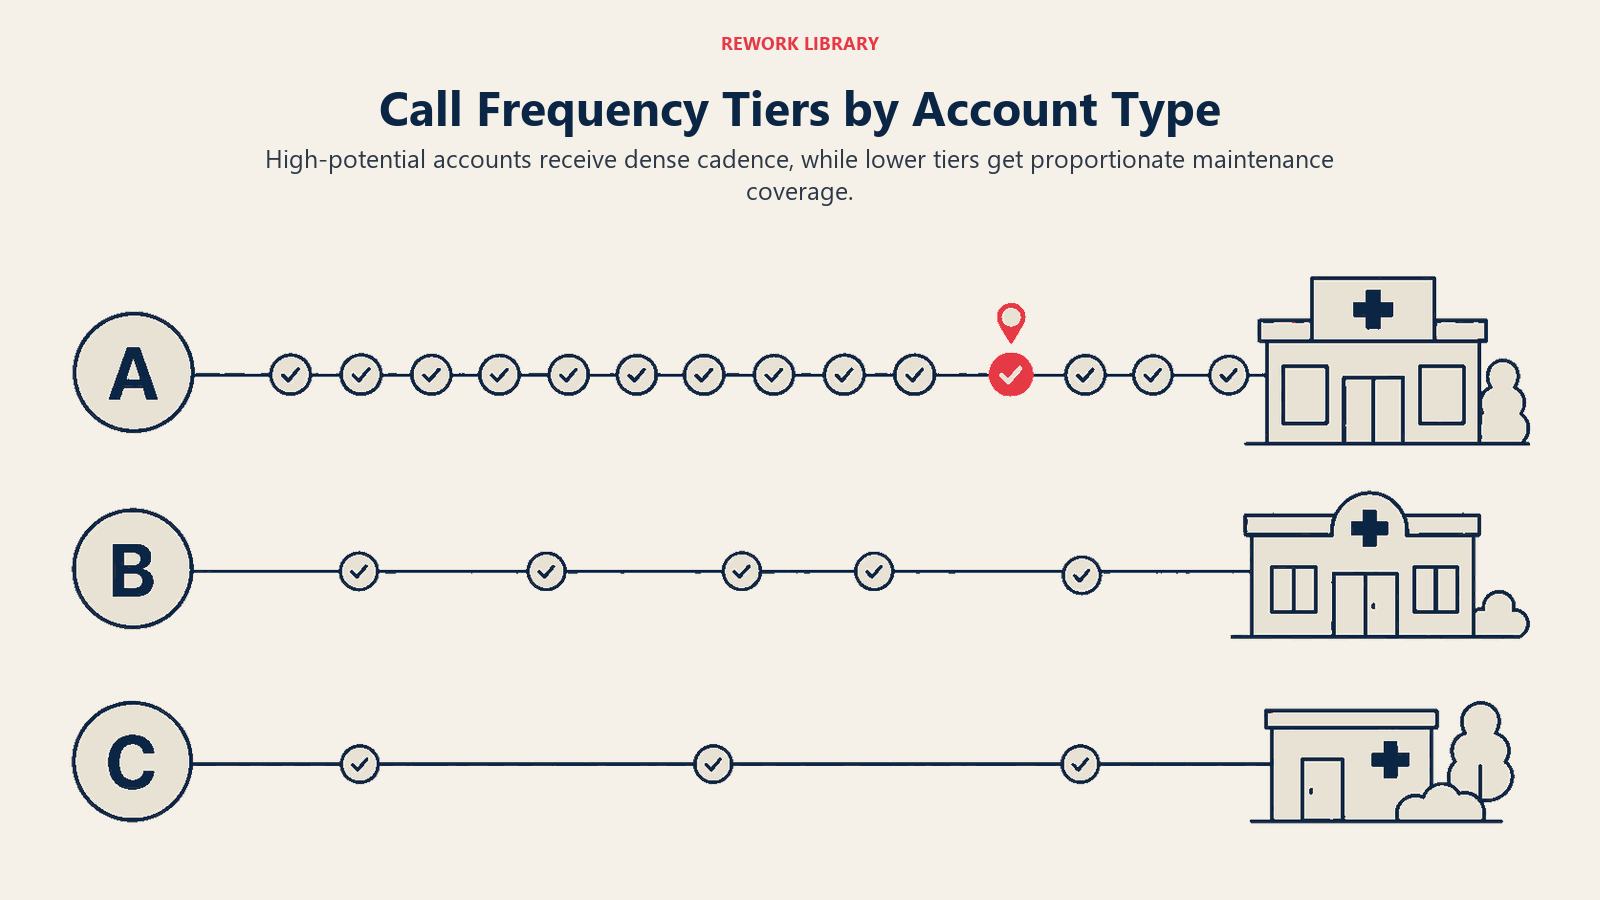
Frequency Tiers by Account Type
Every territory contains a mix of account types, and each type has an evidence-backed frequency range that maximizes return without wasting rep hours.
| Account Tier | Account Profile | Recommended Cadence | Rationale |
|---|---|---|---|
| A1 Pharmacy | High-volume chain outlet, top 10% of territory scripts | Weekly | Competitor reps visit weekly; losing facing or stocking position costs volume fast |
| A2 HCP | High-prescriber specialist or active GP with 10+ monthly scripts | Fortnightly | Clinical conversations need renewal; prescribing habits shift within four weeks if not reinforced |
| B Pharmacy | Mid-volume independent with consistent reorder | Fortnightly | Stable enough that weekly visits add friction, not value |
| B HCP | Moderate prescriber, positive toward the brand | Monthly | Relationship maintained without over-exposure; leave-behind does maintenance work between visits |
| C Pharmacy | Low-volume drug store, slow-moving product lines | Monthly or quarterly | Visit cost exceeds revenue contribution if called more often |
| C HCP | Low prescriber, competing specialty, or competitor-loyal | Quarterly, or drop-and-monitor | Opportunity cost of holding the slot is real |
These aren't arbitrary buckets. They represent the output of a segmentation exercise that the customer segmentation and targeting process should already have run. If segmentation hasn't been done, or was done more than 12 months ago, frequency decisions are being made on guesswork. For the HCP tier specifically, this segmentation overlaps heavily with the concept of an ideal customer profile: defining the precise attributes of accounts worth prioritizing before any call plan is built.
One caveat: new accounts don't fit neatly into this grid. A pharmacy that just opened or an HCP that just joined a practice may look like a C account on historical data but warrant A-tier frequency during the activation window. Build a separate onboarding cadence (typically six weeks of weekly visits) before settling into steady-state frequency.
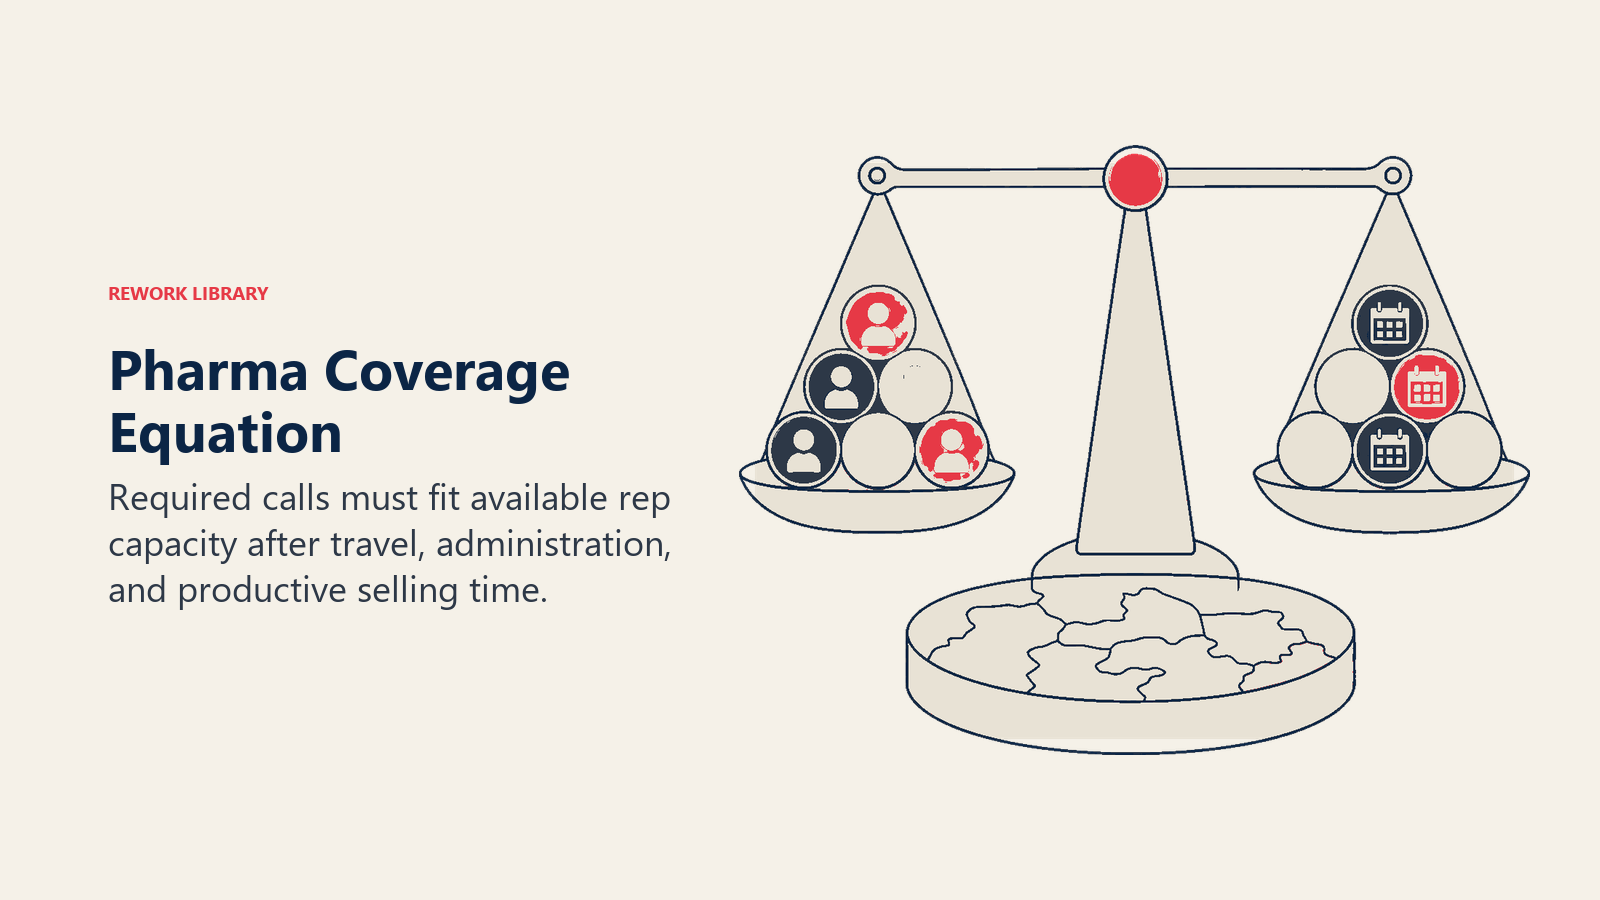
The Coverage Equation
Every rep has a finite call capacity. The coverage equation makes that limit explicit.
Daily call capacity depends on your territory geography, average call duration, and drive time between accounts. The table below shows representative planning benchmarks; your actual numbers depend on local geography and account density.
Monthly available visits is daily capacity multiplied by working days in the month, then reduced for training days, national meetings, and regional events. A typical field rep has 18 to 20 actual field days per month after those deductions.
| Territory Type | Avg. Daily Calls | Field Days/Month | Monthly Capacity |
|---|---|---|---|
| Dense urban | 13 | 19 | 247 |
| Mixed suburban | 10 | 19 | 190 |
| Rural/regional | 8 | 18 | 144 |
Now stack your account frequency requirements against that capacity. If a rep's territory holds 40 A1 accounts (weekly), 60 B accounts (fortnightly), and 80 C accounts (monthly), the required visits per month are 160 + 120 + 80 = 360. For a suburban rep with 190 monthly call capacity, that's a 170-visit gap. Either the territory needs to be re-zoned, some C accounts need to move to quarterly, or the rep is going to fail coverage before the month ends.
Running this equation once per quarter, and every time territory boundaries shift, is basic field-force hygiene. Most organizations that run this math for the first time discover that a meaningful share of their territories carry structural coverage gaps that no amount of rep effort can close. The answer isn't to push harder. It's to fix the math and the beat and route journey planning that follows. The same capacity modeling discipline that revenue operations teams apply in sales capacity planning translates directly to field force sizing: build from realistic daily output, not aspirational targets.
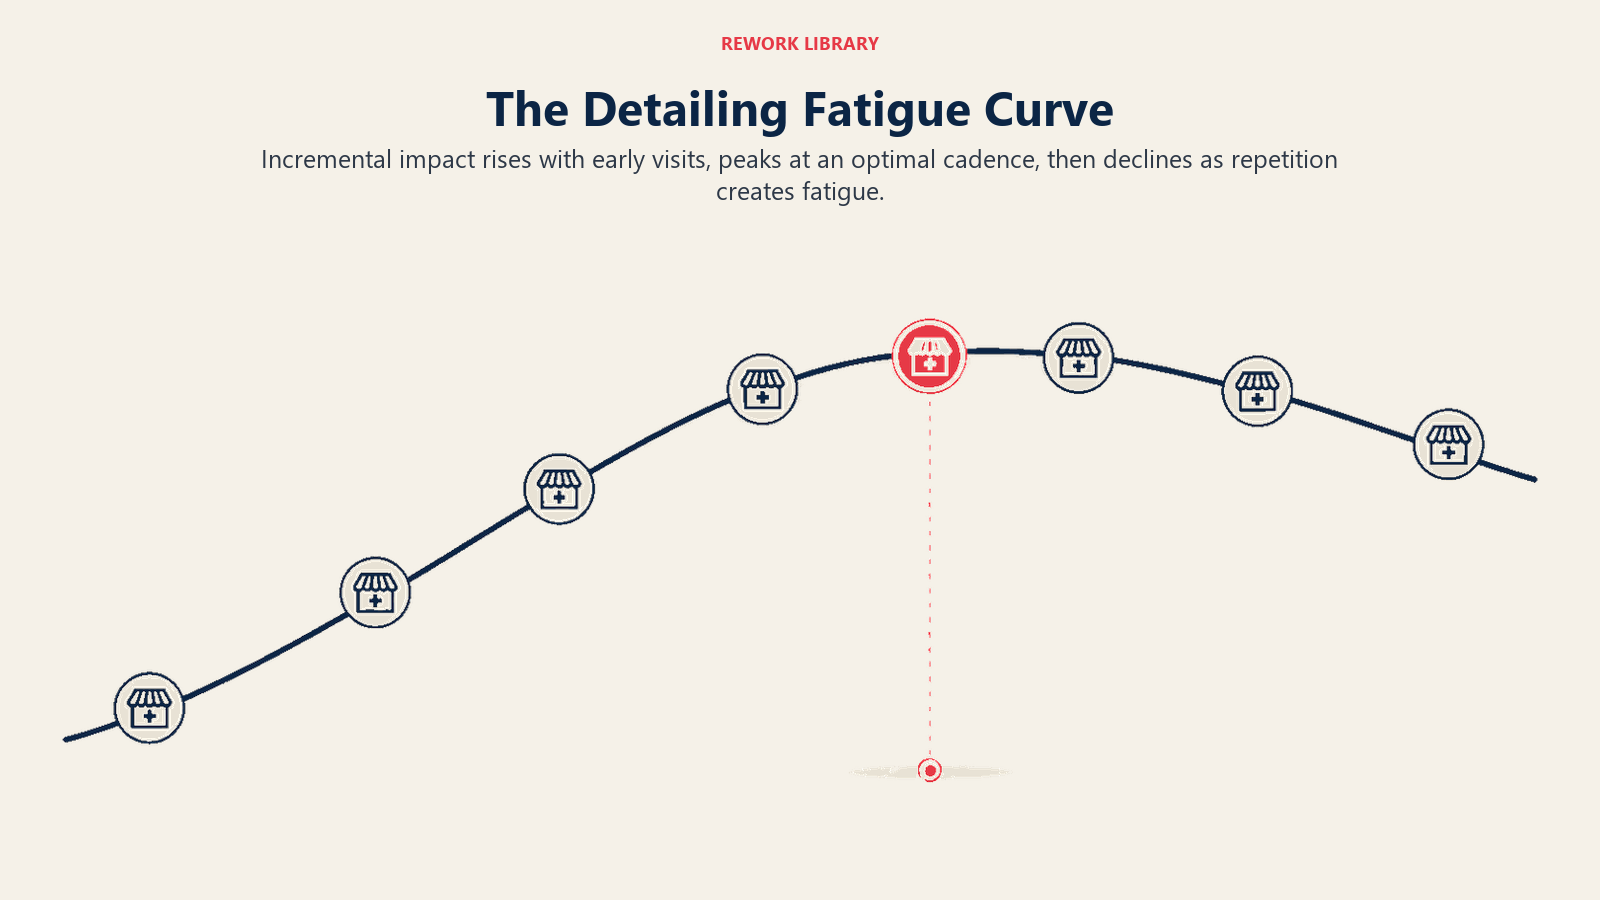
Diminishing Returns and the Detailing Fatigue Curve
Every account has a point at which additional visits stop producing incremental scripts. This is the detailing fatigue curve, and it's real.
For a top-five pharmacy, the curve typically flattens after three to four consecutive weekly visits with no change in shelf position or ordering behavior. The pharmacist has absorbed the message, made a decision about stocking, and subsequent visits add relationship cost (they feel pestered) with no commercial return. The right response is to dial back to fortnightly and use the recovered visit slot on an under-called A2 account.
For HCPs, the fatigue curve is shorter and steeper. A specialist who sees a rep weekly without receiving new clinical content stops engaging within six to eight weeks. The visits still happen. The detail goes in the bin, figuratively. A national survey found that HCP exposure to pharma contact correlates with self-reported prescribing influence, but that effect fades and can reverse when contacts feel repetitive rather than informative. When you stack the resource cost of those visits against the prescribing data and see flat or declining scripts, the correlation is usually visible.
The practical signal to watch is script trend relative to call frequency trend. If scripts are flat or declining over a period when calls have increased, you've likely crossed the fatigue threshold. Reducing call frequency and increasing detail quality will usually stabilize the relationship faster than simply pressing on with more visits.
How Do You Identify and Fix Coverage Gaps Before They Cost Scripts?
Coverage gaps are the accounts that fall off the route without anyone noticing. They're usually C-tier accounts that get skipped when the week gets busy, but they're also sometimes B-tier accounts that haven't been visited in two months because the rep is overloaded at the top end of the tier.
A monthly coverage gap analysis pulls three data points: planned calls per account (from the call plan), actual calls logged (from CRM), and the difference. Any account that has received fewer than 60 percent of its planned calls in the quarter is a coverage gap.
Territory analytics and sales dashboards should surface this automatically. If your reporting system doesn't flag missed coverage by account tier, build that view before the next territory review. Coverage gaps at the C level are usually tolerable. Coverage gaps at the A level are a commercial risk: unvisited A-tier accounts give competitor reps time and opportunity to fill the relationship vacuum.
The recovery protocol for a gap account: a make-up visit within two weeks, not just a call logged next month. For pharmacy accounts, a gap of more than six weeks often means lost facing or a delisted product. The cost of recovery is higher than the cost of maintaining cadence.
One discipline that prevents gaps is the medical rep daily call plan that prioritizes A and B tier accounts as non-negotiables. C-tier visits should fill remaining capacity, not compete with it.
Specialist HCPs exposed to the same rep weekly without new clinical content tend to disengage within six to eight weeks, meaning high call volume at the wrong cadence actively erodes relationship quality over time. Deloitte's research on pharma customer engagement gaps found that HCPs consistently rate their needs as undermet despite high visit frequency, a direct signal that volume without relevance produces the wrong outcome.
The Tiered Frequency Portfolio Model is the planning approach described throughout this article: segment accounts into A, B, and C tiers based on commercial potential, assign evidence-backed visit cadences to each tier, then calculate whether the rep's actual monthly capacity can cover the resulting visit load. If there's a gap, either the territory must be re-zoned or tier assignments must shift before the rep hits the field with an unworkable plan.
Seasonal and Launch Adjustments
Steady-state frequency is a baseline. It bends for two major event types: seasonal demand spikes and product launches.
Seasonal spikes in therapeutic categories like respiratory, allergy, and dermatology require temporary frequency compression at key pharmacy accounts. During a peak flu season, a pharmacy that normally gets fortnightly calls needs weekly attention: sell-out rates accelerate, competitor stock-outs create opportunistic windows, and the pharmacist's buying decisions are made faster because product is moving off the shelf every day.
Build seasonal frequency calendars for each major category in the portfolio. Mark the six-to-eight-week peak window, increase A-tier pharmacy calls to weekly, and identify which C-tier accounts can be temporarily deferred to free up the required capacity. This trade-off is explicit and reversible.
Product launches compress frequency across both pharmacy and HCP accounts for a fixed window, typically 12 to 16 weeks post-launch. During this period, every account in the relevant therapeutic category is treated as at least a B-tier account, and top targets are moved to A-tier cadence regardless of their historical script volume. The rational: prescribing habits form early. A doctor who tries the product in the first three months and has a positive patient experience becomes a sustainable prescriber. One who doesn't get visited during the launch window is far harder to convert six months later when competitor share has solidified.
Launch frequency plans should be documented before the first rep hits the field, embedded in the pharma CRM and sales force automation system as a temporary call cycle override, and reviewed at week four, week eight, and week 12 against script uptake data.
Measuring Coverage Quality
Volume metrics tell you that calls happened. Quality metrics tell you what they produced.
Coverage rate measures the percentage of planned accounts that received at least one call in the reporting period. A coverage rate below 80 percent for A-tier accounts signals a structural problem, either in call planning, route design, or rep capacity. For B-tier, 70 percent is the floor. C-tier flexibility is acceptable down to 50 percent.
Adherence rate measures whether calls happened at the planned frequency, not just whether they happened at all. An account called three times in a month when the plan says weekly is a partial adherence failure. Most CRM systems track this as the ratio of actual calls to planned calls per account per cycle.
Missed call recovery tracks how quickly gaps are closed. The benchmark for A-tier accounts is that any missed visit is recovered within seven days. For B-tier, within two weeks. Accounts with persistent missed call patterns (two consecutive misses in any quarter) should trigger a territory review.
A summary coverage scorecard per rep, refreshed monthly, gives field managers the information they need to coach before a missed-call pattern becomes a missed-quarter result.
| Metric | A-Tier Floor | B-Tier Floor | C-Tier Floor |
|---|---|---|---|
| Coverage rate | 80% | 70% | 50% |
| Adherence rate | 85% | 75% | 60% |
| Gap recovery time | 7 days | 14 days | 30 days |
Conclusion: Frequency Is a Resource Allocation Decision
A rep visiting every account every week isn't working hard. She's working without a strategy. Every call that goes to an account that doesn't need it is a call that didn't go to one that does.
Treating call frequency as a fixed default, the way most pharma commercial teams inherited it, produces territories where the highest-value accounts are chronically under-called and the lowest-value accounts see the rep more often than they want. The fix isn't cultural. It's analytical: tier accounts by commercial potential, calculate true rep capacity, map the math, and build the route around what the data says.
Set frequency policy at the commercial leadership level. Enforce it through CRM-embedded call cycles and manager-led coverage reviews. And revisit the tiers every six months as scripts shift, new products launch, and competitive dynamics change in the field.
The reps who consistently hit territory targets aren't the ones who clock the most visits. They're the ones whose visits land at the right accounts, at the right moment, with a purpose that the account can feel.
Frequently Asked Questions about Call Frequency and Coverage Optimization
How often should a medical rep visit a top-tier pharmacy?
A-tier pharmacies, those in the top 10 percent of territory script volume, generally warrant weekly visits. At that cadence, the rep maintains shelf position, catches stock depletion before it becomes a lost sale, and prevents competitor reps from filling the relationship vacuum. Below that tier, fortnightly or monthly calls are typically sufficient without burning capacity that belongs at higher-value accounts.
What is the right number of daily calls for a pharma field rep?
Daily call capacity depends heavily on territory geography. Dense urban reps complete significantly more face-to-face visits per day than rural reps who spend 30 minutes or more driving between stops. The planning benchmarks in this article provide starting points, but your actual numbers should come from a time-and-motion review of a representative sample of reps in your own territory mix. Planning targets, not aspirational maxima, should anchor every territory sizing and call-plan exercise.
How do you calculate whether your territory frequency plan is feasible?
Stack your account frequency requirements against actual monthly call capacity. Multiply daily call capacity by available field days per month, then subtract training and regional event days. If the required visits per month across all tiers exceed that number, the territory has a structural coverage gap. The gap must be resolved through re-zoning, tier reassignment, or adding headcount, not by pushing reps to work harder on an impossible math problem.
When should a rep reduce call frequency at an account?
Two signals indicate it's time to pull back frequency. First, if scripts are flat or declining while calls have increased, the account has likely crossed the detailing fatigue threshold. Second, if a pharmacy account has been stable and reordering consistently for three or more cycles without any competitive threat, fortnightly calls will maintain the relationship without burning capacity that could go to an under-called A account. Reducing frequency is not abandoning an account. It's managing territory as a portfolio.
How do product launches change frequency planning?
Product launches typically require a 12 to 16 week compressed frequency period across all accounts in the relevant therapeutic category. Every account that fits the target patient profile is temporarily upgraded at least one tier during launch. The rationale: prescribing habits form early. A physician who tries the product in the first three months and has a positive patient experience converts to a sustainable prescriber far more reliably than one who wasn't reached until competitor share had already solidified.
What metrics should be in a monthly coverage scorecard?
Three metrics cover the essentials. Coverage rate measures what percentage of planned accounts received at least one call in the period. Adherence rate measures whether those calls happened at the planned frequency, not just whether they happened at all. Gap recovery time tracks how quickly missed visits are made up. The benchmarks: A-tier coverage rate at 80 percent or above, adherence at 85 percent, and any missed A-tier visit recovered within seven days.
Learn More

Senior Implementation Consultant
On this page
- Why Frequency Matters More Than Volume
- Frequency Tiers by Account Type
- The Coverage Equation
- Diminishing Returns and the Detailing Fatigue Curve
- How Do You Identify and Fix Coverage Gaps Before They Cost Scripts?
- Seasonal and Launch Adjustments
- Measuring Coverage Quality
- Conclusion: Frequency Is a Resource Allocation Decision
- Learn More