Territory and Knock Analytics for Door-to-Door Home Services
Turn this article into takeaways for your work.


Each assistant summarizes the article only for you and suggests best practices for your work.
Every door a rep knocks produces a data point. Over a season, a single 20-rep team might generate 150,000 to 250,000 door-level interactions. Most D2D companies use about 2% of that data. The rest disappears into a canvassing app that nobody really reviews. Or it gets logged on paper and thrown out.
That's a real competitive disadvantage. The companies pulling ahead in home services subscription sales treat knock data as a strategic asset. They know which neighborhoods convert at 4% and which convert at 0.8%, and why the difference exists. They route reps accordingly, in real time, not at the end of the season.
This article explains how to build that capability and what to do with it once you have it.
What Does Knock Analytics Actually Mean?
Knock analytics is the practice of collecting, analyzing, and acting on door-level canvassing data to improve rep efficiency and territory performance. It sits between your canvassing app (where data is captured) and your management decisions (where data gets used).
The inputs are relatively simple. For every door interaction, your canvassing app should be capturing:
- Date and time of knock
- Rep ID
- Address (verified, ideally to USPS standard)
- Outcome (not home, not interested, callback scheduled, close, do not knock)
- Duration of interaction if the rep was actually engaged
- Notes (optional, rep-entered)
From these inputs, you can derive a surprisingly rich set of insights at the territory, neighborhood, street, and door level. The analysis isn't complicated. What's hard is establishing the data discipline to collect clean data consistently and then building the habit of actually looking at it. McKinsey's research on data analytics in sales, based on a survey of more than 1,000 sales organizations worldwide, backs this up: the gap between data-driven teams and their peers compounds across every season.
Key Facts
- McKinsey's survey of more than 1,000 sales organizations found that most companies still rate themselves as ineffective at turning sales data into action, and that high-performing organizations are consistently more likely to describe their analytics use as effective than the broader survey population. (McKinsey, "Unlocking the Power of Data in Sales")
- D2D canvassing converts at an estimated 2-5% across home services verticals, compared to roughly 1% for digital outreach channels. (Industry benchmark cited across SPOTIO and Knockio; treat as a practitioner estimate rather than peer-reviewed research)
- Top sales reps spend 22% more time on external, customer-facing interactions than low performers, according to McKinsey's analysis of rep behavior patterns across 40,000 deals. (McKinsey, "How Data Analytics Helps Sales Reps Win More Deals")
Territory-Level Analysis: Where to Send Your Team
The most immediate use of knock analytics is territory prioritization. Not all territories are equal, and most D2D companies have a rough intuition about which neighborhoods work well. Knock analytics replaces intuition with evidence.
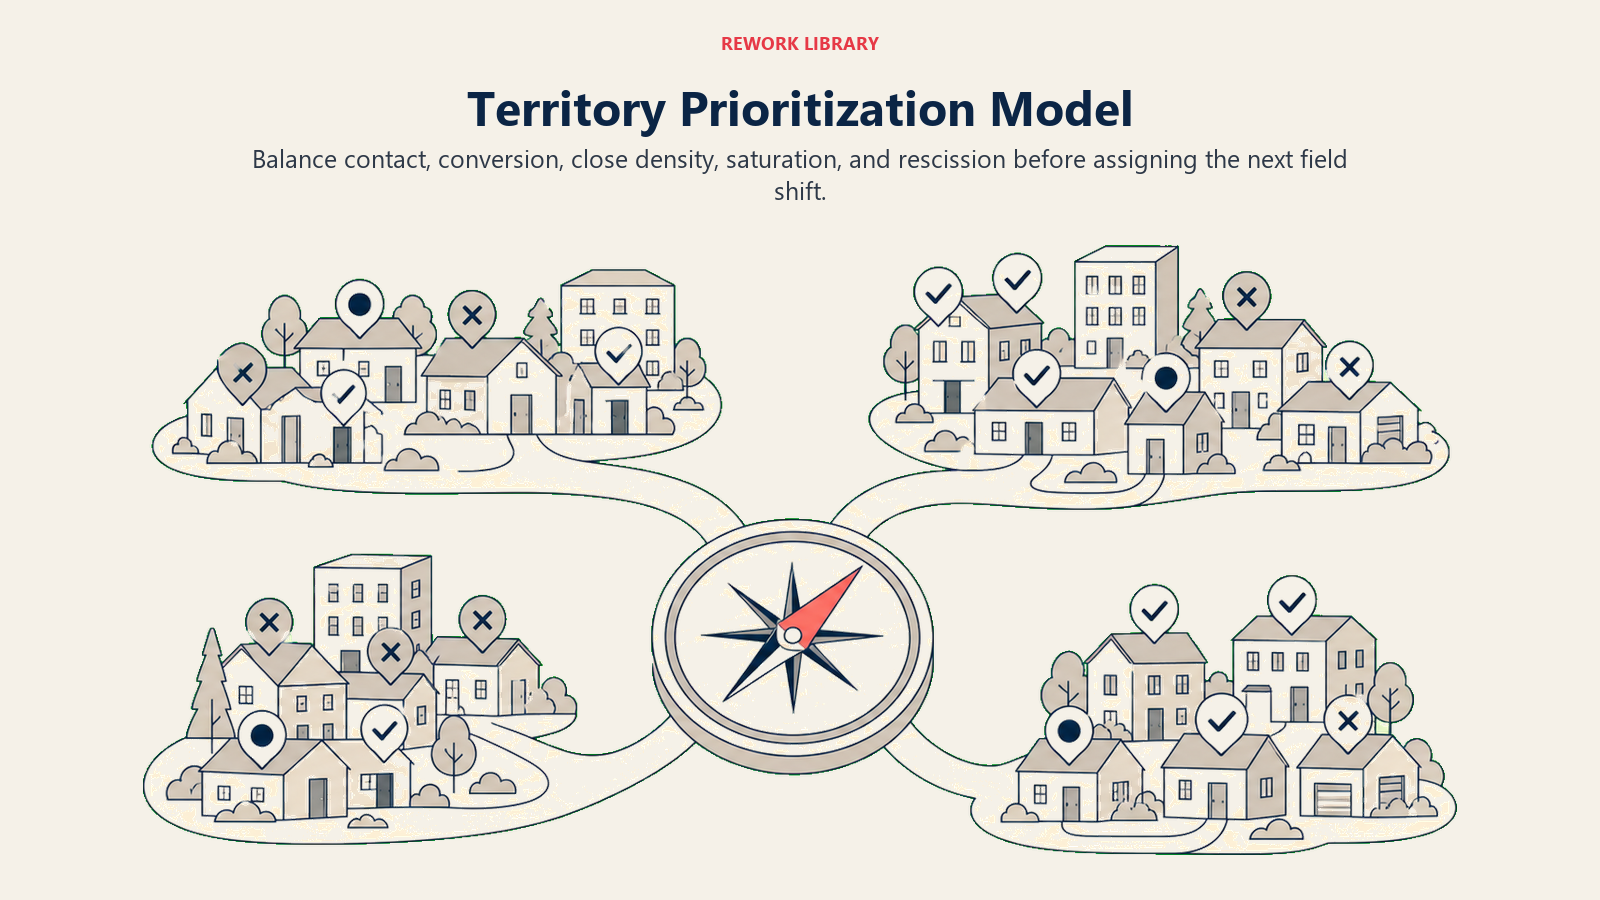
The key territory metrics to track:
Contact rate. Of all doors knocked in a territory, what percentage resulted in any human contact (not just answered, but engaged enough to hear the pitch)? Contact rates below 30% suggest the territory has density, access, or timing problems. Above 50% is strong.
Conversion rate. Of all contacts made, what percentage converted to a closed agreement? This is the most direct measure of territory quality, accounting for your offer's fit with the demographic.
Close density. How many closes per 100 doors knocked? This blends contact rate and conversion rate into a single efficiency number. A neighborhood with high contact rate but low conversion (lots of "not interested" responses) looks very different from one with low contact rate but high conversion (fewer home, but the ones who answer buy).
Saturation index. What percentage of doors in a territory have already been knocked at least once? A territory at 80% saturation needs to be retired or rested before returns continue dropping.
Rescission rate by territory. Some neighborhoods have noticeably higher early-cancellation rates. This could be demographic (lower trust in D2D), product fit (the service doesn't solve a real problem for this area), or rep behavior (overselling to hit numbers in a tough neighborhood).
Build a territory scorecard that updates at least weekly:
| Territory ID | Contact Rate | Conv. Rate | Close Density | Saturation | Rescission Rate | Recommendation |
|---|---|---|---|---|---|---|
| NW-04 | 52% | 4.2% | 2.2 | 35% | 8% | Active, expand |
| SE-11 | 48% | 1.9% | 0.9 | 72% | 22% | Rest for 30 days |
| NE-07 | 31% | 5.8% | 1.8 | 18% | 6% | Contact problem, good when home |
| SW-02 | 61% | 3.1% | 1.9 | 55% | 11% | Monitor saturation |
The NE-07 territory in this example is interesting. Low contact rate but high conversion means you have a timing problem, not a pitch problem. Reps are knocking when people aren't home. Shifting to later afternoon hours or weekend deployment might fix it. Without the analytics, you'd just see average close density and might pull reps from a high-quality territory unnecessarily.
For the territory assignment framework that complements this analysis, see territory design and assignment.
Time-of-Day and Day-of-Week Analysis
When your team knocks matters almost as much as where they knock. Most D2D sales managers know the broad rule (3-8pm on weekdays, morning to midday on weekends), but knock analytics lets you validate whether that general wisdom holds in your specific markets and adjust based on evidence.
Run a breakdown of your close data by time block:
| Time Block | Avg Door Contacts/Hr | Avg Closes/Hr | Effective Close Rate |
|---|---|---|---|
| 9am-12pm (weekday) | 8.2 | 0.12 | 1.5% |
| 12pm-3pm (weekday) | 9.1 | 0.18 | 2.0% |
| 3pm-5pm (weekday) | 11.4 | 0.38 | 3.3% |
| 5pm-7pm (weekday) | 13.2 | 0.52 | 3.9% |
| 7pm-8pm (weekday) | 9.8 | 0.29 | 3.0% |
| 9am-12pm (weekend) | 12.8 | 0.41 | 3.2% |
| 12pm-4pm (weekend) | 11.6 | 0.35 | 3.0% |
These numbers will vary by vertical and geography, but the pattern usually shows that weekday afternoon and early evening hours significantly outperform morning hours for close rate. The practical implication: if your reps are starting full field days at 8am, you may be paying them to knock on empty houses for three hours before they enter the productive window.
That data gives you justification to shift schedules, stagger start times, or use morning hours for territory walkthroughs and training rather than active canvassing.
The connection to broader weather, timing, and density planning is direct. Knock analytics provides the empirical layer that confirms or refines the general timing principles.
Door-Level Revisit Logic
One of the most practical outputs of knock analytics is a revisit queue. Not every door that was "not home" should be knocked again, and not every "not interested" is a closed door forever. Good analytics help you sort these into the right buckets.
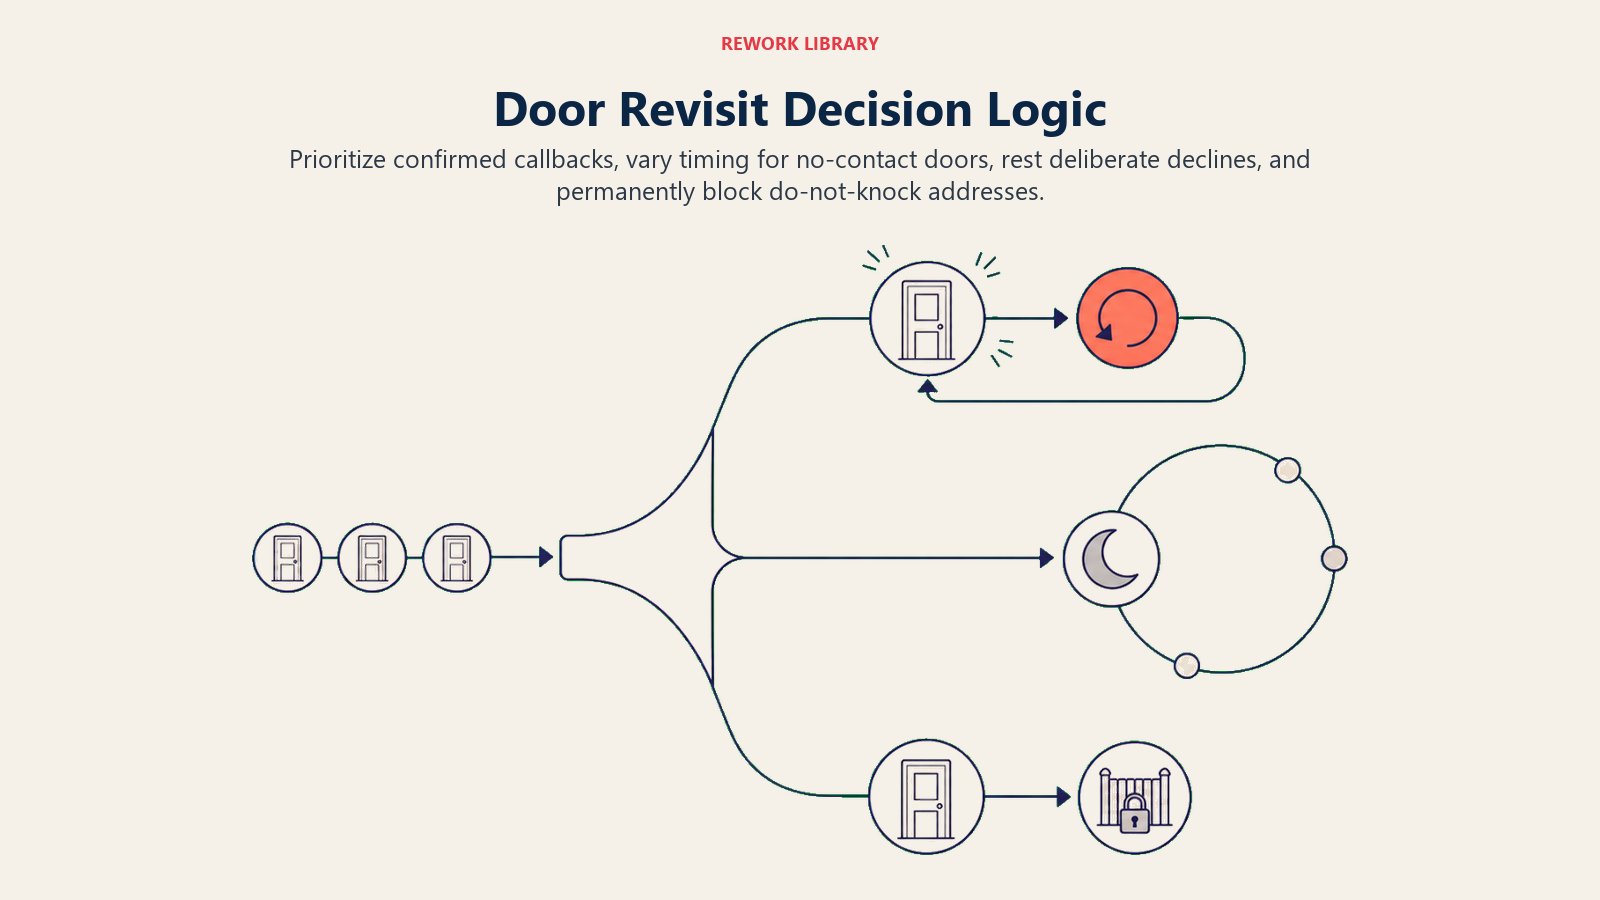
Revisit priorities:
Callback confirmed. The rep spoke with someone who expressed interest and set a specific callback time. This is the highest priority revisit. Your canvassing app should flag these and route the assigned rep back at the right time.
Not home, no contact made. Standard revisit candidate. Try different times of day. After three attempts at different times with no contact, move to lower priority.
Not home, multiple prior attempts. After three no-contacts at varied times, this address is either vacant or the resident's schedule doesn't match your canvassing hours. Flag it as low priority and revisit only if the territory has low remaining coverage.
Not interested, short interaction. The rep got a brush-off at the door. This might be a timing problem (bad moment for the resident) or a script problem (rep didn't establish value quickly enough). Re-knock after 30+ days with a different opening.
Not interested, full conversation. The rep engaged, pitched, and got a deliberate no. These doors should rest for 90+ days. The resident heard your pitch and declined. Going back too soon is annoying and damages brand perception.
Do not knock. Never return. May be a resident complaint or a registered DNK address. Your canvassing app should block this address from territory assignments permanently.
Systematizing revisit logic in your canvassing app means reps aren't making judgment calls about which doors to revisit. The app tells them. This removes one source of inconsistency in how different reps work the same territory.
The Territory Scorecard Framework
The Five-Metric Territory Score: Effective territory management requires scoring each territory on the same dimensions so allocation decisions are data-driven rather than intuitive.
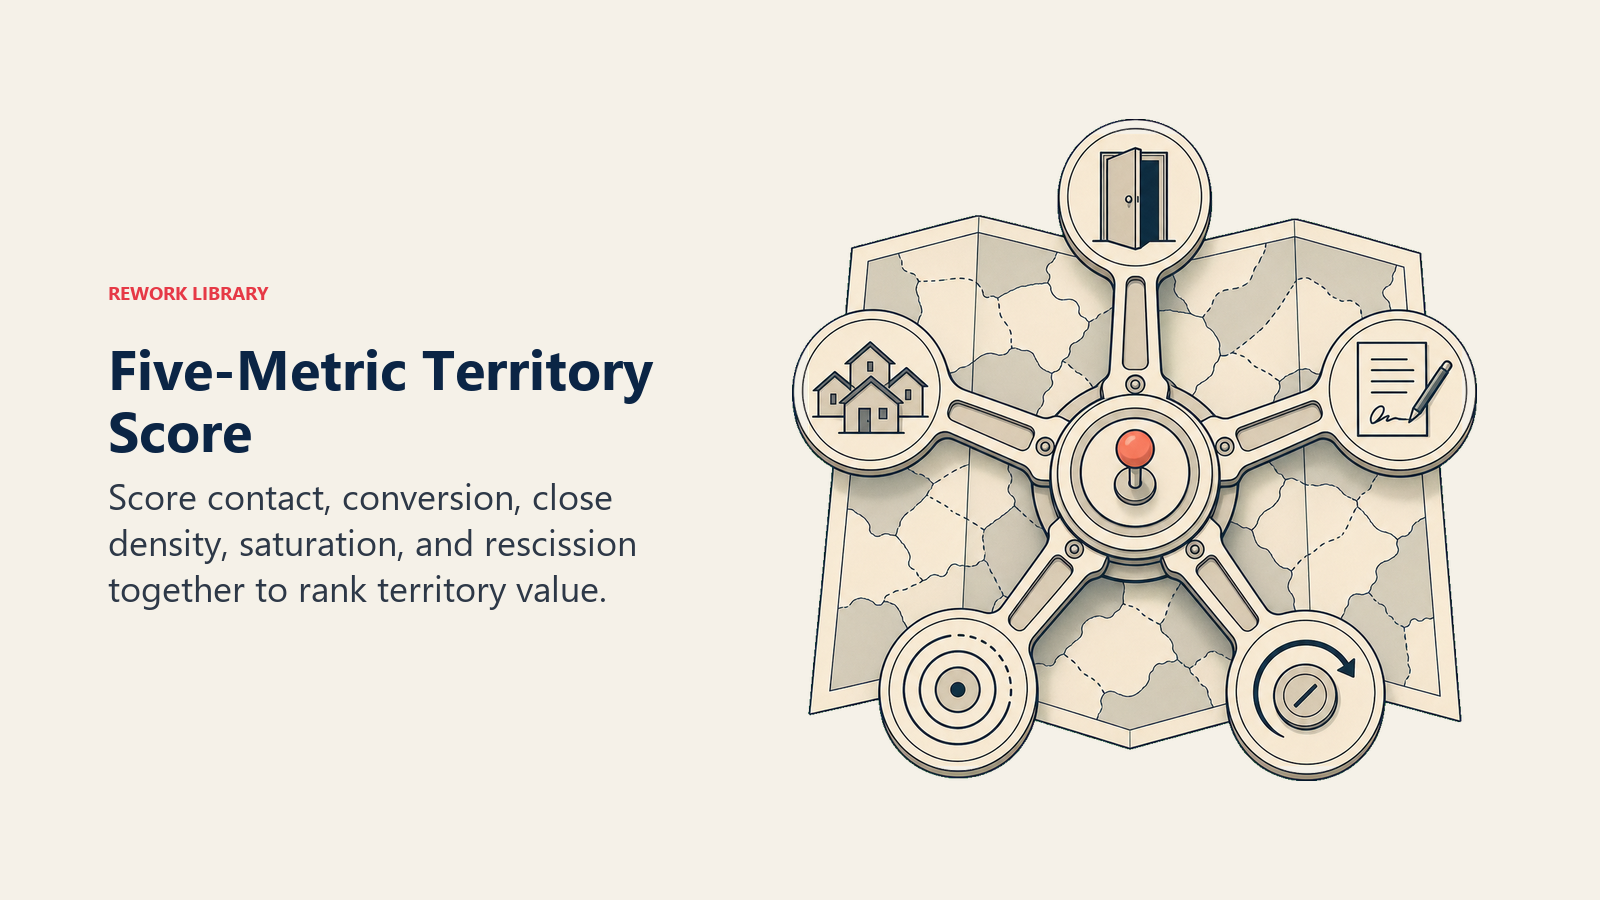
Contact Rate: What percentage of knocks result in a genuine conversation? Below 30% signals a density, access, or timing problem. Above 50% is strong.
Conversion Rate: Of all contacts made, what percentage close? This is territory quality adjusted for the offer's fit with the demographic.
Close Density: Closes per 100 doors knocked. Combines contact rate and conversion rate into a single efficiency metric that reflects what a rep actually produces per hour of field work.
Saturation Index: What percentage of doors in the territory have been knocked at least once this season? Above 70-80% is the signal to rest or retire the territory before returns collapse.
Rescission Rate by Territory: Some territories consistently produce higher early-cancellation rates. This can reflect demographic fit, competitive presence, or rep behavior patterns. It shows up clearly when you track cancellations back to their acquisition territory rather than just to the rep.
Score every territory on these five dimensions weekly and use the scores to drive the following week's assignments. A territory that looks average on close density but has a low rescission rate is often more valuable per hour of rep time than a territory with high close density and high churn.
Quotable Nuggets
"Most D2D teams know their best reps. The ones that pull ahead know their best territories. That's a data problem, not a talent problem." (Practitioner principle from D2D canvassing operator communities; consistent with McKinsey's finding that high-performing sales organizations are more likely than their peers to rate themselves as effective analytics users)
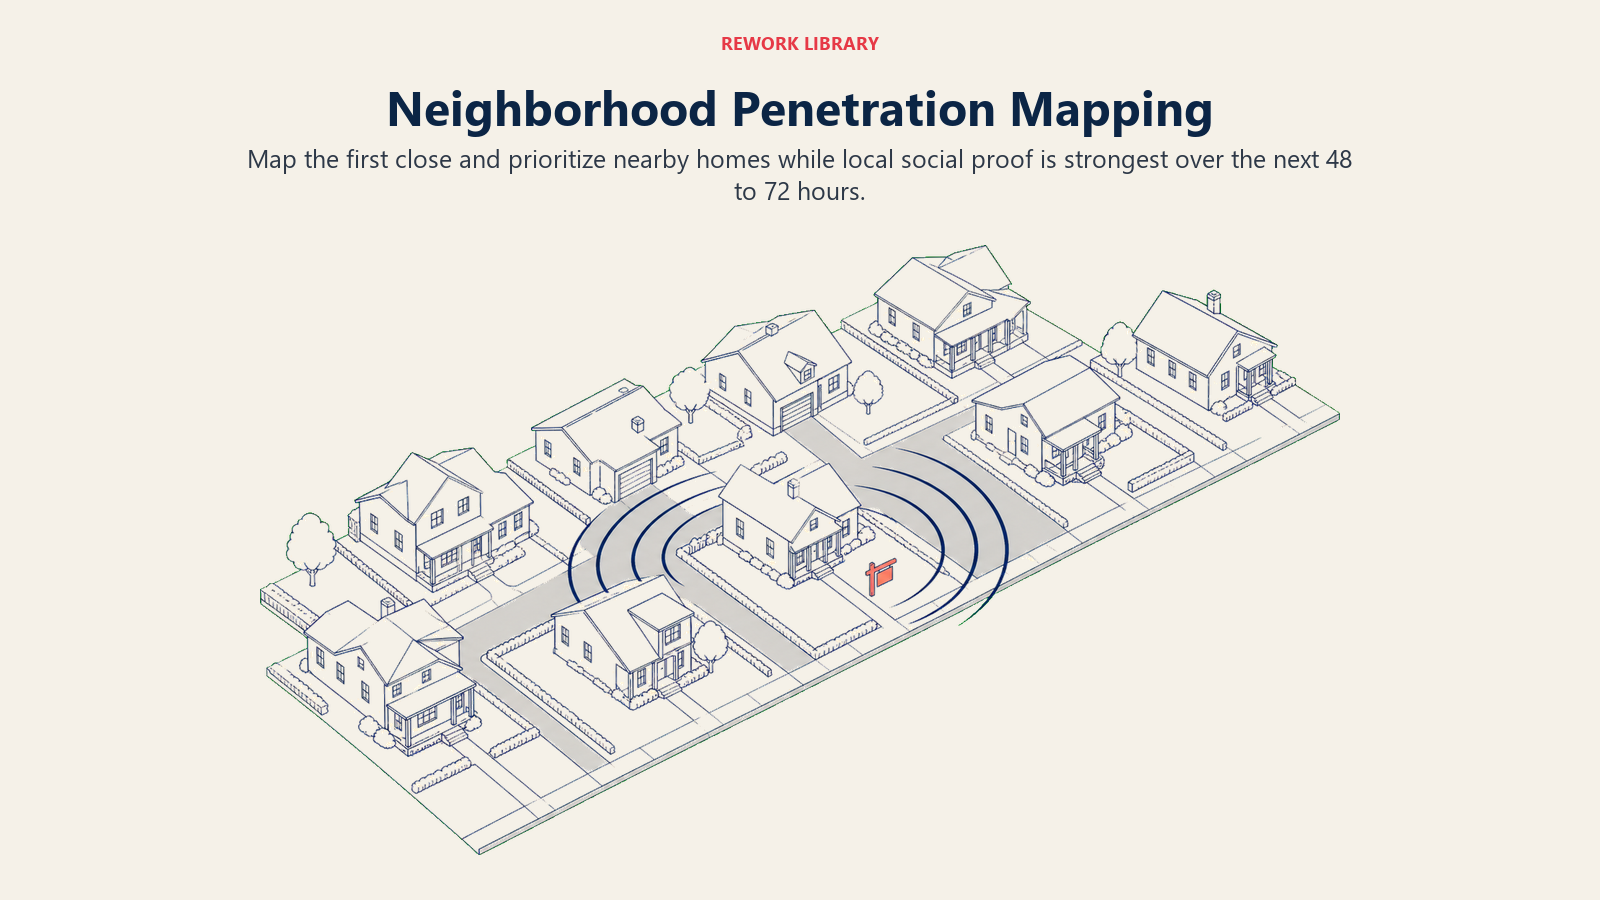
"The neighborhood effect is the most underused insight in D2D canvassing. Your first close on a block is worth twice as much as a close in an isolated house because it seeds the next 6-12 doors with social proof. If you're not treating the surrounding block as a 48-hour priority revisit window, you're leaving closes on the table." (Field operations observation documented in D2D canvassing communities and software platforms including SalesRabbit and Knockbase)
"Knock data from this season is useful. Knock data from three seasons is a strategic asset. The companies that accumulate territory intelligence year over year don't have to relearn the same lessons every spring." (Operational philosophy cited in D2D operator training programs and consistent with McKinsey's argument that combining activity data with outcome data over time separates iterating teams from guessing teams)
Neighborhood Penetration Mapping
When you overlay your close data on a map, patterns emerge that aren't visible in spreadsheets alone. Close density often clusters by block rather than by zip code or census tract. Understanding why helps you replicate success.
A high close-density block often has one or more of these characteristics:
- Higher proportion of homeowners vs. renters (homeowners have more authority to make subscription decisions)
- Homes in the target age range for your service (new construction for pest/security, older homes for fiber upgrade)
- Less competitive saturation (you got there before competitors did)
- A social proof effect from visible service vehicles or yard signs
That last point is underappreciated. When a rep closes a house on a block and leaves a yard sign or the service tech shows up with a visible vehicle, neighbors become warmer prospects. Canvassing analytics often show noticeably higher close rates on the blocks adjacent to your first closes in a neighborhood. This is the neighborhood effect, and smart territory management exploits it deliberately.
The tactic: when you get your first close on a new block, treat the surrounding 6-12 houses as priority revisit territory within the next 48-72 hours. Close rates in that window are often 2-3x the baseline because curiosity and social proof are highest right after a neighbor signs up.
Identifying Rep-Level Patterns vs. Territory-Level Patterns
One of the trickiest parts of knock analytics is separating territory effects from rep effects. If rep A has a 2% close rate in territory X and rep B has a 4.5% close rate in the same territory, is that territory good or is rep B just better?
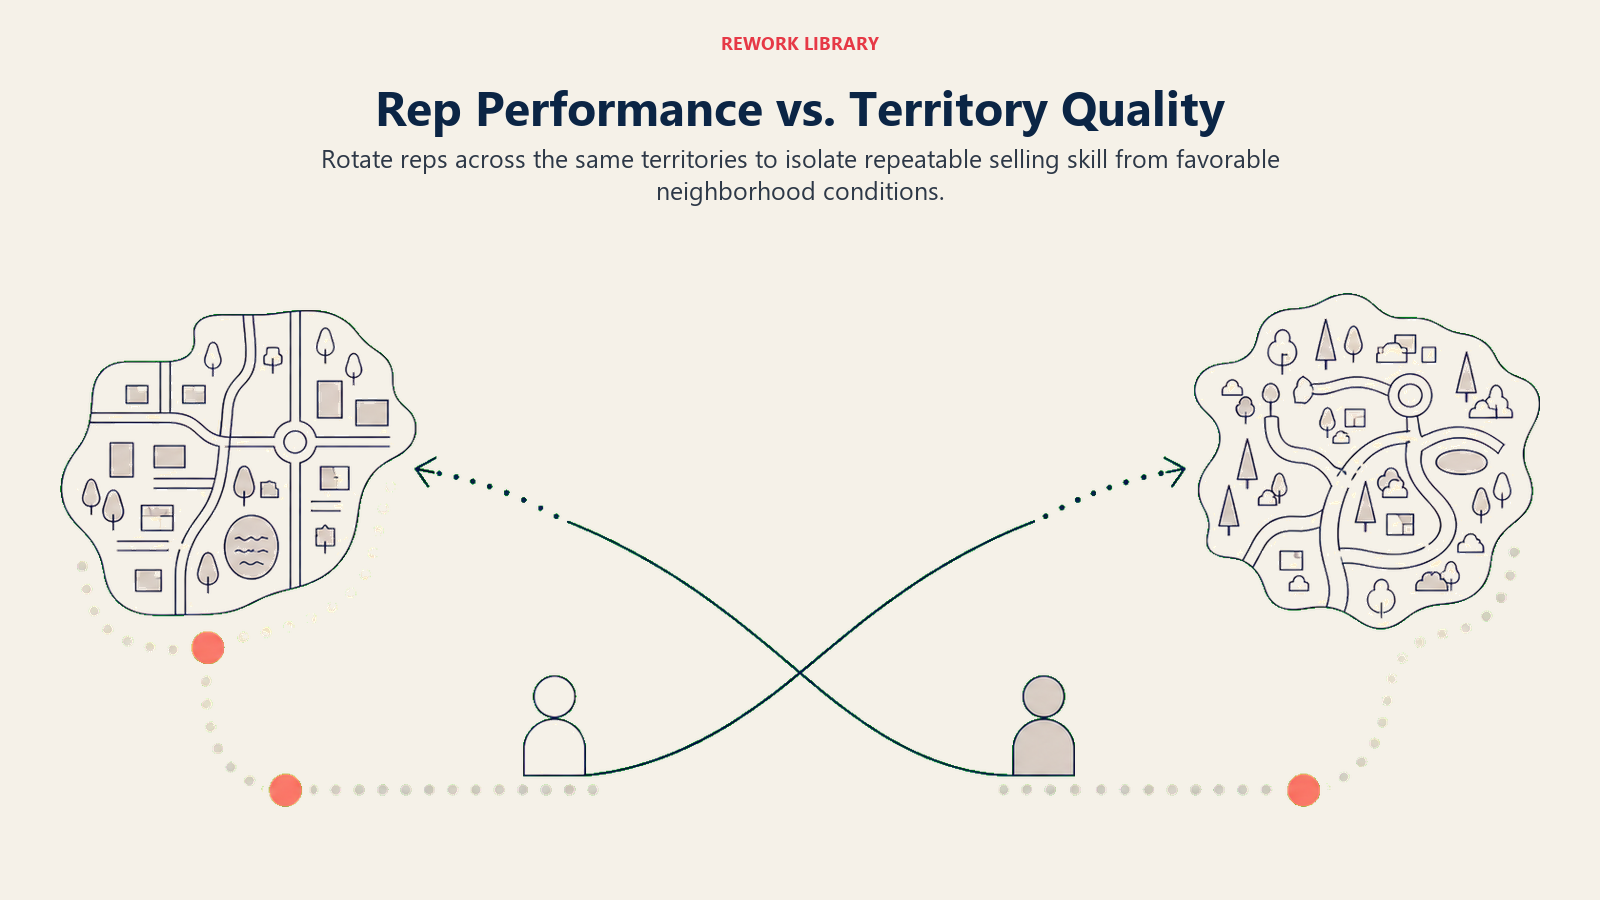
The answer is usually both, but you need to see multiple reps in the same territory to isolate the variables. Build this into your territory rotation strategy. Don't leave the same rep in the same territory for more than two weeks. Rotation serves two purposes: it prevents rep fatigue and territory saturation, and it gives you the comparative data to separate rep skill from territory quality.
A rep who consistently outperforms territory averages across multiple territories is genuinely skilled. A rep who only performs well in one specific territory may have cherry-picked their approach or benefited from favorable conditions that won't repeat.
This analysis also surfaces reps who are inflating their knock counts without genuine effort. If rep C reports 300 doors in a territory but the GPS data shows they spent 4 hours in a single two-block area, the numbers don't add up. Pattern detection in knock analytics is one of the best tools for catching this kind of gaming before it spreads.
For the rep performance framework that uses this data, see lead and rep performance dashboards and the broader discussion of D2D sales KPIs and metrics.
What Can Seasonal and Longitudinal Data Tell You That Single-Season Analytics Cannot?
Territory and knock data becomes more powerful the longer you accumulate it. Your first season of data shows you what worked. Your third season shows you what reliably works across different conditions.
Longitudinal analysis questions worth asking:
Which territories had the highest retention rates, not just close rates? A territory that produces subscribers who stay 18+ months is worth more than one that produces subscribers who cancel in 60 days, even if the initial close rates look similar.
How does territory performance change with saturation? Most territories show diminishing returns above 60-70% penetration. At what saturation level does your data show a meaningful drop in contact rate or conversion rate? That number sets your retirement threshold.
What is the seasonal performance curve for your market? Do close rates peak in April, June, or September? Does it vary by service type (pest has a clear spring peak; security is more year-round)? Knowing the curve lets you staff up before the peak and plan territory expansion for the high-conversion window.
Which territories have the best "re-open" performance after resting? Some neighborhoods respond well to being re-worked 90 days after initial saturation. Others don't. Your data will tell you which is which, so you can plan re-open sequences intelligently rather than guessing.
Building a Territory Intelligence File
All of this analysis is most useful when it lives somewhere organized and accessible rather than scattered across different reports. The practical answer is a territory intelligence file: a structured document or database record for each territory you work, updated seasonally.
A basic territory intelligence file includes:
- Geographic boundaries (ideally with a map pin export from your canvassing app)
- Total door count (known serviceable addresses)
- Competitive status (known competitor presence or saturation)
- Seasonal performance history (close rates by quarter)
- Current saturation index
- Last worked date
- Recommended re-open date (based on saturation and resting protocol)
- Notable observations (neighborhood effects, access issues, HOA restrictions)
- Best-performing reps historically in this territory
Over two to three seasons, this intelligence file becomes a serious asset. New managers can get up to speed on a territory in minutes rather than re-learning it through trial and error. And when you're expanding to a new city or market, having a systematic territory intelligence process means you build data faster and make better decisions in the first season rather than the third.
For the full picture of how territory intelligence connects to your canvassing app data infrastructure, see D2D CRM and canvassing apps. Route management is the other half of putting this intelligence into daily rep workflows.
Connecting Knock Analytics to Subscriber Lifetime Value
The most sophisticated use of knock analytics is connecting front-end territory data to back-end subscriber outcomes. This requires linking your canvassing app data to your CRM or subscription billing system by territory, not just by rep.
When you can ask "what is the average lifetime value of a subscriber acquired in territory NW-04 vs. territory SE-11?", you're making a different quality of decision about where to deploy reps. A territory with a 3% close rate but strong subscriber retention might be more valuable per hour of rep time than a territory with a 5% close rate and high early-cancellation.
The framework in lead scoring systems applies directly here: territories are, in effect, lead sources, and scoring them by lifetime value rather than just initial conversion rate leads to better resource allocation. The retention fundamentals framework rounds out this analysis by showing which subscriber behaviors in the first 90 days predict whether a customer actually stays.
The D2D companies building sustainable recurring revenue businesses rather than just maximizing summer sales are the ones thinking this way. Territory analytics is the foundation. The lifetime value connection is what makes it strategic rather than tactical. McKinsey's research on how data analytics helps sales reps win more deals demonstrates the principle: top-performing reps spend 22% more time on external, customer-facing interactions than low performers, and analysis of 40,000 deals shows that specific behavioral patterns drive measurably different outcomes. Combining that activity layer with territory outcome data is what separates teams that iterate from teams that guess.
Learn More

Senior Implementation Consultant
On this page
- What Does Knock Analytics Actually Mean?
- Key Facts
- Territory-Level Analysis: Where to Send Your Team
- Time-of-Day and Day-of-Week Analysis
- Door-Level Revisit Logic
- The Territory Scorecard Framework
- Quotable Nuggets
- Neighborhood Penetration Mapping
- Identifying Rep-Level Patterns vs. Territory-Level Patterns
- What Can Seasonal and Longitudinal Data Tell You That Single-Season Analytics Cannot?
- Building a Territory Intelligence File
- Connecting Knock Analytics to Subscriber Lifetime Value
- Learn More