D2D Sales KPIs and Metrics: What Home Services Teams Should Actually Measure
Turn this article into takeaways for your work.


Each assistant summarizes the article only for you and suggests best practices for your work.
Every D2D sales manager tracks closes. It's the obvious number. It maps straight to revenue. But close count by itself is a lagging indicator. By the time you see it drop, the problem causing it has already been running for a week or two.
The managers who run the best door-to-door (D2D) teams track a set of leading and concurrent indicators that let them intervene before close count falls. They know what's happening on each rep's route while the rep is still working it. They know which stage of the funnel is slipping before quota misses. And they track post-close retention metrics that connect the sales team's work to the actual health of the subscription base.
This guide covers the 15 KPIs that matter most for home services D2D subscription teams, organized by the stage of the funnel they measure.
Why KPIs Are Different for Subscription D2D vs. One-Time Sales
In a traditional D2D sale, the only number that matters after the close is whether the check cleared. In a subscription business, the close is the beginning of a multi-year revenue relationship. Did the rep set accurate expectations? Did they close a genuinely qualified prospect? Both directly affect retention.
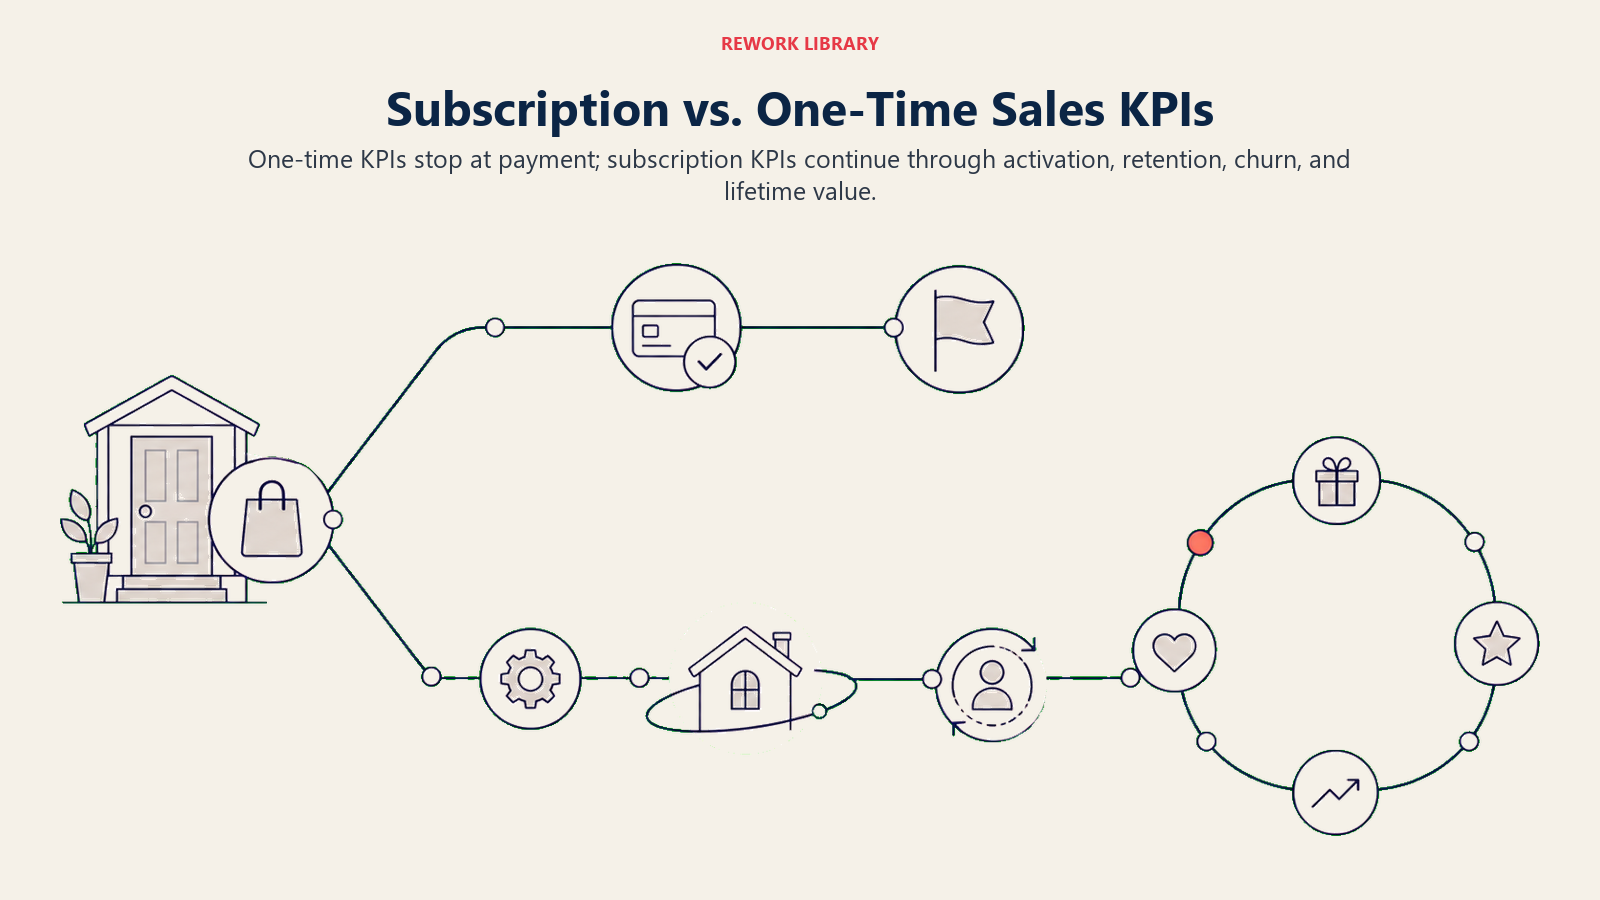
This means subscription D2D metrics need to cover three time horizons:
- Leading indicators: what's happening on the doors today that will produce closes this week?
- Current indicators: are reps closing at the rates they should, given their funnel activity?
- Lagging indicators: are the accounts closed last month still active? Are they renewing?
Most D2D managers are strong on current indicators and weak on the other two. The goal of a good KPI stack is to cover all three.
The Lead-Current-Lag (LCL) KPI Stack: the three-horizon measurement framework for D2D subscription teams. Leading indicators (doors knocked, contact rate, pitch rate) tell you what's happening on the street before it shows up in your numbers. Current indicators (close rate, revenue per close, same-day close rate) tell you whether activity is converting at expected efficiency. Lagging indicators (90-day retention, monthly churn, net new accounts) tell you whether the closed accounts are actually worth what the comp structure paid for them. Most field sales managers track current indicators well and ignore the other two, which is why they're always reacting to problems that started weeks earlier.
Key Facts
- Only 35% of field sales teams have more than 70% of their reps consistently hitting quota, a signal that most D2D organizations are tracking the wrong things or acting on data too slowly. (SPOTIO State of Field Sales 2026)
- Teams providing at least three hours of weekly coaching report 30% lower rep churn, which means KPI reviews that drive coaching conversations also reduce the turnover that costs D2D operations the most. (SalesRabbit 2025 Field Sales Report)
- Under the FTC Cooling-Off Rule (16 CFR Part 429), buyers have three business days to cancel any door-to-door sale of $25 or more, making the "days to first service" metric a legal risk indicator as much as an operational one. (FTC)
The 15 metrics below map onto exactly those three horizons, starting with the leading indicators that give you the earliest warning.
Activity Metrics (Leading Indicators)
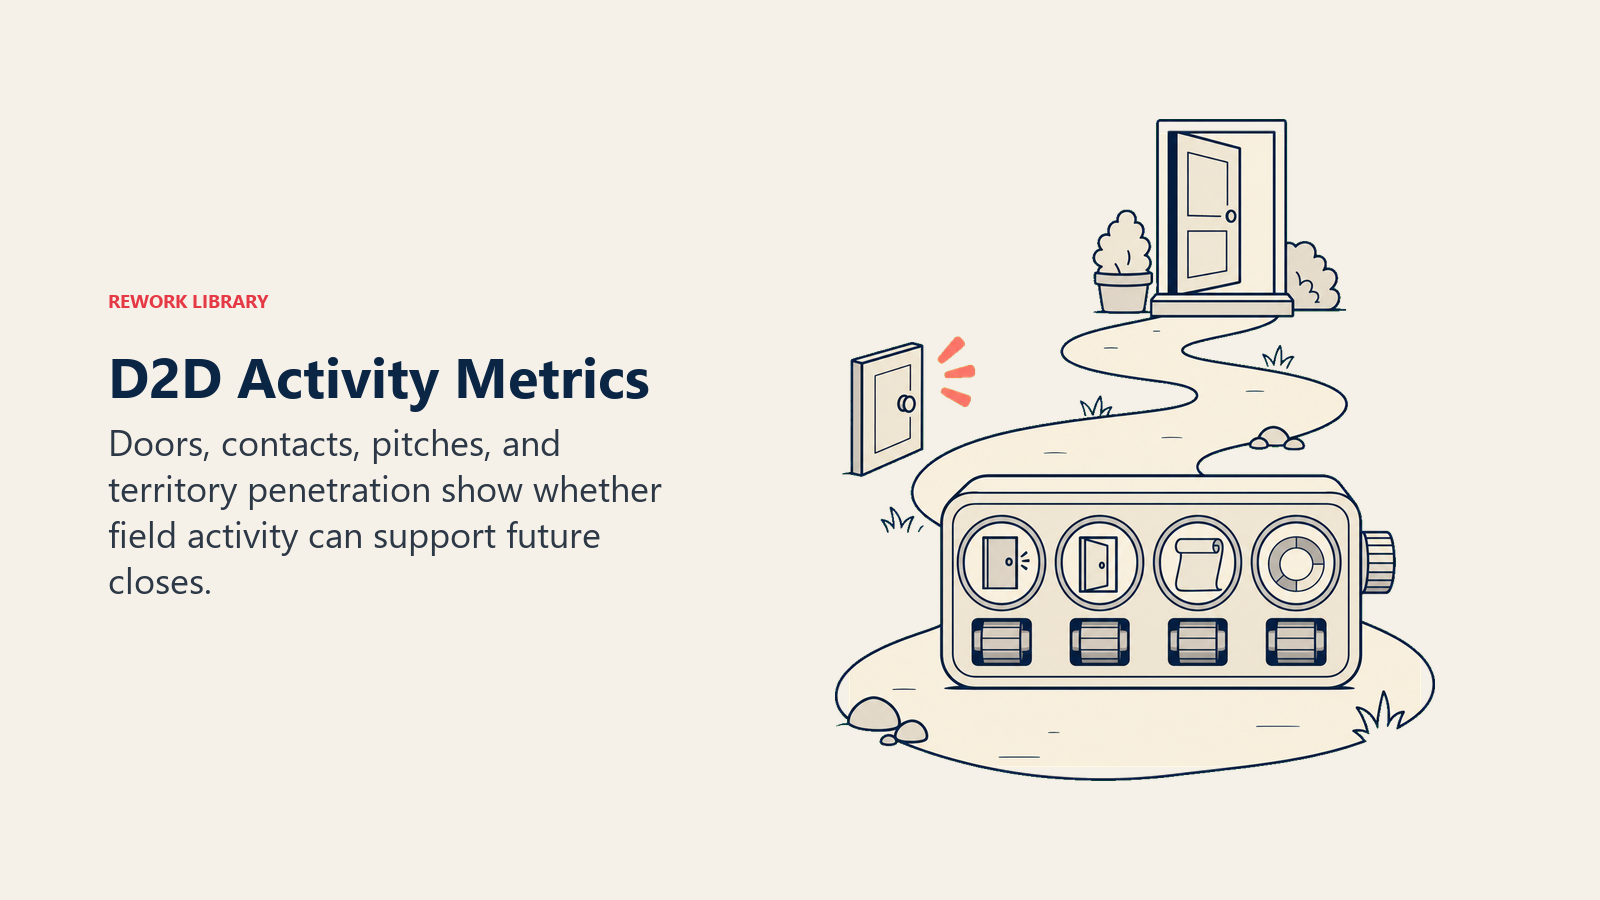
These metrics tell you what a rep is doing before you see what they're producing.
1. Doors Knocked Per Shift
The most fundamental field activity metric. How many doors did the rep physically knock in their shift?
Doors knocked is a proxy for effort and routing efficiency. A rep who knocks 60 doors in an 8-hour shift is working at roughly 7.5 doors per hour, which is low. A rep knocking 100-120 doors per shift in dense residential territory is pacing well.
Track this daily, by rep. Trends matter as much as absolute numbers. A rep whose door count drops from 110 to 85 over three weeks is either burning out, having personal issues, or changing their strategy (sometimes productively, sometimes not). Either way, the trend prompts a conversation.
Target: 80-120 doors per 8-hour shift in residential territory.
2. Contact Rate
Of every 100 doors knocked, how many result in a live conversation with a homeowner or decision-maker? This is your contact rate.
Contact rate is heavily influenced by the hours a rep works. Knocking between 6pm and 8pm on weekdays in most suburban markets produces contact rates of 40-55%. Knocking between 10am and 1pm on weekdays drops it to 20-30%. Reps who don't understand this work the wrong hours and wonder why nobody answers.
Contact rate also reflects territory type. Dense owner-occupied suburban neighborhoods produce better contact rates than mixed rental areas.
Target: 30-50% contact rate, higher during evening hours.
3. Pitch Rate (Contacts to Full Pitches)
Of the contacts made, what percentage receive a full pitch? A low pitch rate means reps are either disqualifying too aggressively (missing real prospects) or getting shut down before they can get into the pitch.
Pitch rate below 50% is worth investigating. It usually means the rep's opening line or first-30-seconds approach isn't engaging prospects well enough to earn time for the presentation. The door approach and first 30 seconds article covers specific techniques for improving this conversion.
Target: 55-75% of qualified contacts proceed to a full pitch.
4. Territory Penetration Rate
Of the addresses assigned in a given territory, what percentage has the rep actually knocked? This is a coverage metric, not a conversion metric.
Many D2D teams discover through canvassing app data that their reps are covering 50-60% of assigned territory. They're cherry-picking the accessible blocks and skipping long driveways, apartment complexes, or streets that look less promising. But those skipped addresses often convert at similar rates to the easier ones.
Penetration rate below 75% is a red flag. It means the team is leaving leads on the table by not working the full territory.
Target: 80%+ of assigned addresses knocked per territory assignment period.
Conversion Metrics (Current Indicators)
These metrics measure how efficiently reps are converting activity into signed agreements.
5. Close Rate per Full Pitch
The core conversion metric: how many full pitches result in a signed service agreement? This is what most people mean when they say "close rate."
Close rates vary by vertical. Pest control typically runs 25-40% of pitches. Security monitoring runs 15-25% because the commitment is longer and the customer needs more convincing. Lawn care runs 20-35%. Fiber/telecom runs 25-40% in areas where the rep is offering a meaningful upgrade over the incumbent.
Compare each rep's close rate to the team median, not the top performer. Comparing to the top performer demoralizes the middle of the team without giving them actionable targets.
Target: Varies by vertical; benchmark against team median and vertical norms.
6. Same-Day Close Rate
For subscription home services, same-visit closes are the goal. Every callback or "let me think about it" that the rep agrees to turns into a deal that usually doesn't close. Same-day close rate measures the percentage of signed agreements that happen during the initial visit, not through a follow-up.
High same-day close rate indicates reps are creating urgency and handling objections effectively at the door. Low same-day close rate suggests reps are agreeing to callbacks too readily or failing to address the hesitation that causes customers to defer. The same-visit close techniques guide covers specific tactics.
Target: 85%+ of closed accounts should be same-day closes.
7. Accounts Per Rep Per Day
This is the output metric that rolls up all the above: how many new signed accounts does a rep produce on an average working day?
For a high-performing pest control rep in a dense suburban market, 5-8 accounts per day is achievable. For security, 2-4 is a realistic strong performance given longer pitch times. For fiber/telecom, 4-6 is common.
Don't average this metric over monthly or quarterly periods until you have at least 6 weeks of data per rep. Early-career reps ramp up over the first 4-6 weeks, and averaging too early misrepresents their trajectory. See onboarding and ramping new reps for realistic ramp curves.
Target: Varies by vertical; set based on veteran performance in your specific market.
8. Revenue Per Close
Not all closes are equal. A rep closing $45/month accounts consistently delivers less customer lifetime value (LTV) than a rep closing $65/month accounts at the same close rate. Revenue per close measures the average monthly recurring revenue of each signed account.
This metric incentivizes reps to present and close on higher-tier plans rather than defaulting to the entry-level plan to reduce price resistance. If your team's revenue per close is consistently below your average plan price, reps are underselling or defaulting to the cheapest option to get the signature.
Target: Within 10% of your ARPA target for that territory type.
Quality Metrics (Close Quality Indicators)
These metrics assess whether the accounts closed are actually good accounts.
9. Early Cancellation Rate (0-30 Days)
What percentage of newly signed accounts cancels within the first 30 days? This is the clearest signal of pitch quality and customer fit. When a customer cancels within 30 days, something went wrong: either the rep closed someone who wasn't genuinely qualified, set expectations the service couldn't meet, or used pressure tactics that created immediate buyers' remorse.
Track this by rep. A rep whose 30-day cancellation rate is 15% while the team average is 4% is closing low-quality accounts. They might have impressive gross close numbers that mask the problem entirely.
Target: Under 5% of accounts cancel within the first 30 days.
10. Days to First Service
After an account is signed, how many days until the first service visit or installation? This is the handoff metric that measures the gap between sales and operations.
Long gaps between close and first service are a churn risk. A customer who signs on Monday and doesn't hear anything by Friday is second-guessing the decision. Under the FTC's Cooling-Off Rule (16 CFR Part 429), in-home contract purchases have a 3-business-day rescission right, so every day without confirmation is a day the customer could legally cancel without penalty.
Target: First service scheduled within 3 business days of signing; first contact from operations within 24 hours.
11. Rescission Rate
What percentage of signed accounts exercise their right to cancel within the rescission window? A high rescission rate (above 8-10%) means something is happening at or after the close that triggers buyers' remorse: unclear terms, slow follow-up from the service team, or the rep having used high-pressure tactics that the customer regretted.
Rescission rate is often a lagging indicator of the pitch experience, not the service experience. Address it by reviewing rep recordings, improving the onboarding welcome call, and tightening the handoff process. See reducing early cancellations for specific intervention approaches.
Target: Under 8% of signed accounts rescind within the rescission window.
Retention Metrics (Lagging Indicators)
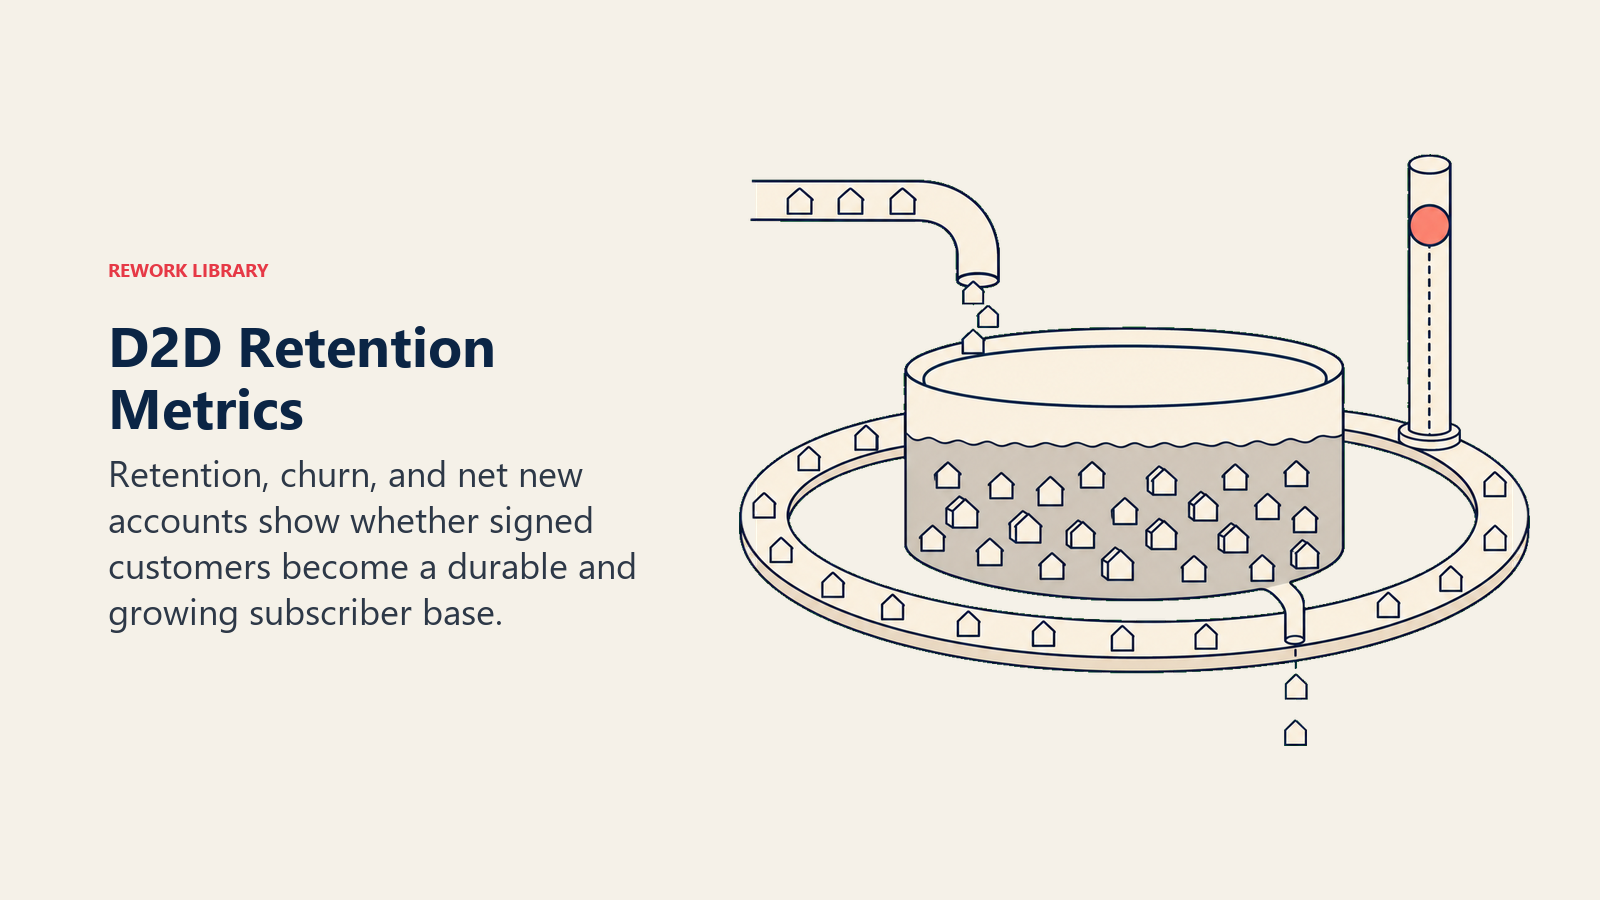
These metrics connect the sales team's work to the actual health of the subscription base over time.
12. 90-Day Retention Rate
Of all accounts closed in a given month, what percentage is still active 90 days later? This cohort analysis tells you the true quality of a month's closes better than the close count alone.
Track this by rep and by acquisition month. If the summer sales team's September cohort has a 78% 90-day retention rate while the year-round team's cohort has 88%, something about the summer team's approach is producing lower-quality accounts, even if their close numbers looked strong.
Target: 85%+ of accounts still active at 90 days.
13. 12-Month Retention Rate
Annual retention rate measures how many customers renew for a second year of service. This is the long-cycle health metric for the subscription base and the primary driver of LTV. See subscription unit economics and LTV for how this feeds the LTV calculation.
Target: 70-85% depending on vertical (security skews higher; seasonal services skew lower).
14. Monthly Churn Rate
The percentage of active accounts that cancel each month, measured across the whole subscriber base. Monthly churn is the complement of monthly retention: a 3% monthly churn rate means 97% retention that month.
This metric moves slowly because it's averaged across all active accounts. But it's the most important long-run indicator of whether the subscription business is healthy. A persistent 3.5% monthly churn rate compounds painfully over a year (roughly 35% annual churn). A 1.5% rate means only 16% of accounts churn annually, and the base grows steadily with modest new acquisition.
Target: Under 3% monthly churn for most home services verticals; under 2% for security and fiber where retention should be stronger.
15. Net New Accounts Per Month
This is the ultimate health metric for a subscription D2D business: gross new accounts closed minus accounts cancelled in the same month. Positive net new means the subscription base is growing. Flat or negative net new means you're running to stand still.
Net new accounts is the D2D equivalent of net revenue retention or net MRR growth. It's the number that tells investors, owners, and operators whether the business is actually expanding or just churning at speed.
Target: Positive and growing. A healthy scale-up targets 10-15% month-over-month growth in net new accounts during expansion phases.
How Do You Build the KPI Dashboard That Actually Gets Used?
You don't need to display all 15 metrics on a single screen. Organize them into two views:
Daily Field Dashboard (for reps and frontline managers):
- Doors knocked today
- Contacts made
- Full pitches delivered
- Accounts closed
- Revenue per close This view tells the rep whether today is on track before the day ends.
Weekly Manager Dashboard:
- Doors per rep per day (trend)
- Contact rate by rep
- Close rate per pitch by rep
- Early cancellation rate (last 30 days)
- Days to first service (last 30 days)
- Net new accounts for the week
Monthly Leadership Dashboard:
- 90-day retention cohort by acquisition month
- Monthly churn rate
- 12-month retention rate (rolling)
- LTV by rep or territory cohort
- Net new accounts trend
The door-to-door sales funnel article covers how to interpret the funnel ratios these metrics produce. For tracking territory-level performance, territory knock analytics goes deeper on what canvassing apps and geo-tagged data can surface.
Dashboards only matter if someone acts on what they show.
Making KPIs Actionable
The mistake most D2D managers make with metrics isn't tracking the wrong things. It's tracking the right things but not acting on them fast enough. A weekly metric review that surfaces a problem gives you six days of damage before intervention. A daily review gives you one.
Set up daily automated reports from your CRM or canvassing app. Flag any rep who falls below 70% of team median on doors knocked, contact rate, or close rate on two consecutive days. That's your signal to ride along or have a targeted coaching conversation before the week is lost.
KPIs aren't a reporting exercise. They're a diagnostic system. The faster you get the signal, the faster you intervene, and the less quota you lose waiting for a monthly performance review to tell you what already happened.
Learn more:
- Territory knock analytics
- Lead scoring systems (lead management library)
- Lead qualification frameworks (lead management library)
Quotable Nuggets
"Only 35% of field sales teams have 70% or more of their reps consistently hitting quota. Teams that track leading and lagging metrics alongside close rate are the ones closing that gap." (SPOTIO State of Field Sales 2026)
"Teams that provide at least three hours of weekly coaching report 30% lower rep churn. In D2D, where turnover above 50% annually is common, coaching frequency is a retention strategy that shows up in KPI trends before it shows up in headcount." (SalesRabbit 2025 Field Sales Report)
"A 3.5% monthly churn rate means roughly 35% of your subscriber base turns over annually. A 1.5% rate means only 16% churns. That 2-point difference in a single lagging metric can represent millions in lost LTV for a team writing 50+ accounts per month."

Senior Implementation Consultant
On this page
- Why KPIs Are Different for Subscription D2D vs. One-Time Sales
- Activity Metrics (Leading Indicators)
- 1. Doors Knocked Per Shift
- 2. Contact Rate
- 3. Pitch Rate (Contacts to Full Pitches)
- 4. Territory Penetration Rate
- Conversion Metrics (Current Indicators)
- 5. Close Rate per Full Pitch
- 6. Same-Day Close Rate
- 7. Accounts Per Rep Per Day
- 8. Revenue Per Close
- Quality Metrics (Close Quality Indicators)
- 9. Early Cancellation Rate (0-30 Days)
- 10. Days to First Service
- 11. Rescission Rate
- Retention Metrics (Lagging Indicators)
- 12. 90-Day Retention Rate
- 13. 12-Month Retention Rate
- 14. Monthly Churn Rate
- 15. Net New Accounts Per Month
- How Do You Build the KPI Dashboard That Actually Gets Used?
- Making KPIs Actionable