Subscription Retention Fundamentals for Door-to-Door Home Service Companies
Turn this article into takeaways for your work.


Each assistant summarizes the article only for you and suggests best practices for your work.
The pitch for the door-to-door subscription model is simple. Sign customers once. Collect recurring revenue. Grow by adding more accounts each season. On paper, that subscriber base should just keep compounding on its own.
In practice, it doesn't work that way. Subscribers cancel. The question isn't whether you'll have churn. It's whether your churn rate is slow enough for new sales to outpace losses, and whether your retention programs are actually compounding the base.
This article covers the fundamentals: how recurring-revenue door-to-door (D2D) companies think about retention, what the key levers are, and how to build systems that keep subscribers for years instead of months.
The Retention Math That Drives Everything
Before tactics, understand the economics. Annual retention rate determines almost everything about the financial health of a D2D subscription business. A company running 1,000 active subscribers at $60 a month is, in theory, generating $720,000 a year without a single additional sale. Whether that math actually holds up depends entirely on retention.
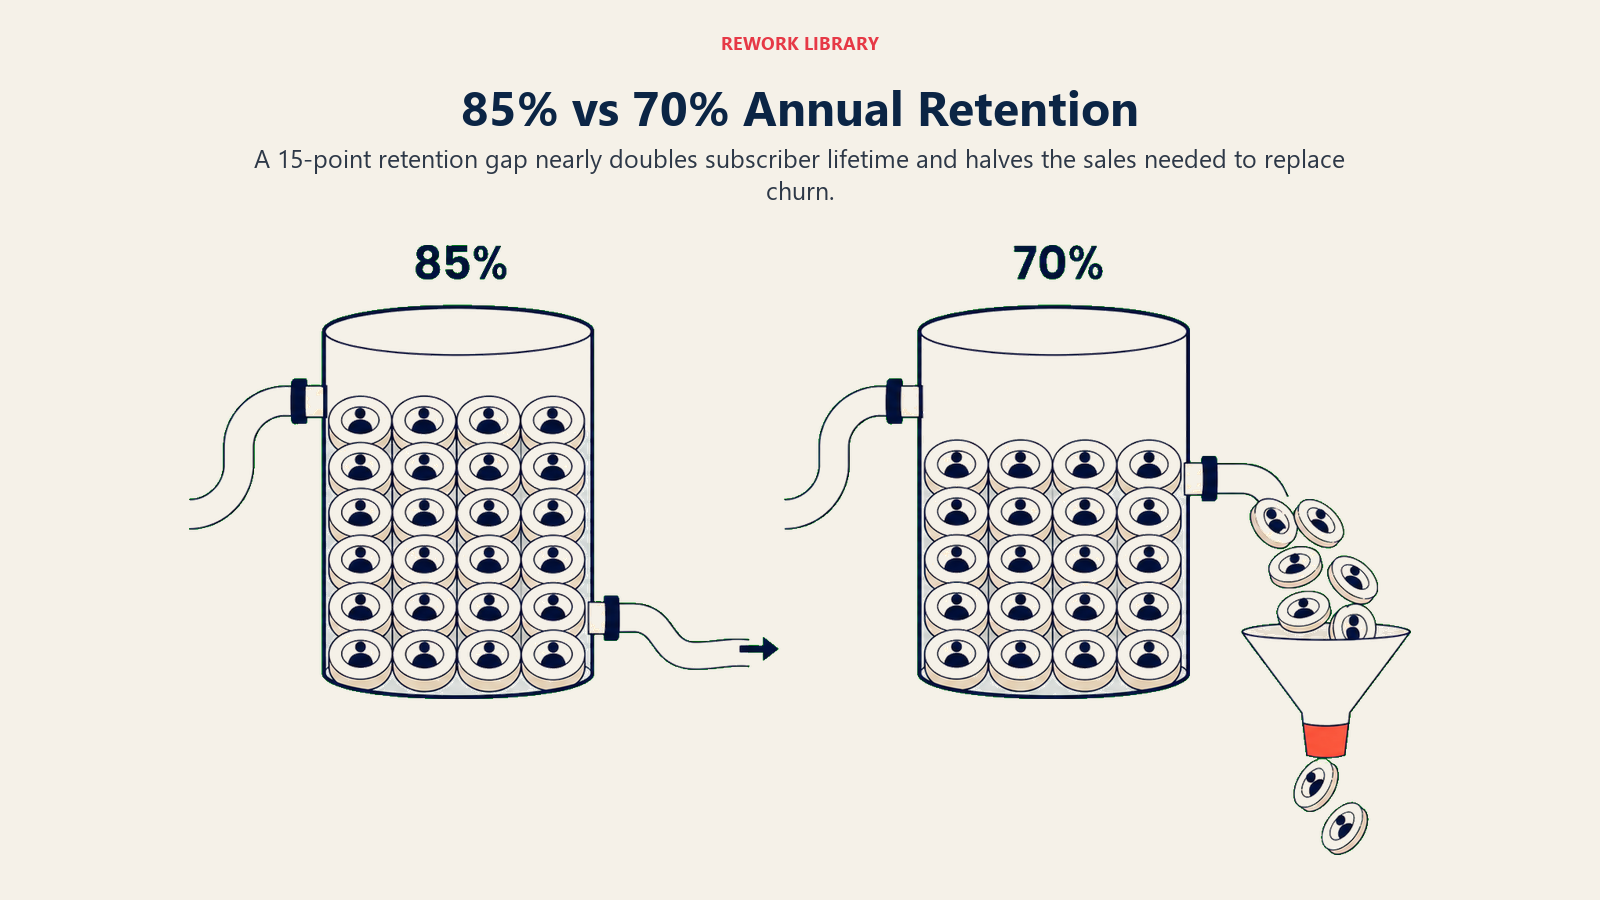
Consider two companies, both with 1,000 subscribers at $60 per month. Company A retains 85% of subscribers annually. Company B retains 70%.
| Metric | Company A (85% retention) | Company B (70% retention) |
|---|---|---|
| Monthly revenue (Year 1) | $60,000 | $60,000 |
| Accounts lost per year | 150 | 300 |
| New accounts needed just to stay flat | 150/year | 300/year |
| Cost to replace lost accounts (at $200 CAC) | $30,000/year | $60,000/year |
| Average subscriber LTV (at 85% vs 70% annual) | ~38 months | ~20 months |
That 15-point difference in annual retention nearly doubles customer lifetime value and halves the replacement cost. If Company A and Company B have the same sales team and the same sales efficiency, Company A is dramatically more profitable. Frederick Reichheld's research at Bain & Company, published in Harvard Business Review, found that a 5% increase in customer retention rates can lift profits by 25% to 95%, depending on the business model. In a subscription context, the effect compounds every year a subscriber stays.
That's why retention fundamentals matter more than they appear to. The economics compound in both directions: good retention makes growth efficient; poor retention forces you to run just to stay still. See subscription unit economics and LTV for the full lifetime value (LTV) model.
Key Facts: Subscription Retention Economics
- Strong pest control businesses maintain annual customer retention rates of 80% to 90%, per industry practitioners tracked by Wexford Insurance, with the range between 85% and 92% representing best-in-class performance for residential accounts.
- Low-turnover D2D field teams are 2.4 times more likely to use consolidated tech stacks of one or two systems, according to SPOTIO's State of Field Sales research. Technician continuity, enabled by stable operations teams, is one of the direct drivers of higher customer retention.
- A 15-percentage-point difference in annual retention (85% vs. 70%) on a 1,000-account subscriber base at $60 per month roughly doubles average customer lifetime value and cuts replacement acquisition cost in half. (Rework Analysis, modeled on reported D2D CAC of $200 per account)
The Three Pillars of Retention
The Three Pillars Framework: the model for diagnosing why subscribers stay or leave in D2D home services. Pillar 1 is Delivered Value (does the service actually work?). Pillar 2 is Felt Value (does the customer perceive it working?). Pillar 3 is Relationship Capital (does the customer trust and prefer this company over alternatives?). Each pillar can fail independently. A company can deliver excellent pest control but fail to communicate what was done (Felt Value gap). A company can have strong service and strong communication but rotate technicians every visit (Relationship Capital gap). Diagnosing which pillar is weak is the first step before deploying any retention tactic.
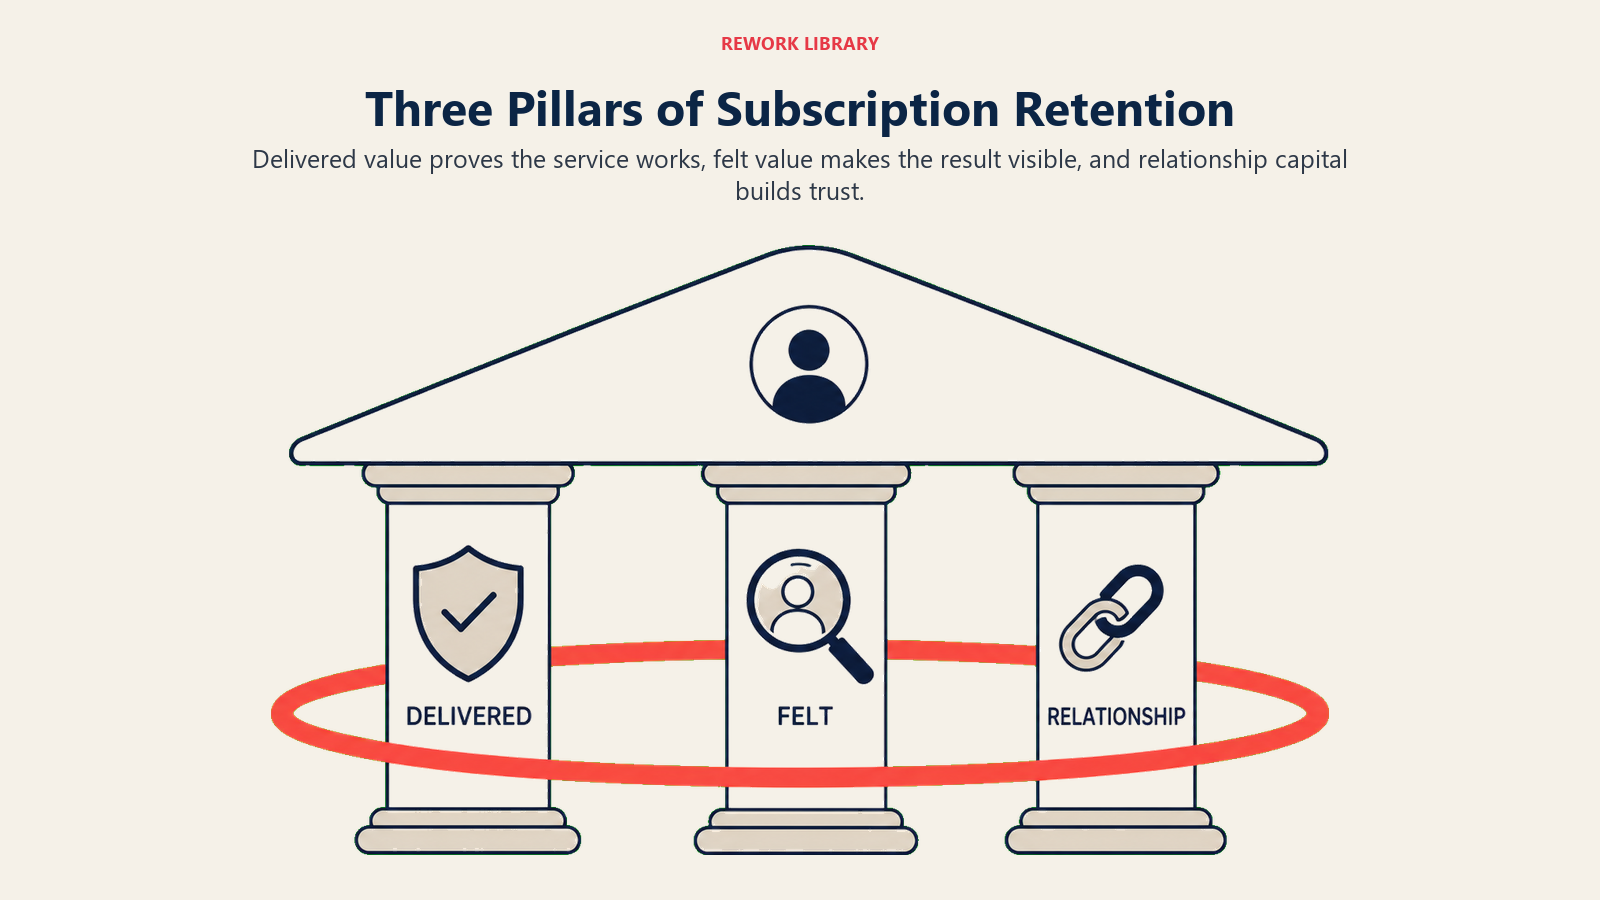
Sustainable retention in D2D home services rests on three things: delivered value, felt value, and relationship capital. You need all three. Miss any one of them and churn risk climbs.
Pillar 1: Delivered Value
This is the most obvious one: does the service actually work? Are the bugs gone? Is the lawn healthier? Did the security system function correctly? Does the fiber connection perform as promised?
Delivered value is the non-negotiable floor. No retention program rescues accounts from a service that doesn't perform. Before investing in retention tactics, make sure your core service quality is consistent and measurable.
Key questions:
- What outcome does the customer actually care about?
- How do you measure whether that outcome is being achieved?
- Is there variance between technicians in how thoroughly they deliver?
- What's the re-service or warranty policy when service falls short?
Pillar 2: Felt Value
Felt value is what the customer perceives, which often differs from delivered value. A lawn care company might be treating a customer's lawn effectively, but if the customer doesn't notice any visible improvement, they won't renew.
The gap between delivered and felt value is a communication problem. Companies close this gap by:
- Sending before/after comparisons (photos, metrics)
- Proactively communicating what was done and why
- Setting outcome expectations that the customer can verify themselves
- Reminding customers of the negative outcome they'd have without the service ("Without quarterly treatment, most homes in your area re-infest within 3 months")
Felt value is particularly important in pest and fiber, where the "success" of the service is often the absence of a problem, which is psychologically invisible.
Pillar 3: Relationship Capital
Relationship capital is the trust and familiarity built between the customer and the company over time. It's why a customer who has a minor service problem with Company A stays, while they'd cancel Company B immediately for the same issue.
Relationship capital accumulates through:
- Consistent, reliable service delivery (same tech where possible)
- Proactive communication from a named human, not just a company
- Remembering customer-specific details ("We know you prefer morning appointments")
- Resolving problems quickly and completely
In D2D businesses, relationship capital often starts with the rep who sold the account. Customers who felt the rep was honest and personable are more forgiving of early service issues. That initial deposit of relationship capital is part of why ethical selling at the door directly affects retention, not just close rates.
Operational Retention Systems
Understanding the three pillars is the framework. Implementing it requires specific operational systems.
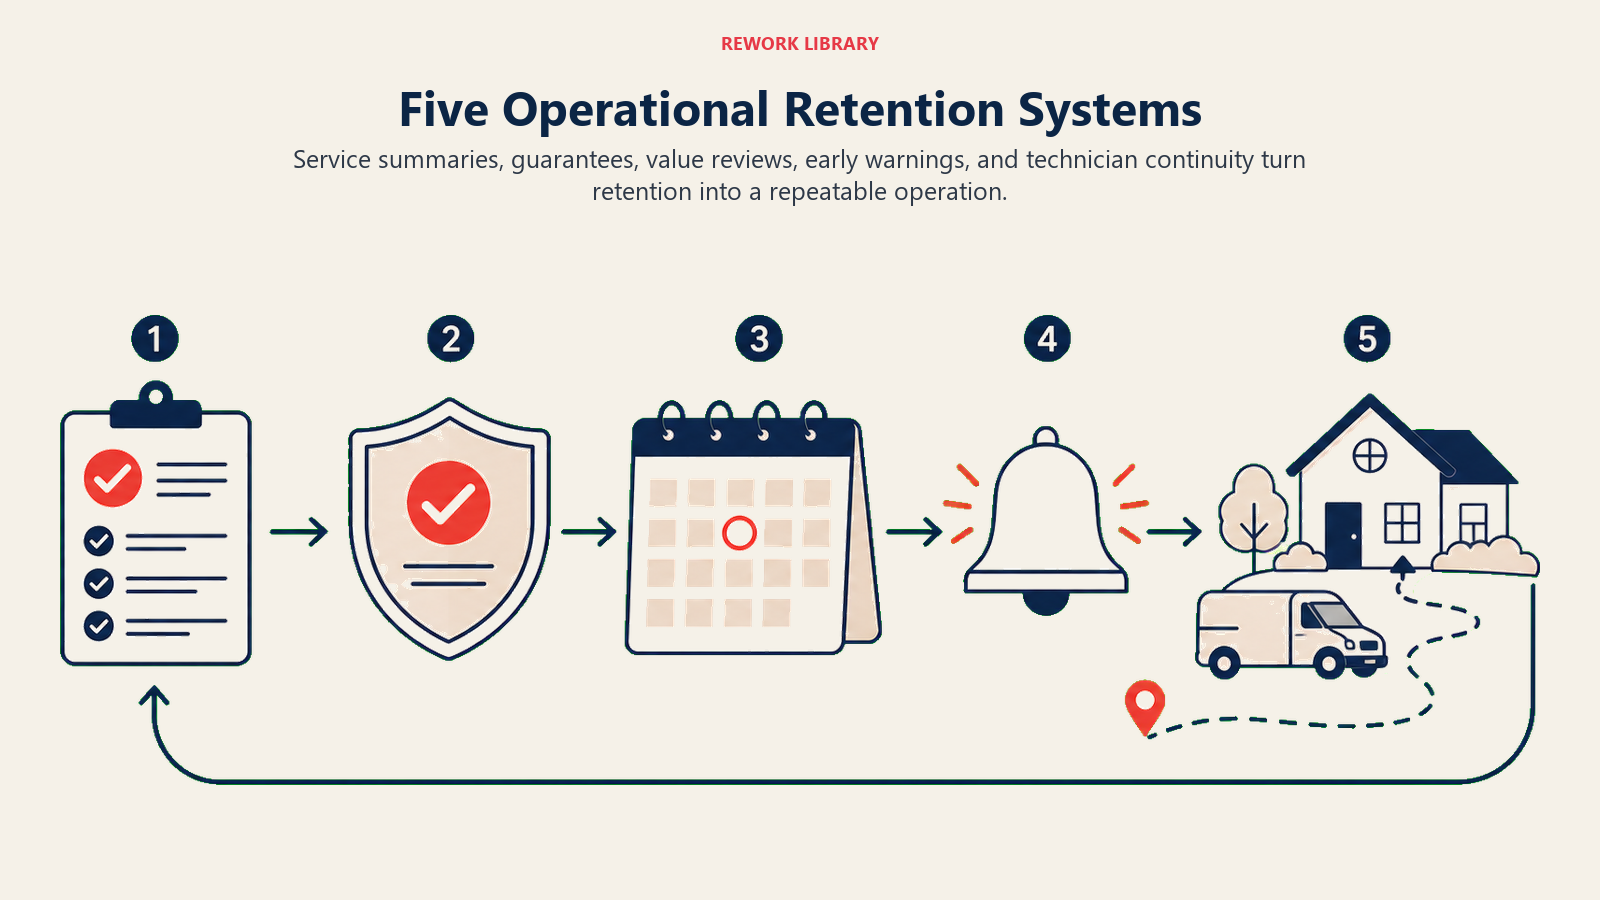
System 1: The Proactive Service Summary
After every service visit, send a brief summary of what was done. Not a receipt, but a narrative:
"We treated your home's perimeter and interior today, focusing on the kitchen and garage where we noticed entry points. We placed bait stations near the northeast corner. No active nests found. Next visit: [date]."
This takes 2 to 3 minutes to write per job (or can be templated with tech notes) and significantly increases felt value. Customers remember and appreciate knowing what happened, especially for services like pest control where the tech often does work in spaces the homeowner never sees.
System 2: The Service Guarantee with Easy Claims
One of the most underused retention tools in D2D home services is a proactively communicated service guarantee. Not buried in the contract, but actively surfaced:
"If you see any pest activity between visits, call us and we'll come back at no charge within 48 hours."
Most customers don't use this. But knowing it exists reduces the anxiety that drives cancellations, especially for newer subscribers who aren't yet sure the service works. And for the minority who do use it, a fast re-service response is one of the highest-rated retention drivers in customer satisfaction data.
System 3: Annual Value Reviews
At the 11-month or 12-month mark, a proactive outreach from someone at the company does two things. It catches renewal hesitation before it becomes cancellation. And it demonstrates that the company values the long-term relationship, not just the monthly charge.
The annual value review call or email should cover:
- What was done over the past year (number of services, any special treatments)
- What problems were addressed or prevented
- What's coming next season
- A thank-you for their continued business, and optionally a loyalty acknowledgment (discount, free add-on service, referral incentive)
Customers who receive this kind of deliberate annual check-in renew at significantly higher rates than customers who receive only transactional communication.
See service quality and renewal for a deeper framework on this approach.
System 4: Win-Back Prevention (Early Warning)
The best win-back campaign is one that doesn't need to happen because you caught the at-risk account before it cancelled. Building an early warning system into your CRM creates this capability.
Early warning indicators in D2D subscriptions include:
| Warning Signal | Risk Level | Recommended Response |
|---|---|---|
| Skipped or rescheduled 2+ appointments | Medium | Proactive outreach to resolve access issue |
| No response to last 2 service notifications | Medium | Verify contact info, re-engage |
| Filed a complaint or raised a concern | High | Manager callback within 24 hours |
| Submitted cancellation inquiry | Critical | Immediate save attempt (see below) |
| Billing declined | High | Quick friendly resolution, not collections posture |
| Low satisfaction score after any service | High | Manager callback within 24 hours |
Companies that monitor these signals and trigger human outreach at the appropriate moment retain 15 to 25% more at-risk accounts than companies that only act after a cancellation request is received. The churn prediction and save offers article covers the predictive side of this in depth.
System 5: Consistent Technician Assignment
This one is often dismissed as operationally inconvenient, but the data is clear: customers who see the same technician consistently have higher satisfaction and lower cancellation rates than customers who see a different person each time.
The relationship between a technician and a homeowner is real and valuable. The tech knows the property, knows the customer's preferences, and can notice changes or issues that a new face would miss. The customer trusts the tech, asks fewer anxious questions, and is more forgiving of minor issues.
Where possible, assign technicians to geographic zones and maintain those assignments over time. The scheduling efficiency loss is more than offset by the retention gain, though how much that gain matters still depends on which service you're running.
How Does Retention Differ by Service Type?
Retention dynamics differ across D2D subscription categories. Here's a quick profile of each.
Pest Control
Primary churn driver: Customer doesn't perceive bugs are a problem anymore, so questions why they're paying.
Retention key: Proactive communication about what was done and what was prevented. Visual evidence where possible. Reminder of re-infestation risk.
Average annual retention rate (industry): 72 to 80% Best-in-class: 85 to 90%
Lawn Care
Primary churn driver: Visible dissatisfaction with lawn quality, price sensitivity in off-season.
Retention key: Before/after photos, scheduled communication about seasonal treatment plans, proactive issue spotting by techs.
Average annual retention rate: 68 to 76% Best-in-class: 82 to 88%
Home Security
Primary churn driver: Never uses the system, forgets its value, moves to a house the system doesn't cover.
Retention key: Smart home integration, regular "your system is active" check-ins, easy service transfer when moving.
Average annual retention rate: 80 to 87% Best-in-class: 90 to 95%
Fiber/Internet
Primary churn driver: Competitor offers lower price, service outage experience, moves.
Retention key: Speed/reliability consistency, fast outage response, loyalty pricing at renewal.
Average annual retention rate: 75 to 85% Best-in-class: 88 to 94%
The Retention Culture Problem
Many D2D companies invest heavily in sales culture and training but treat retention as an operations afterthought. The result is a revolving door where the sales team runs full speed and churn absorbs most of the gains.
Building a retention culture means treating subscriber lifetime as a shared metric across sales, operations, and customer service. When the sales team's compensation structure rewards long-term subscriber retention and not just gross sign-ups, the culture shifts. Reps start caring about who they sell to and how they hand the account off. Operations starts taking the first-service experience as seriously as the close. Bain & Company's work on the economics of customer loyalty shows that loyalty leaders in competitive industries grow revenues more than twice as fast as their peers, in large part because retained customers spend more, cost less to serve, and generate referrals that reduce acquisition costs.
For how this cross-functional alignment works in practice, see sales and service operations alignment.
Key Retention Metrics to Track
Every D2D subscription business should have these on a weekly dashboard:
| Metric | Formula | Target |
|---|---|---|
| Monthly churn rate | Cancellations / Active subscribers | Under 2% |
| Annual retention rate | 1 - annual churn | 82%+ |
| Net Subscriber Growth | New subscribers - Cancellations | Positive monthly |
| Satisfaction score (customer satisfaction score, or Net Promoter Score/NPS) | Collected post-service | 4.0+ / 10 → NPS 40+ |
| Re-service rate | Re-service calls / Total service visits | Under 8% |
| Technician retention rate | By tech (correlates with customer retention) | Tracked per tech |
See D2D sales KPIs and metrics for a complete dashboard framework that ties retention metrics to sales performance.
Why Is Churn a Lagging Indicator?
One final principle to internalize: by the time a customer cancels, the retention failure happened weeks or months earlier. The cancellation call is just when you find out.
That means the most important retention work happens proactively: in the first service experience, in the monthly communication cadence, in the early warning system that catches dissatisfied customers before they pick up the phone.
Companies that treat churn as a reactive problem, something to address after a customer calls to cancel, will always be playing catch-up. Companies that treat retention as an ongoing operational discipline, built into every service interaction and customer touchpoint, build subscriber bases that actually compound.
That compounding is what makes the D2D subscription model genuinely powerful. Get the fundamentals right and the math starts working for you instead of against you.
For the complete framework on managing at-risk accounts and save strategies, continue with churn prevention strategy.
Learn more: Retention Fundamentals
"Two D2D subscription companies can run the same size sales team and post the same close rate. A 15-point gap in annual retention is still enough to decide which one is profitable and compounding, and which one is just running to stay still."
"Felt value is the most common retention failure that companies don't diagnose. The service is working. The customer just doesn't know it's working. A two-sentence post-service summary sent by SMS costs almost nothing and closes this gap for the customers most likely to cancel silently."
"Customers who see the same technician consistently cancel at lower rates than customers who see a different face each visit. The relationship between a homeowner and a technician is a genuine retention asset. Disrupting it has a real cost that doesn't appear in scheduling efficiency models. (Rework Analysis)"
Frequently Asked Questions about Subscription Retention Fundamentals for Door-to-Door Home Service Companies
What are the key drivers of subscription retention in D2D home services?
The three core drivers are delivered value (does the service actually work?), felt value (does the customer perceive that it works?), and relationship capital (does the customer trust the company enough to stay through minor issues?). Most early churn comes from felt value failures, where the service is delivering but the company isn't communicating what it's doing or why.
What annual retention rate should a D2D home service company target?
Well-run operations typically target 82% or higher annual retention, with best-in-class pest control businesses achieving 85% to 92%. A company below 70% annual retention is almost certainly running the subscriber base at a loss, because the acquisition cost of replacing lost accounts exceeds the margin generated by the remaining base.
How does technician consistency affect retention rates?
Customers assigned to a consistent technician report higher satisfaction and cancel at lower rates than customers who see a different person each visit. The technician knows the property, knows the customer's preferences, and builds accumulated trust that makes minor service issues more forgivable. Where operationally feasible, assigning technicians to fixed geographic zones and maintaining those assignments is a retention investment that typically outweighs the scheduling convenience of flexible assignment.
What is the proactive service summary and how does it improve retention?
A proactive service summary is a brief, plain-language message sent after every service visit describing what was done and why, what was found, and when the next visit is scheduled. It closes the gap between delivered value and felt value, particularly in services like pest control where the technician's work is largely invisible to the homeowner. This communication costs 2 to 3 minutes per job to produce (or can be templated from tech notes) and reduces "I'm not sure this is working" cancellations.
What early warning signals predict subscriber churn before it happens?
The most reliable early signals include: skipping or rescheduling two or more consecutive appointments, no response to two or more service notifications, submitting a complaint or re-service request, a billing decline, a low satisfaction score after any service, and account tenure reaching 10 to 14 months (approaching annual renewal). Each signal has a recommended response, from proactive outreach on medium-risk signals to manager callbacks on critical ones.
Why does retention matter more than sales volume in the D2D model?
Because the economics compound. A high-retention company keeps most of its subscriber base each year and only needs to replace a small fraction to stay flat. A low-retention company loses a much larger share and needs a proportionally bigger new-sales engine just to hold its position, as the retention math table above shows. The first company's sales team is building; the second company's sales team is treading water. Retention determines whether growth is possible at the sales efficiency your team can realistically sustain.
How should D2D companies think about the annual value review?
A proactive outreach at the 11 to 12-month mark, before the natural renewal decision point, does two things. It catches renewal hesitation while there's still time to address it. And it signals that the company values the relationship, not just the monthly charge. Customers who receive a deliberate annual check-in that summarizes what was done and thanks them for their business renew at higher rates than customers whose only annual contact is a billing statement.

Senior Implementation Consultant
On this page
- The Retention Math That Drives Everything
- The Three Pillars of Retention
- Pillar 1: Delivered Value
- Pillar 2: Felt Value
- Pillar 3: Relationship Capital
- Operational Retention Systems
- System 1: The Proactive Service Summary
- System 2: The Service Guarantee with Easy Claims
- System 3: Annual Value Reviews
- System 4: Win-Back Prevention (Early Warning)
- System 5: Consistent Technician Assignment
- How Does Retention Differ by Service Type?
- Pest Control
- Lawn Care
- Home Security
- Fiber/Internet
- The Retention Culture Problem
- Key Retention Metrics to Track
- Why Is Churn a Lagging Indicator?