Subscription Unit Economics and LTV for Home Services D2D
Turn this article into takeaways for your work.


Each assistant summarizes the article only for you and suggests best practices for your work.
A lawn care rep closes a deal for a $65/month premium lawn plan. Her manager congratulates her on the close. But what did that close actually generate for the business?
Not $65. Not even close.
To understand what that account is really worth, you need to run the unit economics: expected lifetime, gross margin on service delivery, cost to acquire that customer, and the probability she'll still be subscribing two years from now. When you do the math, a $65/month close might represent $800 in lifetime value to the business, or it might represent $2,400, depending on how well you retain customers and how efficiently you're running your acquisition operation.
That gap matters. It affects how much you pay reps in commission, how aggressively you invest in canvassing, how much you spend on service quality, and whether your business grows profitably or bleeds cash chasing volume.
This article builds the unit economics model from scratch for home services D2D subscription businesses.
The Core Metrics You Need
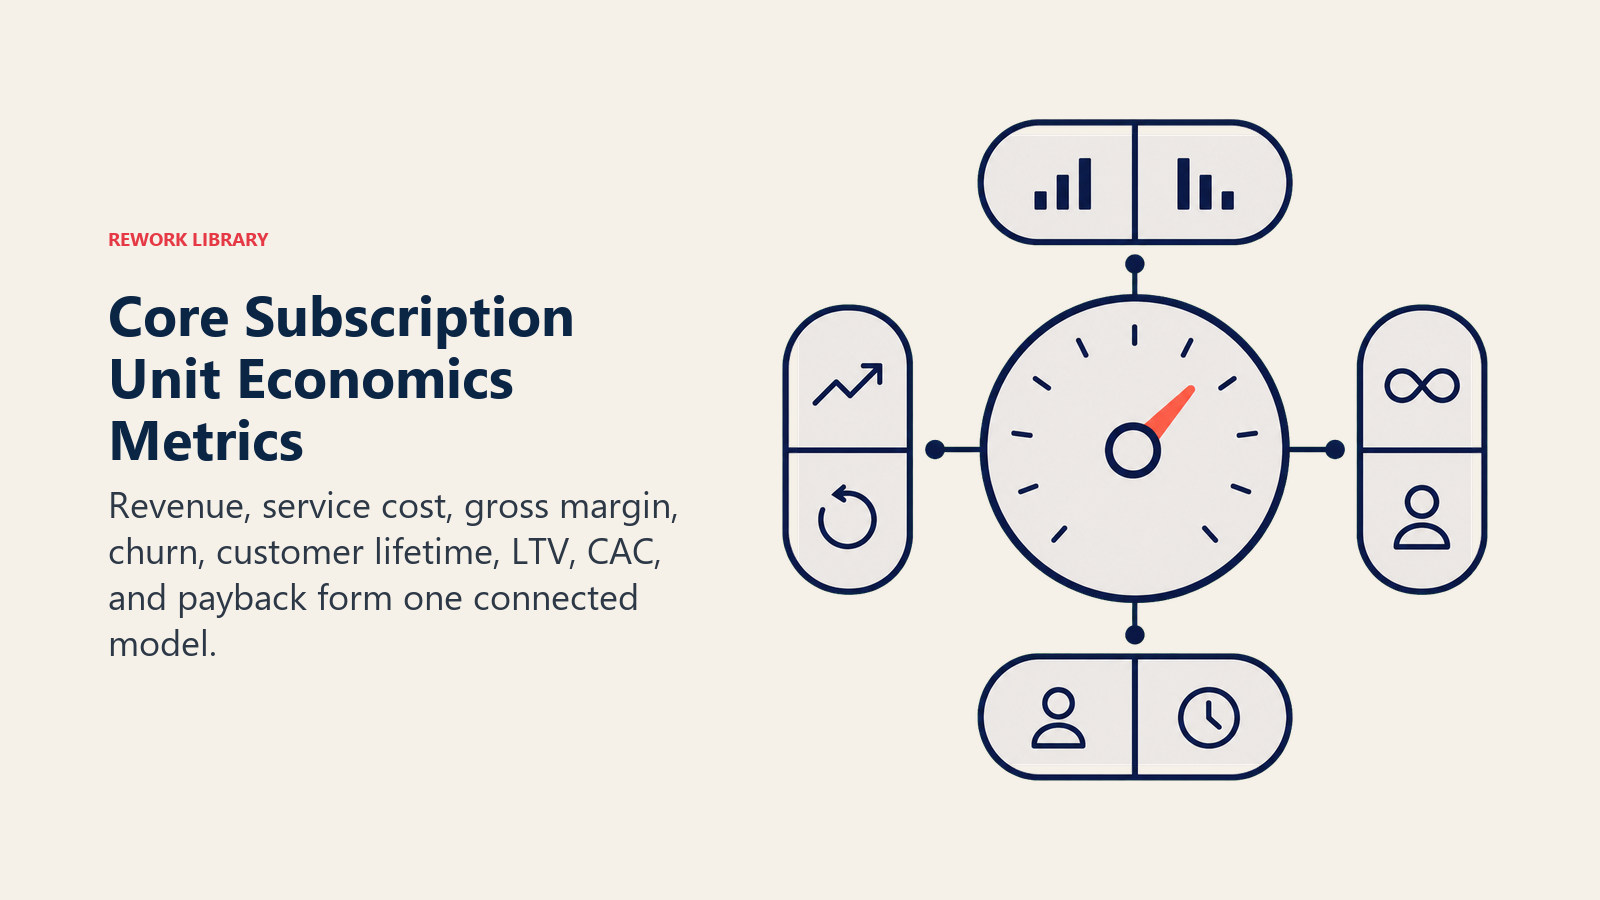
Before calculating customer lifetime value (LTV), you need four inputs. These numbers come from your operations data, your CRM, and your service records. If you don't have clean data on all four, start there, because the model is only as accurate as the inputs.
1. Average Monthly Recurring Revenue per Account (ARPA)
This is the average monthly revenue per active subscriber. Don't use your top-tier plan price; use the actual average across your customer base, because not everyone is on your premium plan. In pest control, this typically runs $40 to $70. In lawn care, $55 to $90. In security monitoring, $30 to $55. In fiber/telecom, $50 to $80.
2. Gross Margin per Account
Revenue isn't profit. Delivering the service costs money: technician time, materials, vehicle costs, scheduling overhead. Gross margin is revenue minus direct service delivery costs, expressed as a percentage. Home services gross margins typically run 40-65% at the account level, depending on vertical and operational efficiency.
3. Average Customer Retention (Months or Churn Rate)
How long does a typical customer stay subscribed? You can express this as average months of active service before cancellation, or as a monthly churn rate (percentage of active accounts that cancel each month). These two numbers are mathematically related: if your monthly churn rate is 3%, your average customer stays roughly 33 months (1 / 0.03).
4. Customer Acquisition Cost (CAC)
What does it cost to acquire one new subscriber? This includes rep commission, management overhead allocated to the sales operation, canvassing materials and tools, and any other direct acquisition costs. Don't include service delivery costs; those belong in the gross margin calculation.
Key Facts
- A 5% increase in customer retention can boost profits by as much as 95%, a range driven by margin structure and how long retained customers keep spending. (Bain & Company)
- Recurring revenue accounts for 85.2% of residential pest control service revenue in the U.S., giving the vertical a subscription-economics profile closer to SaaS than traditional contracting. (NPMA, 2024)
- Harvard Business Review research puts the cost of acquiring a new customer at 5 to 25 times more than retaining an existing one, which makes the LTV:CAC ratio the most important single number in a D2D subscription business. (HBR, 2014)
With those four inputs in hand, the formula itself is simple.
Calculating LTV: The Basic Formula
Once you have those four inputs, the basic LTV calculation looks like this:
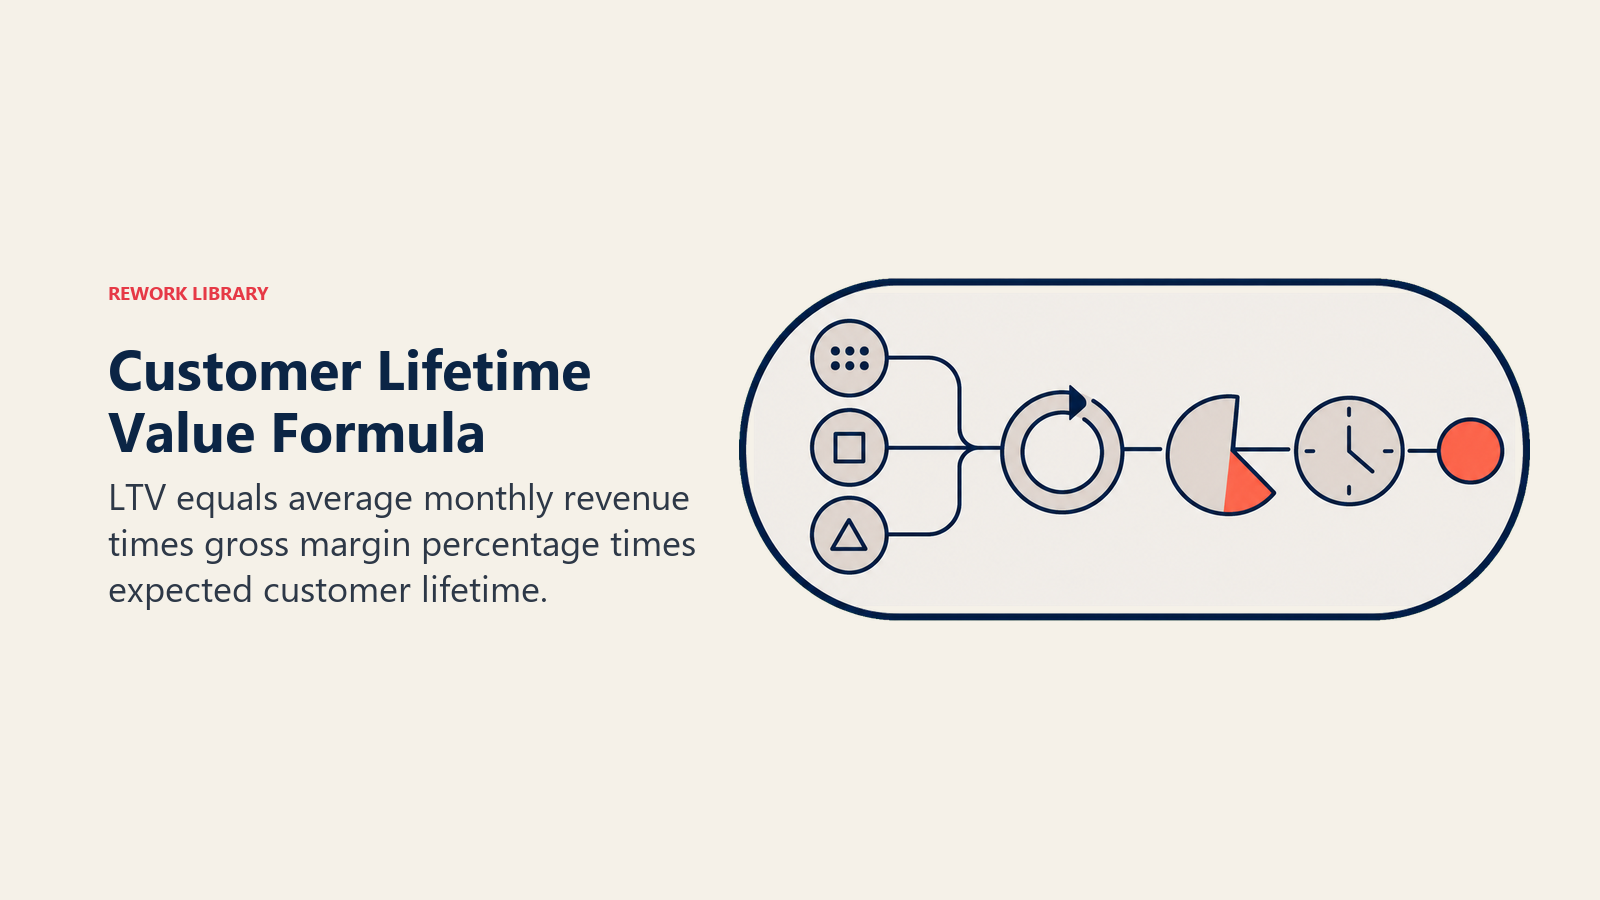
LTV = ARPA x Gross Margin % x Average Customer Lifetime (months)
Let's run it for a pest control business:
- ARPA: $55/month
- Gross margin: 55%
- Average monthly churn: 2.5% (average customer life = 40 months)
LTV = $55 x 0.55 x 40 = $1,210
That's what one closed account is expected to generate in gross profit over its lifetime. Every rep who closes a pest control account creates, on average, $1,210 in lifetime gross profit for the business.
Now for a security monitoring business:
- ARPA: $45/month
- Gross margin: 65% (monitoring is high-margin; no technician visit each cycle)
- Average monthly churn: 1.5% (average customer life = 67 months)
LTV = $45 x 0.65 x 67 = $1,960
Even though the ARPA is lower, the security business generates more lifetime value per account because it retains customers longer and has better margins.
The LTV-to-CAC Ratio: Are You Growing Profitably?
LTV alone doesn't tell you whether your business model is working. You need to compare it to what you're spending to acquire each customer.
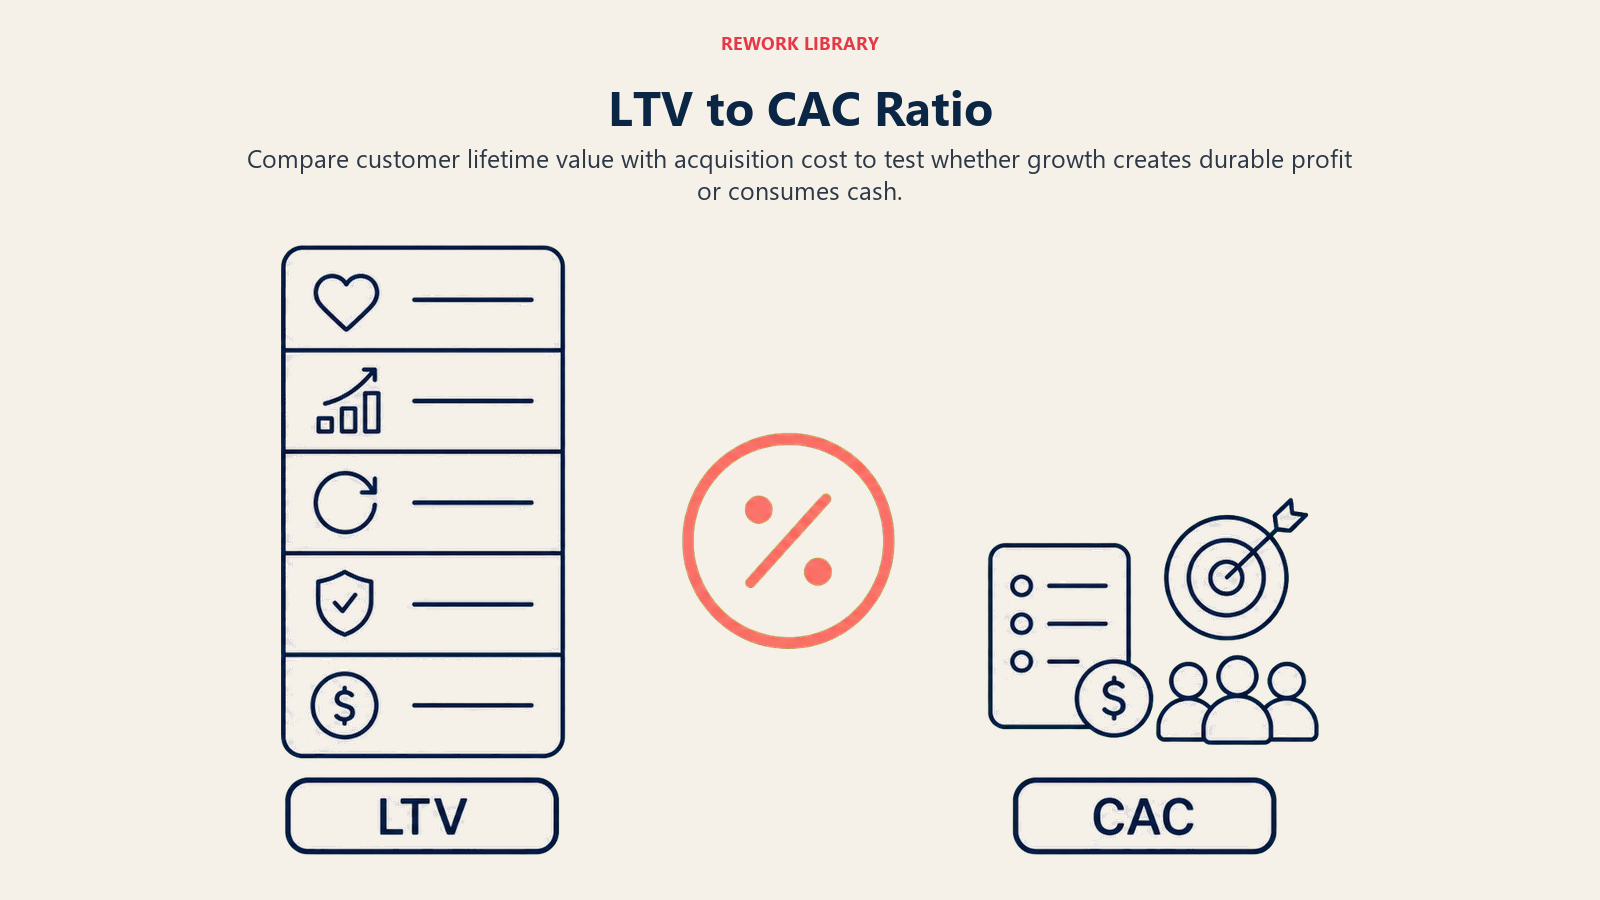
LTV:CAC ratio is the benchmark. A ratio above 3:1 suggests the business is acquiring customers profitably and has room to scale. Below 3:1, and you're either overpaying for acquisition or underretaining customers. Below 1:1, and you're destroying value with every closed account.
Let's continue the pest control example:
If CAC is $180 per new account (rep commission of $120 + $60 in allocated management and tool costs), and LTV is $1,210, the LTV:CAC ratio is 6.7:1. That's excellent. The company can afford to invest more in acquisition because each acquired account generates nearly seven times what it costs to win.
If a company in the same market is paying $350 per acquired account (heavy summer sales program costs, high commission rates, aggressive territory fees), the LTV:CAC ratio drops to 3.5:1. Still viable, but the margin is tighter and any increase in churn starts to hurt badly.
| Scenario | LTV | CAC | LTV:CAC | Interpretation |
|---|---|---|---|---|
| Pest control (efficient) | $1,210 | $180 | 6.7x | Strong unit economics, scale |
| Pest control (expensive acquisition) | $1,210 | $350 | 3.5x | Viable but watch churn |
| Security (standard) | $1,960 | $280 | 7.0x | Very strong, high retention |
| Lawn care (high churn) | $780 | $200 | 3.9x | Retention is the risk lever |
Payback Period: How Long Until You Break Even on a Customer?
LTV is a long-run number. Payback period tells you how long it takes to recover your CAC from a single account. This matters for cash flow, particularly in businesses that use summer sales teams where you're paying high commissions in Q2 and Q3 and hoping accounts stay active through Q4 and into next year.
Payback Period = CAC / (ARPA x Gross Margin)
For the pest control example:
Payback = $180 / ($55 x 0.55) = $180 / $30.25 = 6 months
After six months, the account has paid back its acquisition cost. Every month after that is pure profit contribution. A customer who stays 40 months contributes 34 months of margin beyond the payback point.
For a business with higher CAC and lower monthly value:
Payback = $280 / ($35 x 0.50) = $280 / $17.50 = 16 months
This business doesn't break even on a new account until the customer has been active for over a year. That's fine if retention is strong, but it raises the stakes on the one variable that can quietly wreck the whole model.
Why Does Churn Rate Destroy LTV Faster Than Anything Else?
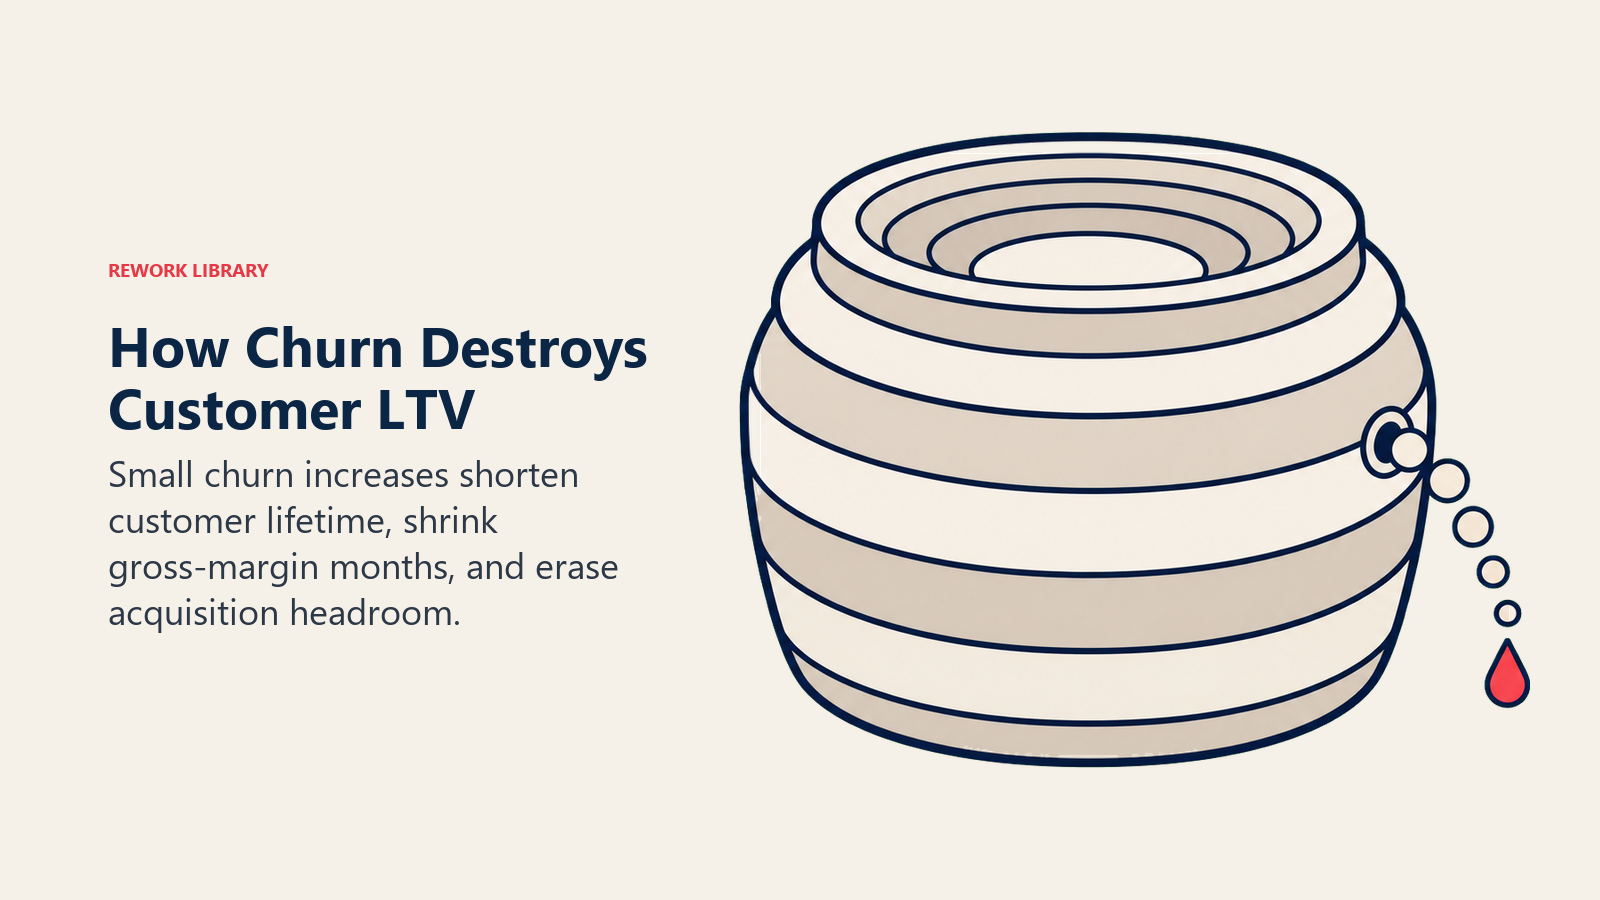
Churn is the variable that D2D subscription businesses underestimate most.
The Four-Input LTV Model: the calculation framework this article builds on, where Customer Lifetime Value equals ARPA multiplied by Gross Margin percentage multiplied by Average Customer Lifetime in months. Its power is not the formula itself but the four inputs it requires: ARPA, gross margin, average churn, and CAC. Organizations that track all four can make rational decisions about commission rates, territory expansion, and retention investment. Organizations that track only revenue and close count are flying blind on the economics that actually determine whether growth is profitable or just expensive.
Look at what happens to LTV as churn rate increases:
| Monthly Churn Rate | Average Customer Life | LTV (pest control, $55 ARPA, 55% margin) |
|---|---|---|
| 1.5% | 67 months | $2,024 |
| 2.5% | 40 months | $1,210 |
| 3.5% | 29 months | $877 |
| 5.0% | 20 months | $605 |
Going from 2.5% monthly churn to 3.5% monthly churn doesn't sound like much. It's one percentage point. But it cuts your LTV by 27%. That means every rep's closed account generates 27% less value, and your LTV:CAC ratio deteriorates accordingly.
This is why subscription-first companies invest heavily in retention. The returns on reducing churn from 3.5% to 2.5% are often larger than the returns on increasing the close rate by 5%. Both matter, but churn gets less attention because it happens quietly, account by account, rather than visibly the way a bad close day does. Bain and Company research on customer retention economics shows that a 5% increase in retention rates can boost profits by 25 to 95 percent, a range that reflects how dramatically retention leverage varies by industry and margin structure.
The D2D recurring revenue model article covers the structural approaches to retention. The subscription retention fundamentals guide goes deeper on specific tactics.
Seasonal Adjustments in the LTV Model
Lawn care and some pest control operations have meaningful seasonality. A customer in Minnesota cancels their lawn service in October and the question is whether they'll be retained for the following spring, not whether they'll stay active through winter.
This creates a different retention math problem. Annual retention rate becomes more relevant than monthly churn rate, and the payback period calculation needs to account for months where no billing occurs.
For seasonal businesses:
Annual Retention Rate = % of customers who renew at the start of the next service season. A healthy annual retention rate in lawn care is 70-80%. Below 60%, the business is essentially rebuilding a third of its customer base every year.
Adjusted LTV for Seasonal Businesses = (Annual ARPA x Annual Gross Margin) / (1 - Annual Retention Rate)
If annual ARPA is $480 ($60/month over 8 active months), gross margin is 50%, and annual retention is 72%:
LTV = ($480 x 0.50) / (1 - 0.72) = $240 / 0.28 = $857
This formula produces a "perpetuity value" of the account, assuming the retention rate holds. It's a useful approximation for planning purposes, though it can overstate slightly since retention rates drift over time.
How Do Unit Economics Shape Commission Design?
Once you understand LTV, you can make defensible decisions about how much to pay in rep commissions.
A common industry heuristic is that acquisition cost (including commission) should be no more than 25-30% of LTV. If your LTV is $1,210, you can afford CAC of $300-360. If you're paying $140 commission per close and your total allocated costs are $80 per account, your $220 CAC is well within range.
But that calculation assumes average churn. If a specific rep's accounts cancel at 2x the team average, their effective LTV contribution is lower. Some companies apply a retention multiplier to commission: the base pays at close, and an additional percentage pays at 90 days if the account is still active. This ties commission economics more tightly to LTV outcomes.
The commission and comp design for D2D guide covers how to structure these arrangements practically.
Value Selling Through the Unit Economics Lens
Unit economics also changes how sophisticated D2D reps can frame the conversation with homeowners, and how sales managers can train reps to articulate service value.
A homeowner who says "that's expensive" to a $65/month lawn plan hasn't done the math on what professional lawn care prevents: brown patches from fertilization mistakes, weed infestations that cost $300-400 to remediate, or reduced curb appeal that affects property value over time. The value isn't $65/month; it's the avoided cost plus the value of time and worry not spent. Harvard Business Review research puts the cost of acquiring a new customer at anywhere from 5 to 25 times more than retaining an existing one, which means framing service value clearly at the door isn't just good sales technique; it's the foundation of a sustainable acquisition model.
This framing maps to value selling principles. If you haven't worked with value-based selling in your training curriculum, the framework transfers well from B2B contexts to high-consideration subscription home services.
What to Track in Your CRM to Support Unit Economics
Unit economics modeling is only as good as your data hygiene. Here's what you need to track at the account level to maintain an accurate model over time:
- Sign date (for cohort analysis)
- Rep who closed the account (for rep-level LTV attribution)
- Plan/service tier (for ARPA accuracy)
- First service date (for activation rate tracking)
- Cancellation date (for churn rate by cohort)
- Cancellation reason (for churn root cause analysis)
- Upsell history (for ARPA expansion tracking)
With this data, you can build LTV curves by acquisition cohort (accounts closed in summer vs. fall), by rep, by territory, and by service tier. Patterns in those curves tell you exactly where to focus: which territories produce long-retention accounts, which reps close customers who churn early, which service tiers have the best economics.
The D2D sales KPIs and metrics guide covers how to build these dashboards from raw CRM and service data.
Building a Living Model
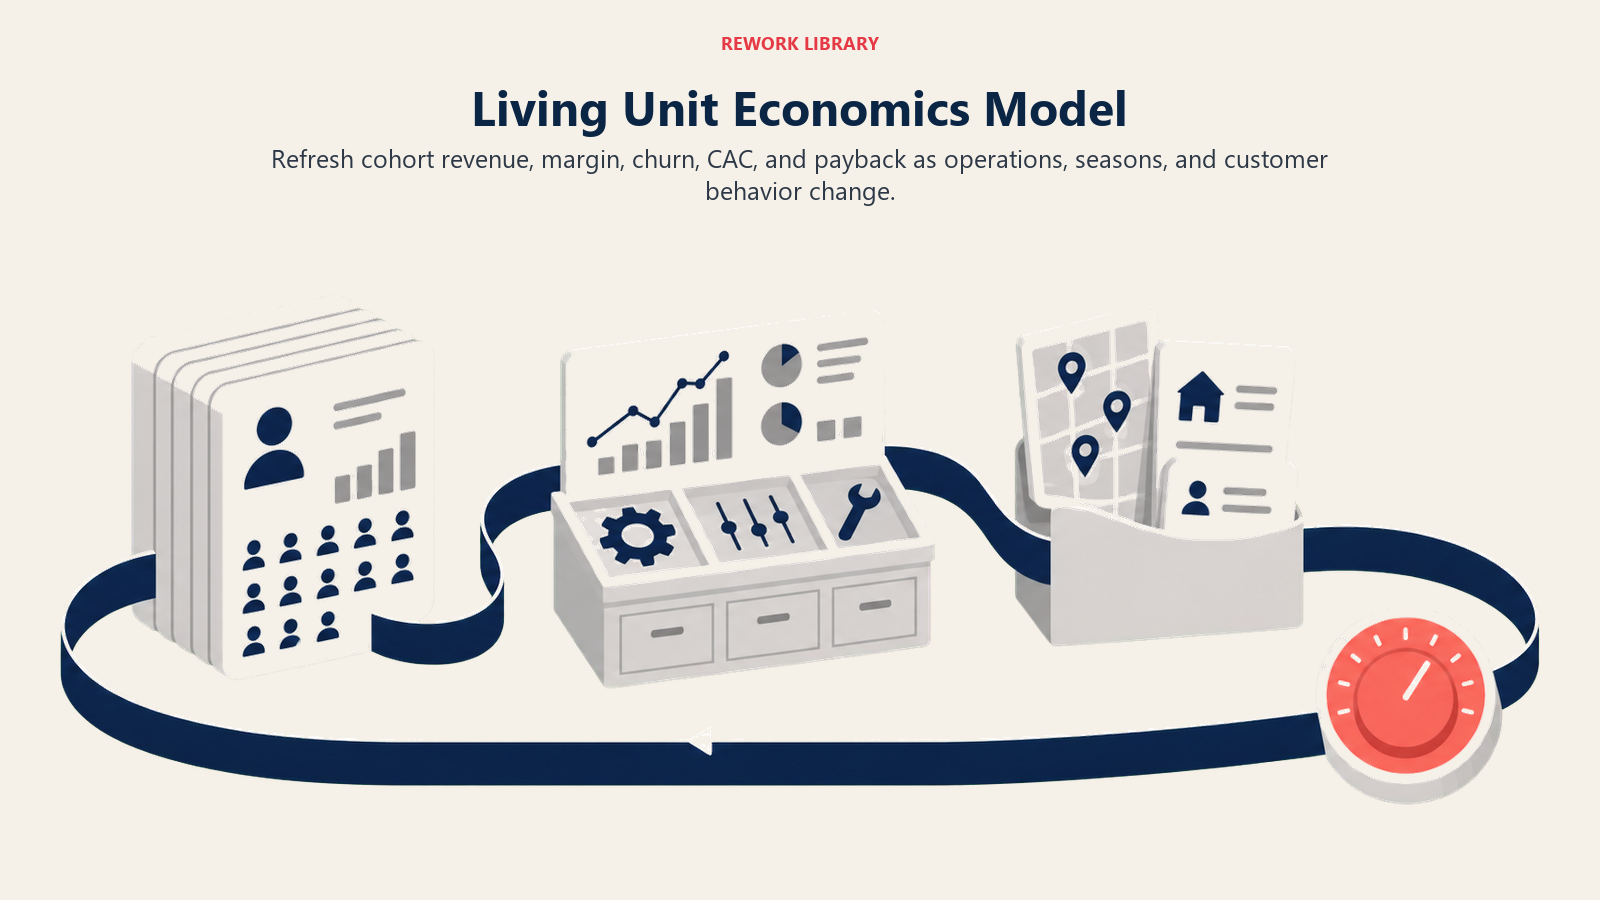
Unit economics aren't a one-time calculation. They shift as your service quality changes, as you enter new markets, as competition affects pricing, and as your rep team's composition evolves. Build the model in a simple spreadsheet with your four core inputs, review it quarterly, and update the inputs based on actual data.
The businesses that win in D2D subscriptions over the long term are the ones that know their numbers cold. When a manager knows their LTV is $1,210 and their CAC is $180, they can make rational decisions about hiring, territory expansion, and comp structure without guessing. When they don't know those numbers, they're setting commission rates by feel and expanding territories by optimism.
Know your unit economics. The rest of the strategy follows from the math.
For additional context on how this applies to churn prevention, churn prevention strategy from the post-sale management library offers frameworks that translate directly to home services subscription operations.
Quotable Nuggets
"Going from 2.5% to 3.5% monthly churn doesn't sound like much. But it cuts LTV by 27%, which means every rep's closed account is generating 27% less value for the business while the commission structure stays the same."
"A common acquisition cost heuristic says CAC should be no more than 25-30% of LTV. For pest control with a $1,210 LTV, that means you can afford to spend $300-360 to acquire each subscriber, including rep commission and overhead."
Frequently Asked Questions about Subscription Unit Economics and LTV for Home Services D2D
What is customer lifetime value (LTV) in D2D home services?
LTV is the total gross profit a single subscriber generates over the time they remain active. The formula is ARPA multiplied by gross margin percentage multiplied by average customer lifetime in months. For a pest control account at $55/month with 55% margin and 40-month average life, that's roughly $1,210 per closed account.
What LTV-to-CAC ratio is healthy for a D2D subscription business?
Above 3:1 is generally viable. Above 5:1 signals strong unit economics with room to invest more in acquisition. Below 3:1, the business is either overpaying for customers or losing them too fast. Below 1:1, every new account destroys value.
How does monthly churn rate affect LTV?
Dramatically. A move from 2.5% to 3.5% monthly churn cuts LTV by about 27%. At 5% monthly churn, your average customer stays only 20 months, and LTV drops by more than half compared to a 2.5% churn scenario. This is why subscription-first companies invest so heavily in retention: the return on reducing churn is usually larger than the return on improving close rate.
What's a realistic payback period for a D2D home services acquisition?
Six months is achievable for pest control with efficient acquisition costs (around $180 CAC, $55 ARPA, 55% margin). Higher CAC verticals like security monitoring can push this to 12-18 months. Any payback period over 18 months requires very strong long-term retention to justify the acquisition investment.
How should LTV estimates affect rep commission rates?
A common benchmark is keeping total acquisition cost (commission plus overhead) at 25-30% of expected LTV. If your LTV is $1,210 and you're paying $220 total per account (including rep commission), you're well within that range. If you're paying $400, you need either higher LTV (through retention) or lower costs to stay profitable at scale.
Does seasonal service affect LTV calculations?
Yes. For lawn care and similar seasonal businesses, annual retention rate replaces monthly churn as the key input. An annual retention rate of 72% and annual ARPA of $480 with 50% margin produces an LTV of about $857 using the adjusted formula. Seasonal businesses need to account for months with no billing when calculating payback periods.
What CRM data do you need to build accurate LTV models?
At minimum: sign date, service tier/ARPA, first service date, cancellation date, cancellation reason, and rep attribution. With this data you can build LTV curves by cohort (summer closes vs. winter closes), by rep, and by territory. Those curves tell you where to focus: which reps produce long-retention accounts and which territories generate subscribers who cancel early.

Senior Implementation Consultant
On this page
- The Core Metrics You Need
- Calculating LTV: The Basic Formula
- The LTV-to-CAC Ratio: Are You Growing Profitably?
- Payback Period: How Long Until You Break Even on a Customer?
- Why Does Churn Rate Destroy LTV Faster Than Anything Else?
- Seasonal Adjustments in the LTV Model
- How Do Unit Economics Shape Commission Design?
- Value Selling Through the Unit Economics Lens
- What to Track in Your CRM to Support Unit Economics
- Building a Living Model