Pipeline Coverage Analysis: Measuring Pipeline Health Against Quota Requirements
Turn this article into takeaways for your work.
Each assistant summarizes the article only for you and suggests best practices for your work.
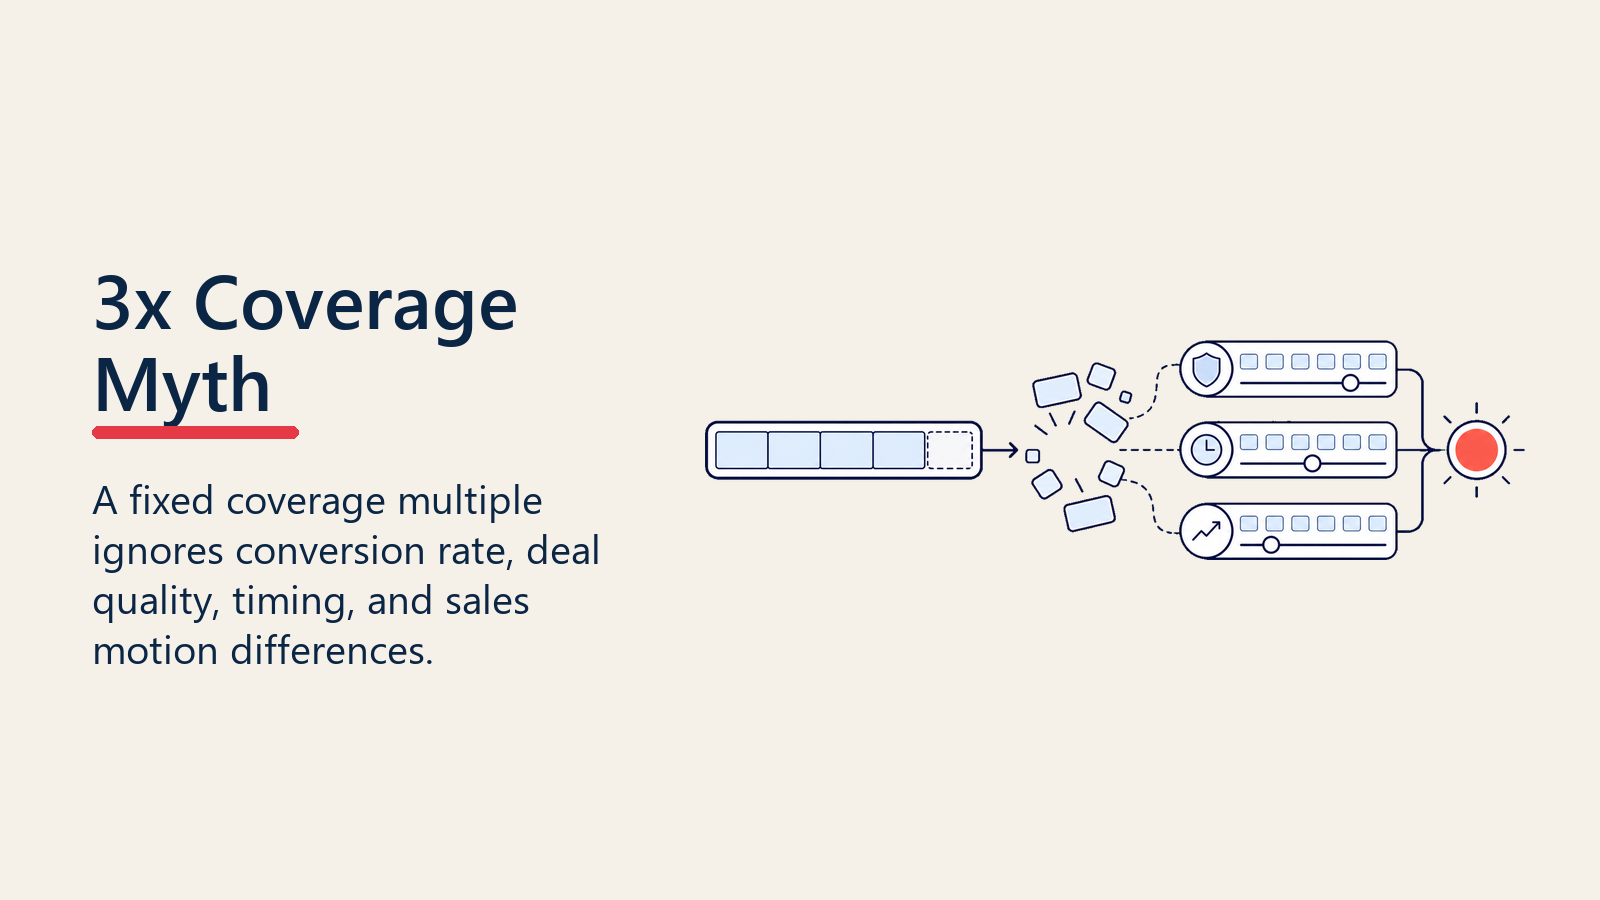
"We need 3x pipeline coverage to hit quota."
If you've heard this in a sales meeting, you've witnessed the most overused, and often wrong, benchmark in B2B sales.
Here's the uncomfortable truth: the 3x rule is a relic from the 1990s enterprise software world. It worked for Oracle and SAP when they sold six-figure deals with 20% win rates and 9-month sales cycles. It probably doesn't work for your business.
As a revenue leader trying to build predictable forecasts, you need to understand pipeline coverage analysis. Not the generic benchmarks from some consulting slide deck. The actual math that determines whether your team has enough pipeline to hit their number, or whether you're heading for a shortfall three months from now.
What is Pipeline Coverage Analysis?
Pipeline coverage analysis measures the ratio of qualified pipeline value to quota or revenue target for a specific time period. It answers a deceptively simple question: "Do we have enough pipeline to hit our goals?"
The basic formula looks straightforward:
Pipeline Coverage Ratio = Total Pipeline Value / Quota or Target
If your rep has $500K in pipeline and $250K in quarterly quota, they have 2x coverage. Simple, right?
Not quite. This simple formula masks the nuances that determine whether your coverage ratio actually predicts success or gives you false confidence before missing the quarter.
Real pipeline coverage analysis accounts for:
- Win rate variation across deal stages, sizes, and sources
- Time alignment between when deals close and when you need revenue
- Deal quality beyond simple stage probability
- Historical conversion patterns specific to your business
Without these layers, coverage ratios become vanity metrics, numbers that look good in QBRs but don't prevent revenue misses.
Why 3x Pipeline Coverage Became the Standard (And Why It's Wrong)
The 3x coverage benchmark emerged from early enterprise software sales models with specific characteristics:
- Long sales cycles (6-12 months)
- Large deal sizes ($100K-$1M+)
- Low win rates (15-25%)
- Complex buying committees
- Lengthy procurement processes
In that context, 3x coverage made mathematical sense. With a 25% win rate, you need 4x pipeline to guarantee hitting quota. But accounting for deals that slip to next quarter, 3x became the practical target.
The problem? Most companies today don't operate like 1990s Oracle.
Your business probably has:
- Shorter sales cycles (30-90 days for mid-market, 7-30 days for SMB)
- Varied deal sizes with different conversion profiles
- Multiple sales motions (inbound, outbound, channel, expansion)
- Product-led or demo-driven qualification
- Digital-first buying processes
Applying a generic 3x rule to modern sales environments leads to two failure modes:
Over-coverage anxiety: Your SMB team with 60% win rates and 30-day cycles doesn't need 3x coverage. They need 1.7-2x. Demanding 3x creates artificial urgency that wastes energy chasing unnecessary pipeline instead of closing deals.
Under-coverage complacency: Your enterprise team with 15% win rates and 180-day cycles needs 5-6x coverage, not 3x. Accepting 3x as "good enough" guarantees you'll miss quota and discover it too late to fix.
The right coverage ratio isn't a benchmark, it's a calculation based on your actual conversion data.
Coverage Calculation Methods
Coverage methods translate available pipeline into quota confidence using stage, timing, probability, and segment assumptions.
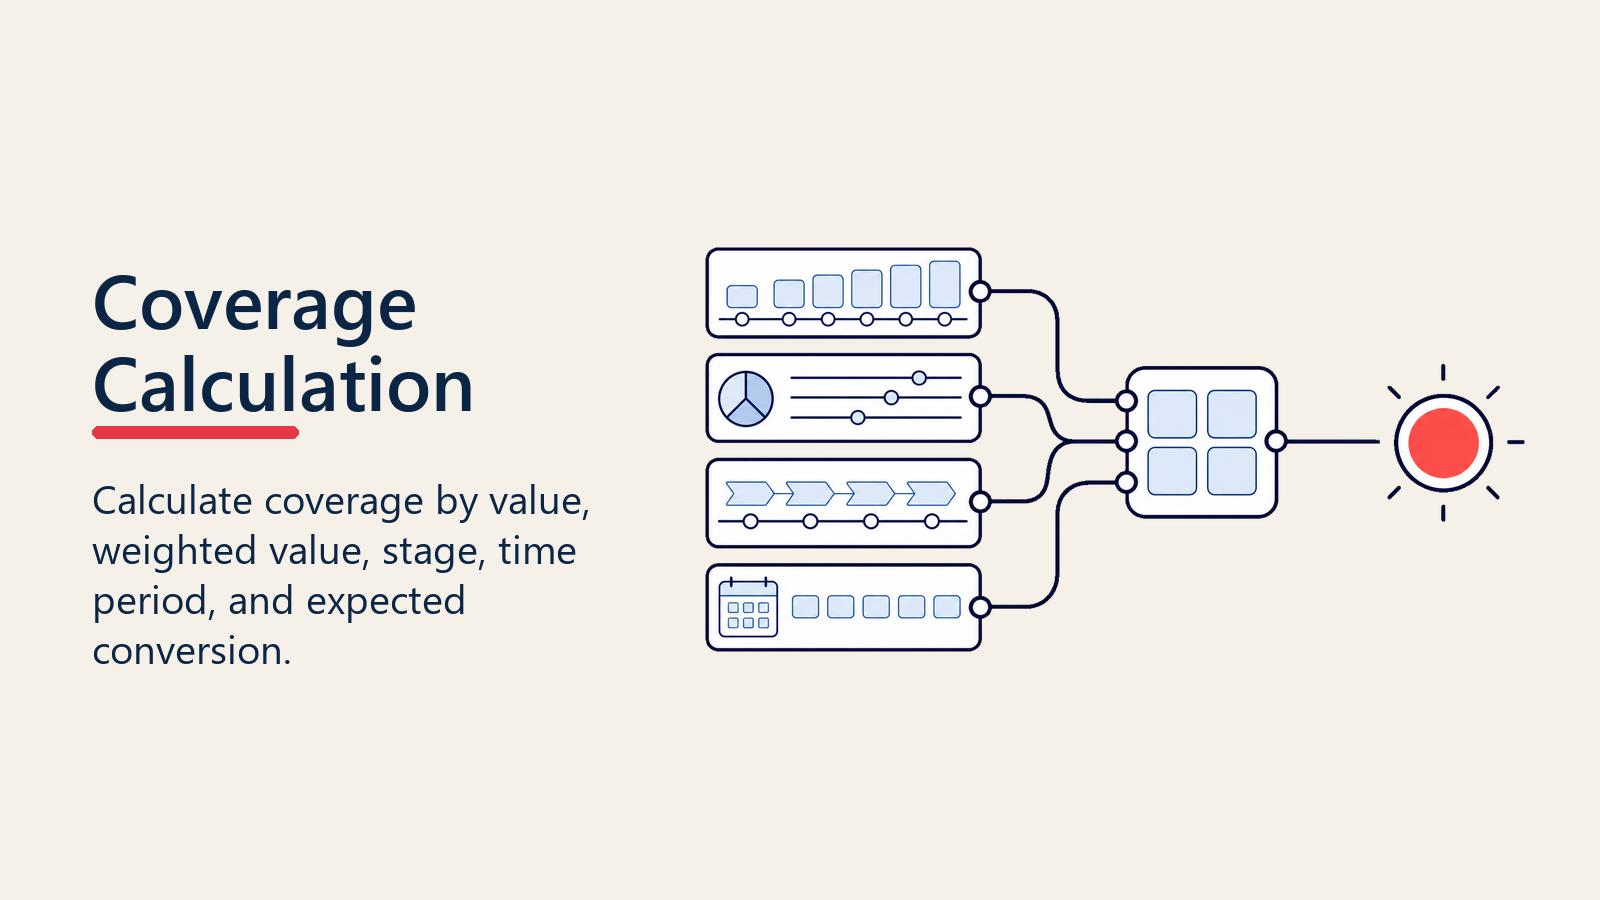
Different coverage calculations serve different purposes. Knowing when to use each reveals different dimensions of pipeline health.
Simple Coverage (Total Pipeline / Quota)
This is the starting point: total value of all open opportunities divided by quota.
Formula: Simple Coverage = Sum of All Open Opps / Quota
Example:
- Rep has $600K in total pipeline
- Quarterly quota is $200K
- Simple coverage = 3x
When to use it: Quick snapshot of overall pipeline volume. Good for high-level reviews and trending over time.
Limitations: Treats all pipeline equally regardless of stage, age, or likelihood. A 10% probability early-stage deal counts the same as a 90% verbal commit.
Weighted Coverage (Weighted Pipeline / Quota)
Weighted coverage applies stage-based probability percentages to adjust pipeline value based on deal maturity.
Formula: Weighted Coverage = (Sum of Opps × Stage %) / Quota
Example:
- $200K at Discovery (20% probability) = $40K weighted
- $300K at Proposal (50% probability) = $150K weighted
- $100K at Negotiation (75% probability) = $75K weighted
- Total weighted: $265K
- Quota: $200K
- Weighted coverage = 1.3x
When to use it: More realistic view of pipeline quality. Better for forecast accuracy and identifying real gaps.
Limitations: Assumes all deals at a given stage have the same win probability, which isn't true. A 30-day-old deal at Proposal isn't the same as a 120-day-old deal at the same stage.
Stage-Specific Coverage
Breaking coverage down by pipeline stage reveals whether you have balanced pipeline or concentration risk.
Formula: Stage Coverage = (Pipeline at Stage × Stage %) / (Quota × Required Weighted Contribution)
Example:
- Need $50K weighted from early-stage deals to maintain pipeline flow
- Have $200K at Discovery (20% probability) = $40K weighted
- Early-stage coverage = 0.8x (below target)
When to use it: Diagnosing pipeline generation problems. If late-stage coverage looks good but early-stage is weak, you'll have a gap next quarter.
Limitations: Requires understanding how much pipeline you need at each stage, which varies by sales cycle length.
Time-Period Coverage
Segmenting coverage by expected close date reveals timing misalignment between pipeline and quota.
Formula: Period Coverage = Pipeline Closing in Period / Quota for Period
Example (Month-by-month for Q2):
- April pipeline: $180K / $67K quota = 2.7x
- May pipeline: $140K / $67K quota = 2.1x
- June pipeline: $90K / $66K quota = 1.4x
- Q2 total: $410K / $200K = 2.05x
When to use it: Identifying specific weeks or months where coverage is weak. Critical for quarterly businesses that need even revenue distribution.
Limitations: Relies on accurate close date forecasting, which is notoriously unreliable, especially for deals more than 60 days out.
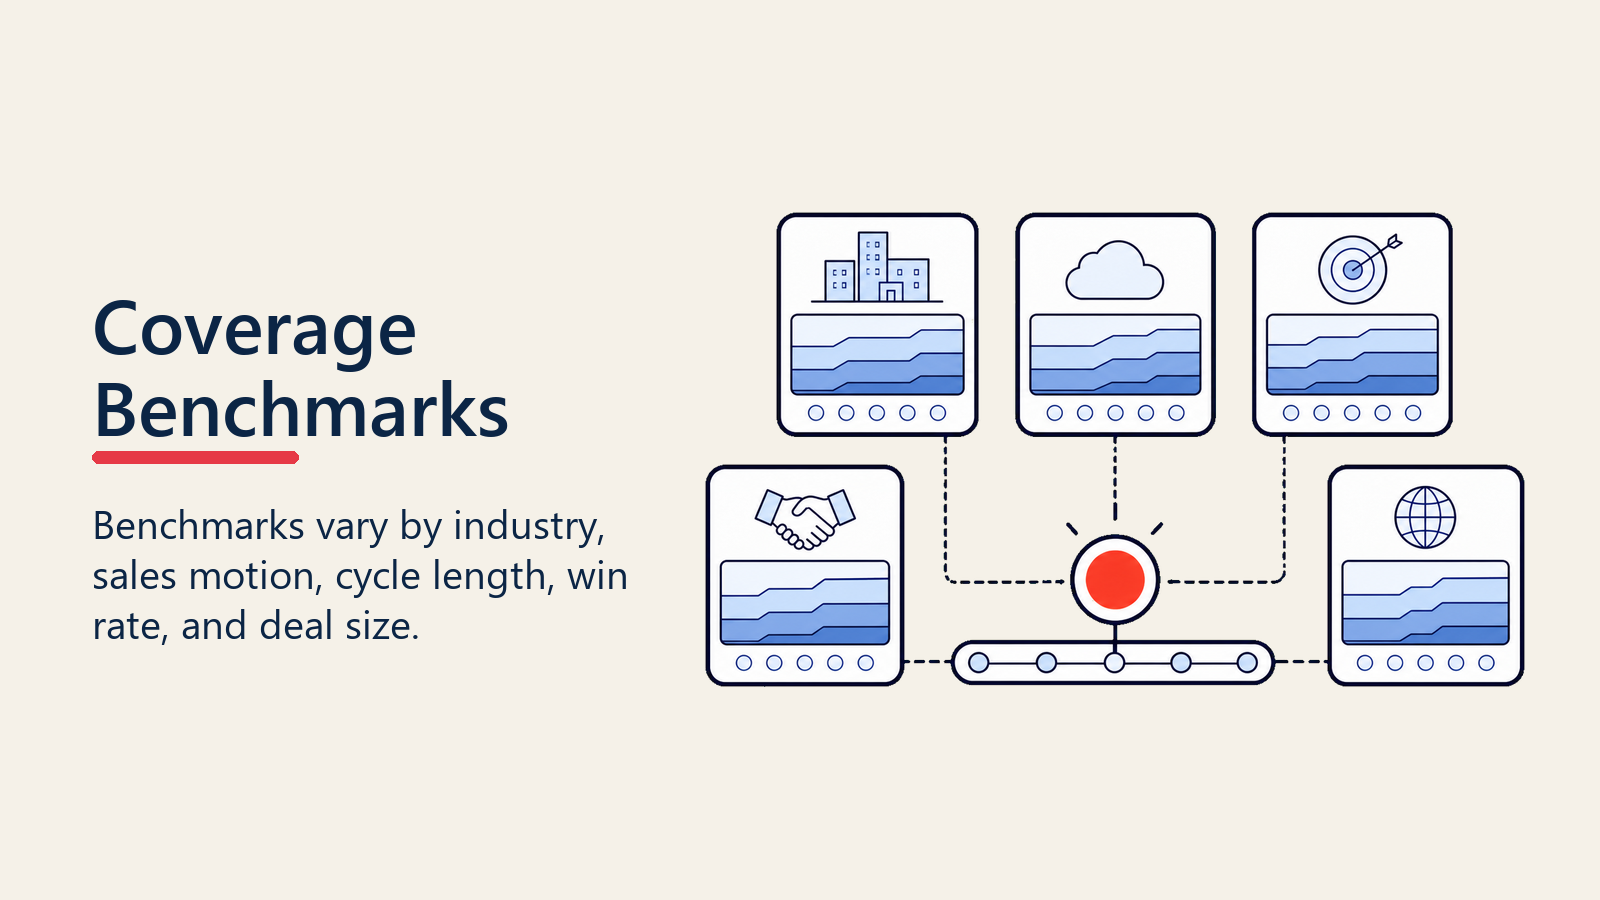
Coverage Benchmarks by Industry and Sales Motion
While generic benchmarks are dangerous, ranges based on sales motion and win rate provide useful reference points.
| Sales Motion | Typical Win Rate | Sales Cycle | Recommended Coverage |
|---|---|---|---|
| Enterprise | 15-25% | 6-12 months | 4-6x |
| Mid-Market | 25-35% | 3-6 months | 3-4x |
| SMB Outbound | 35-45% | 1-3 months | 2.5-3x |
| SMB Inbound | 45-60% | 1-4 weeks | 1.7-2.5x |
| Expansion/Upsell | 50-70% | 2-8 weeks | 1.5-2x |
| Channel/Partner | 20-30% | 3-6 months | 3.5-4.5x |
Key insight: Transactional motions with high win rates need far less coverage than complex enterprise sales with committee-based decisions.
Why Your Coverage Ratio Should Be Custom
These benchmarks are starting points, not rules. Your required coverage depends on factors specific to your business:
Historical win rates by stage: If your "Proposal" stage converts at 65% instead of the generic 50%, you need less coverage than the benchmark suggests.
Stage-to-stage conversion velocity: If 80% of your Discovery deals advance to next stage (versus industry average of 40%), your early-stage pipeline is higher quality than assumed. Understanding your conversion rate analysis is essential here.
Deal size variance: If your deals range from $10K to $500K, aggregate coverage ratios obscure risk. One lost $500K deal can't be replaced by ten $10K deals if you don't have enough large opportunities.
Seasonal patterns: If Q4 has historically higher win rates due to budget flush, you might operate with lower coverage in Q4 than Q2.
The right approach: Calculate your required coverage based on your trailing 12-month data, not industry benchmarks.
Required Coverage Formula:
Required Coverage = 1 / (Overall Win Rate × Pipeline to Close Rate)
Example calculation:
- Overall win rate: 30%
- Pipeline to close rate: 75% (percentage of pipeline that actually closes in the planned quarter)
- Required coverage = 1 / (0.30 × 0.75) = 4.4x
This formula accounts for both deal loss and timing slippage, giving you a reality-based coverage target.
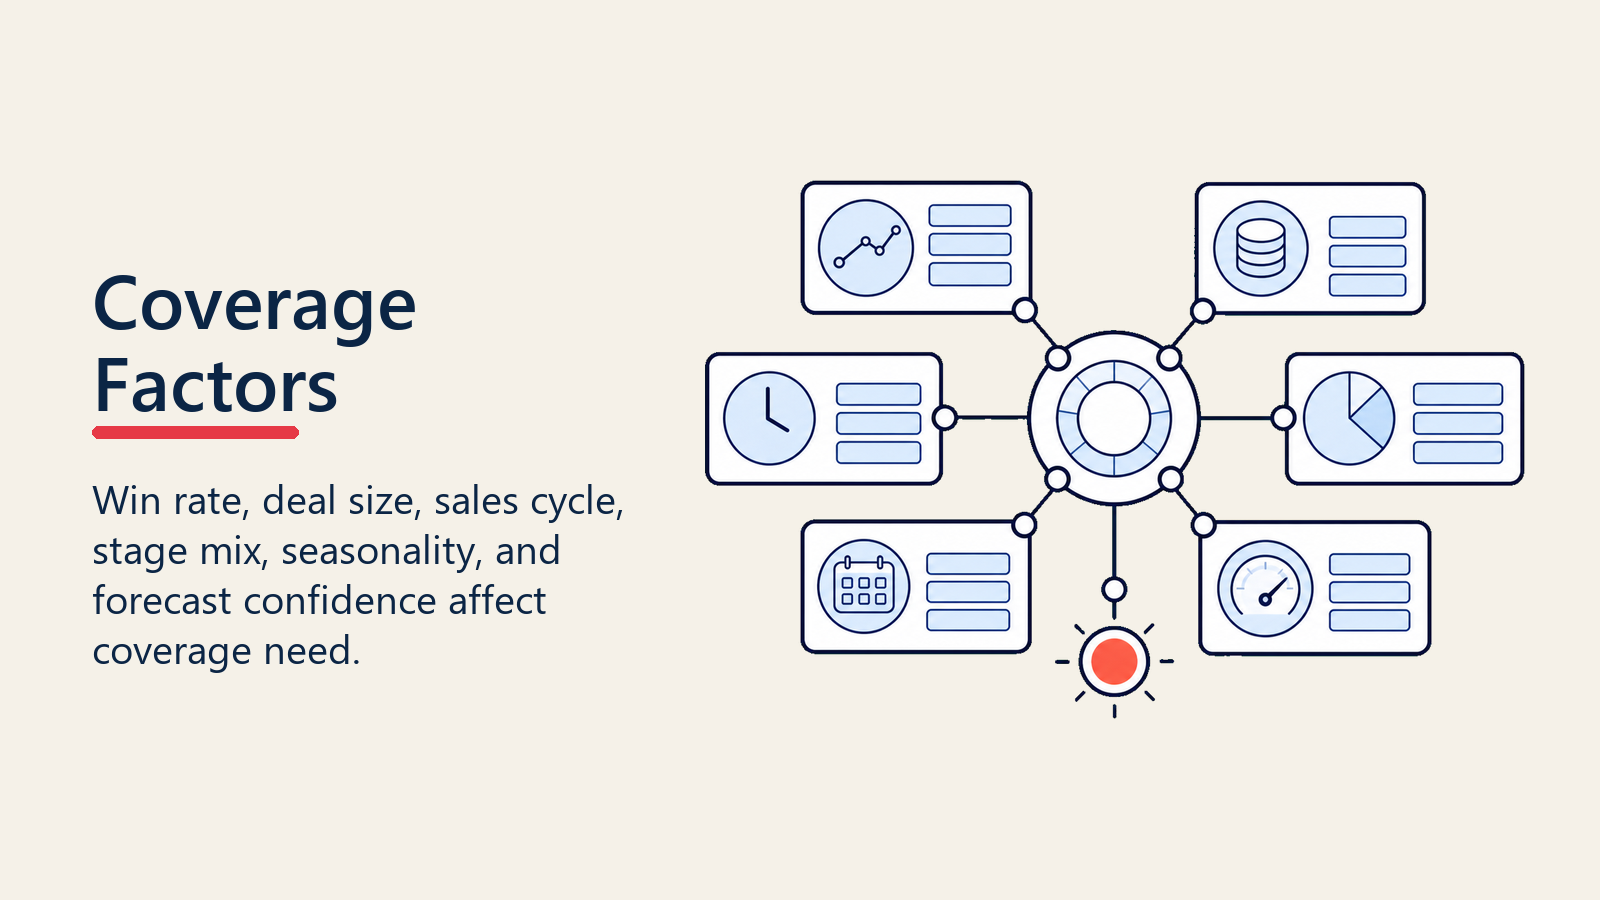
Factors Affecting Required Coverage
Several variables increase or decrease the coverage you need to hit quota with confidence.
Win Rate by Source
Not all pipeline converts equally. Breaking win rates by lead source reveals which channels produce high-quality pipeline versus volume.
Example win rate analysis:
- Inbound demo requests: 45% win rate
- Outbound cold outreach: 18% win rate
- Partner referrals: 52% win rate
- Event leads: 28% win rate
If your pipeline is weighted toward outbound, you need higher coverage than if it's partner-heavy. A rep with $300K pipeline that's 70% outbound needs more backup than a rep with $300K that's 60% inbound.
Implication for coverage: Weight your pipeline by source-specific win rates for more accurate coverage assessment.
Sales Cycle Length and Variance
Longer sales cycles require higher coverage because more can go wrong. A 180-day enterprise deal has more opportunities for budget changes, competitive displacement, champion turnover, and priority shifts than a 30-day transactional sale.
Coverage adjustment by cycle length:
- Under 30 days: Base coverage (e.g. 2x)
- 30-90 days: Base + 0.5x
- 90-180 days: Base + 1x
- 180+ days: Base + 1.5x
Deal Size Distribution
Large deal concentration creates coverage risk. If three deals represent 60% of your pipeline, losing one is catastrophic. You need more backup deals than if pipeline is evenly distributed.
Risk assessment:
- Low concentration: No single deal exceeds 15% of quota → standard coverage
- Medium concentration: 1-2 deals exceed 20% of quota → add 0.5x coverage
- High concentration: 3+ deals exceed 25% of quota → add 1x coverage
Stage Distribution and Aging
Pipeline concentrated in early stages requires higher coverage because more deals will drop out before close. Pipeline concentrated in late stages might indicate insufficient generation for future periods.
Healthy distribution (for a 90-day cycle):
- Discovery (0-30 days old): 40-50% of total pipeline
- Qualification (15-45 days old): 25-30% of total pipeline
- Proposal (30-60 days old): 15-20% of total pipeline
- Negotiation (45-90 days old): 10-15% of total pipeline
Pipeline aging also affects coverage. A deal that's been at "Proposal" for 90 days when your average cycle is 60 days has lower conversion probability than a fresh proposal. Aged pipeline should be discounted or removed from coverage calculations. Effective deal aging management helps maintain accurate coverage ratios.
Coverage Gap Analysis: Identifying Shortfalls Early
Gap analysis compares current coverage to required coverage, then projects forward to identify future shortfalls.
Current Quarter Gap Analysis
Step 1: Calculate Current State
- Current weighted pipeline: $450K
- Closed-won to date: $120K
- Remaining quota: $280K
- Current coverage: $450K / $280K = 1.6x
- Required coverage (based on historical data): 3.2x
- Gap: 1.6x shortage
Step 2: Quantify the Gap in Dollars
- Needed pipeline: $280K × 3.2x = $896K
- Current pipeline: $450K
- Dollar gap: $446K
Step 3: Determine Source of Gap
- Pipeline created this quarter: $380K
- Pipeline generated per week: $38K
- Weeks remaining: 8
- Projected new pipeline: $304K
- Projected end-of-quarter pipeline: $754K (still $142K short)
This analysis reveals whether you can close the gap through pipeline generation alone or need to accelerate existing deals.
Future Quarter Gap Analysis
Projecting coverage for next quarter identifies pipeline generation problems before they become quota attainment problems.
Forward-looking coverage calculation:
- Next quarter quota: $300K
- Current pipeline with next-quarter close dates: $280K
- Historical pipeline generation in-quarter: $420K
- Expected total pipeline: $700K
- Required coverage: 3.2x = $960K needed
- Projected gap: $260K (27% short)
This early warning system gives you 90 days to increase pipeline generation activities before the gap becomes a miss.
Coverage by Time Period: Quarterly vs Annual Analysis
Different time horizons serve different planning purposes.
Current Quarter Coverage
Purpose: Execution focus. Can we hit this quarter's number with existing pipeline and in-quarter generation?
Analysis approach:
- Segment by month or week
- Focus on weighted pipeline
- Assume minimal new pipeline from net-new sources (conservative)
- Account for historical slip rates
Action orientation: Deal acceleration, close plan execution, prioritization.
Next Quarter Coverage
Purpose: Pipeline generation urgency. Do we have enough early-stage pipeline building for next quarter?
Analysis approach:
- Look at Discovery and Qualification stage deals
- Assume historical stage progression rates
- Project in-quarter pipeline generation
- Identify source-specific gaps
Action orientation: Marketing program adjustments, SDR capacity, campaign launches. Strong opportunity qualification processes ensure early-stage pipeline quality.
Annual Coverage
Purpose: Strategic capacity planning. Do we have enough overall pipeline generation capacity to hit annual targets?
Analysis approach:
- Total annual quota remaining
- Sum of all pipeline regardless of expected close quarter
- Annual pipeline generation rate trending
- Comparison to annual required generation
Action orientation: Headcount planning, ICP refinement, channel strategy, pricing changes.
Rolling 6-Month Coverage
Purpose: Balanced view combining near-term execution with medium-term generation.
Analysis approach:
- Combined pipeline for current + next quarter
- Blended coverage requirements
- Smooth out quarterly volatility
Action orientation: Balanced focus on closing current deals while generating future pipeline.
Team vs Individual Coverage: Aggregate vs Rep-Level Analysis
Team-level coverage can mask individual rep risks. A team at 3.5x coverage might have three reps at 5x and two at 1.2x.
Team Coverage Analysis
When it's useful:
- Assessing overall organizational health
- Justifying marketing investment
- Board-level reporting
- Cross-team comparisons (East vs West region)
Limitations:
- Obscures individual performance issues
- Can hide systematic problems (e.g. all new reps struggling)
- Doesn't account for quota distribution fairness
Individual Rep Coverage Analysis
When it's critical:
- Performance management and pipeline coaching
- Identifying reps who need pipeline support vs deal closure help
- Capacity planning (can this rep handle more quota?)
- Forecasting accuracy (reps with consistent coverage hit more reliably)
Coverage-based rep segmentation:
- Over-covered (>4x): May be sandbagging or over-generating
- Well-covered (2.5-4x): Healthy pipeline, focus on closure
- Under-covered (1.5-2.5x): Need pipeline generation support
- At-risk (<1.5x): Immediate intervention required
Segment Analysis
Coverage should also be analyzed by segment to identify systemic issues:
By territory: Are certain regions consistently under-covered? By vertical: Do some industries have lower pipeline generation? By rep tenure: Are new reps struggling to build pipeline? By AE type: Do hunters vs farmers have different coverage profiles?
Segmented analysis reveals whether coverage problems are individual coaching opportunities or systemic issues requiring operational changes.
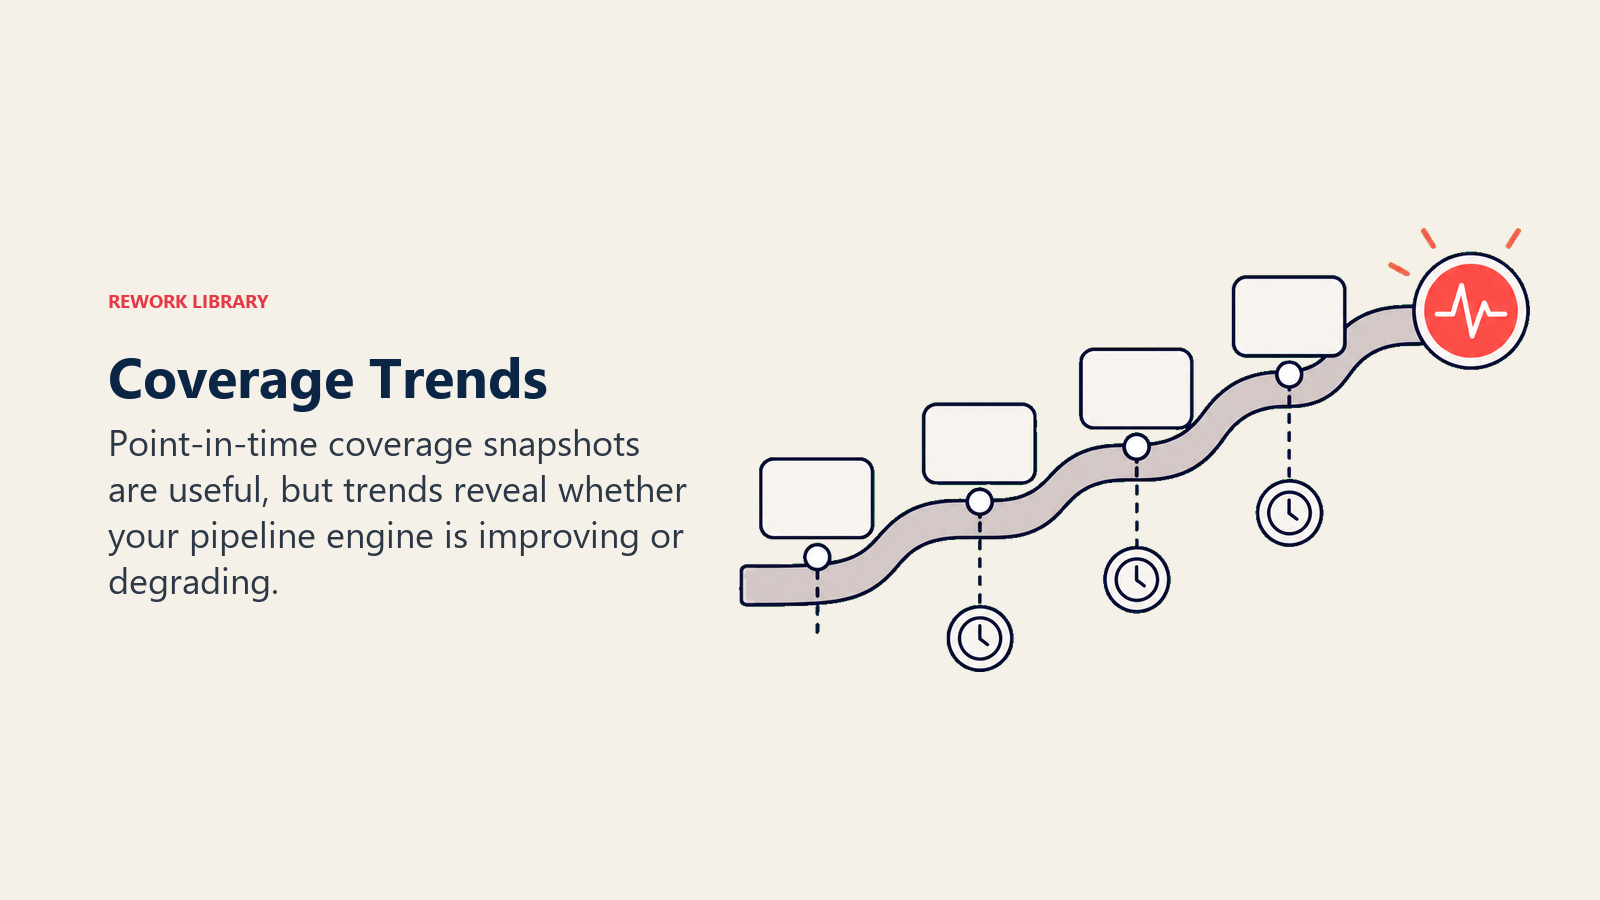
Coverage Trends: Tracking Over Time
Point-in-time coverage snapshots are useful, but trends reveal whether your pipeline engine is improving or degrading.
Week-over-Week Coverage Trending
Metric: Change in weighted coverage ratio over rolling 4-week periods
What it shows:
- Pipeline generation momentum
- Impact of marketing campaigns
- Seasonal patterns
- Early warning of pipeline degradation
Example trend analysis:
- Week 1: 2.8x
- Week 2: 2.9x
- Week 3: 2.7x
- Week 4: 2.5x
- Trend: Declining 0.3x over month → investigate pipeline generation
Quarter-over-Quarter Coverage Patterns
Analysis: Compare coverage at start of quarter vs end of quarter across multiple quarters
Patterns to identify:
- Consistent start-of-quarter gaps (pipeline generation issue)
- End-of-quarter spikes (deals pushed from previous quarter)
- Gradual decline (win rates dropping or qualification loosening)
- Volatile swings (inconsistent pipeline generation)
Healthy pattern: Relatively stable coverage throughout quarter with gradual increase as in-quarter generation adds to pipeline.
Coverage vs Attainment Correlation
Analysis: Plot historical coverage ratios against actual quota attainment
Insight: Determine your "magic number" coverage ratio that predicts >90% quota attainment
Example finding: "When reps start quarter with 3.2x+ weighted coverage, they hit quota 89% of the time. Below 2.8x, quota attainment drops to 52%."
This historical analysis turns coverage from a best practice into a data-driven predictor of success.
Seasonal Coverage Adjustments
Many businesses have seasonal patterns that affect required coverage:
Budget cycles: Q4 in many B2B businesses has higher close rates (budget flush) Industry seasonals: Retail peaks in Q3/Q4, education in Q1/Q2 Holiday impacts: November-December typically see slower pipeline generation Fiscal year dynamics: Urgency increases in final quarter of customer fiscal years
Adjustment approach: Calculate required coverage by quarter based on historical win rates and cycle times for that quarter, not annual averages.
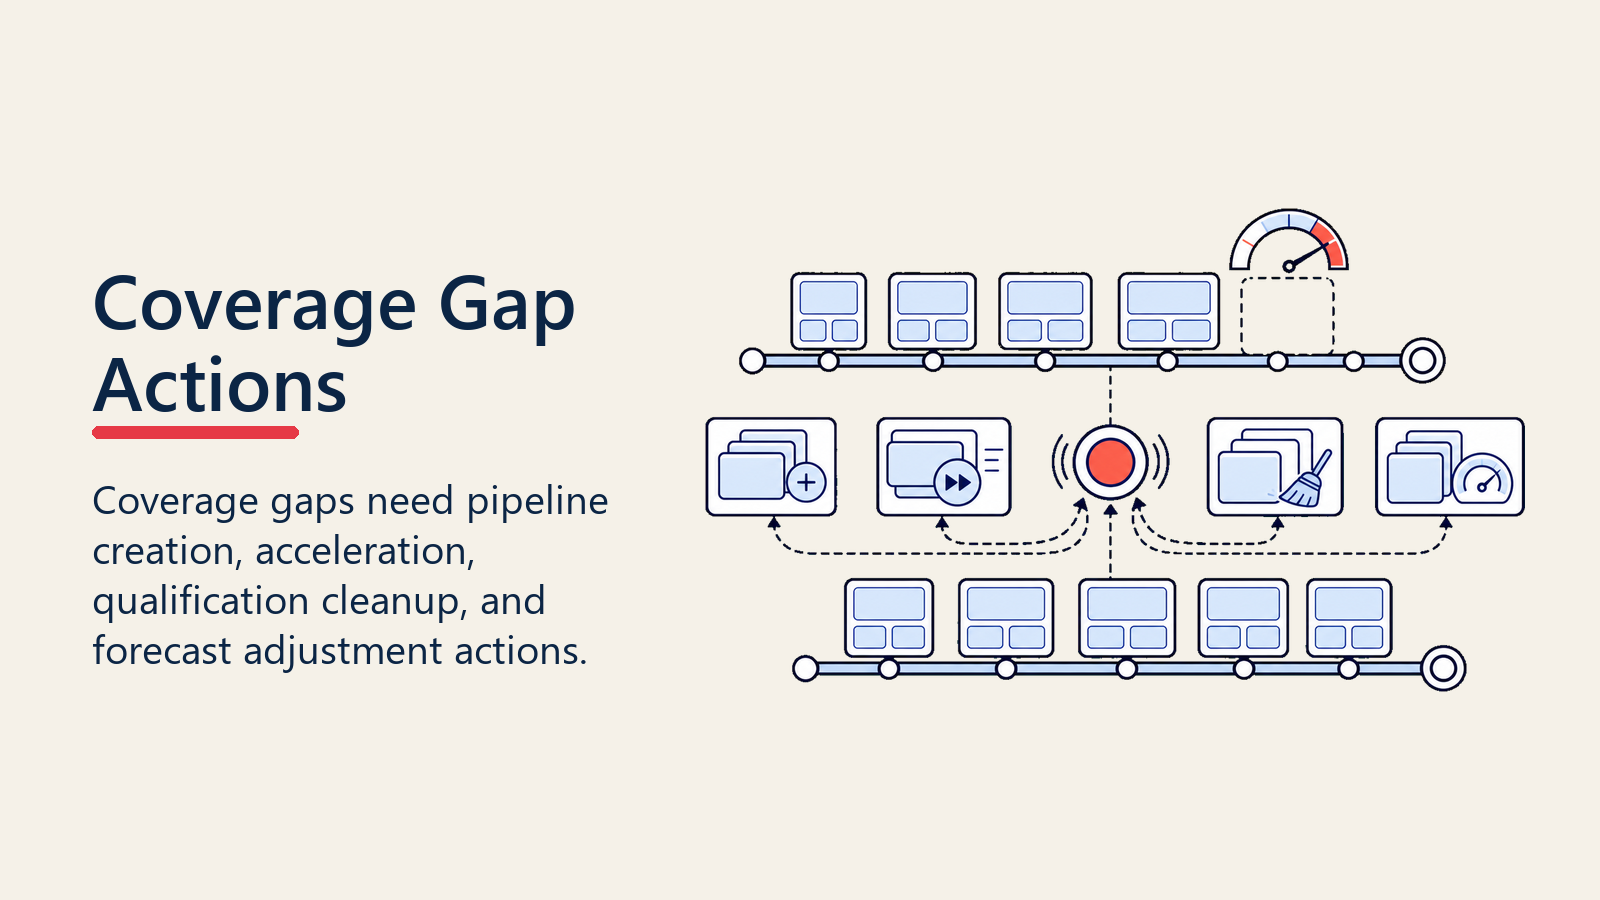
Action Plans for Coverage Gaps
Identifying a coverage gap is step one. Fixing it requires different tactics depending on the gap's nature and timing.
When You're Short on Current Quarter Coverage
Timeline: 0-90 days to close date
Acceleration tactics:
- Deal review and prioritization: Focus on highest-probability opportunities through rigorous pipeline reviews
- Executive engagement: Bring in leadership to unstick deals
- Discount authority: Accelerate decisions with pricing flexibility
- Multi-threading: Expand stakeholder engagement in active deals
- Competitive displacement: Target competitor customers with faster implementation
Pipeline generation tactics (limited impact in <90 days): 6. Inbound conversion: Increase SDR outreach to warm leads 7. Fast-cycle sources: Partner referrals, expansion deals, product-qualified leads
What NOT to do: Panic-create low-quality pipeline that clogs your funnel next quarter.
When You're Short on Next Quarter Coverage
Timeline: 90-180 days out
Pipeline generation tactics:
- Marketing campaign acceleration: Launch demand gen programs now
- SDR capacity increase: Temporary contractors or reallocation
- ICP expansion: Carefully test adjacent segments
- Channel activation: Accelerate partner pipeline building
- Event participation: Industry conferences for concentrated prospecting
Pipeline quality tactics: 6. Qualification tightening: Better early-stage qualification saves late-stage effort. Consider frameworks like MEDDIC for complex deals 7. Source analysis: Double down on highest-converting channels 8. ABM intensification: Targeted account-based plays for strategic accounts
When You're Short on Annual Coverage
Timeline: 180+ days out
Strategic interventions:
- Headcount adjustments: Add sales capacity (6-month ramp consideration)
- Marketing budget reallocation: Shift spend to highest-ROI channels
- Product strategy: Launch new features/products to expand TAM
- Pricing strategy: Adjust pricing to improve close rates or deal sizes
- Go-to-market changes: New segments, channels, or partnerships
- Sales process redesign: Improve pipeline velocity and win rate to need less coverage
These are not quarter-to-quarter tactics, they're strategic corrections to systematic pipeline problems.
Coverage Contingency Planning
Build scenario plans based on coverage levels:
Scenario A (>4x coverage): Maintain current programs, focus on deal quality Scenario B (3-4x coverage): Healthy state, continue balanced approach Scenario C (2-3x coverage): Increase pipeline generation investment by 25% Scenario D (<2x coverage): Emergency protocols, executive intervention
Having pre-defined responses to coverage levels removes emotion from pipeline decisions and creates accountability.
Conclusion: Coverage Analysis as Operational Discipline
Pipeline coverage analysis isn't about hitting an arbitrary benchmark. It's about understanding the mathematical relationship between your pipeline volume, quality, and conversion rates, then using that understanding to predict revenue and identify gaps while there's still time to fix them.
The companies that do this well share common practices:
They calculate custom coverage ratios based on their historical data, not industry benchmarks.
They segment coverage analysis by rep, region, source, and time period to identify specific problems.
They trend coverage over time to spot degradation early and validate improvement initiatives.
They tie coverage to attainment through historical analysis to set predictive thresholds.
They build action plans triggered by coverage levels, removing subjective interpretation.
Most importantly, they treat coverage analysis as an ongoing operational discipline, not a quarterly fire drill. Weekly coverage reviews with segment-level visibility create accountability and enable proactive pipeline management instead of reactive scrambling.
The alternative? Discover in week 10 of the quarter that you're going to miss, with no time to generate the pipeline you should have built two months ago.
Coverage analysis is the early warning system that separates predictable revenue organizations from those that hope their way to the number.
Ready to build a predictable pipeline engine? Learn how pipeline metrics overview and weighted pipeline analysis create visibility into your revenue engine.
Learn More

Senior Operations & Growth Strategist
On this page
- What is Pipeline Coverage Analysis?
- Why 3x Pipeline Coverage Became the Standard (And Why It's Wrong)
- Coverage Calculation Methods
- Simple Coverage (Total Pipeline / Quota)
- Weighted Coverage (Weighted Pipeline / Quota)
- Stage-Specific Coverage
- Time-Period Coverage
- Coverage Benchmarks by Industry and Sales Motion
- Why Your Coverage Ratio Should Be Custom
- Factors Affecting Required Coverage
- Win Rate by Source
- Sales Cycle Length and Variance
- Deal Size Distribution
- Stage Distribution and Aging
- Coverage Gap Analysis: Identifying Shortfalls Early
- Current Quarter Gap Analysis
- Future Quarter Gap Analysis
- Coverage by Time Period: Quarterly vs Annual Analysis
- Current Quarter Coverage
- Next Quarter Coverage
- Annual Coverage
- Rolling 6-Month Coverage
- Team vs Individual Coverage: Aggregate vs Rep-Level Analysis
- Team Coverage Analysis
- Individual Rep Coverage Analysis
- Segment Analysis
- Coverage Trends: Tracking Over Time
- Week-over-Week Coverage Trending
- Quarter-over-Quarter Coverage Patterns
- Coverage vs Attainment Correlation
- Seasonal Coverage Adjustments
- Action Plans for Coverage Gaps
- When You're Short on Current Quarter Coverage
- When You're Short on Next Quarter Coverage
- When You're Short on Annual Coverage
- Coverage Contingency Planning
- Conclusion: Coverage Analysis as Operational Discipline
- Learn More