Route-to-Market Models: Choosing the Right Go-to-Market Architecture for FMCG Growth
Turn this article into takeaways for your work.


Each assistant summarizes the article only for you and suggests best practices for your work.
A regional sales director once described his distribution problem this way: "We have reps driving two hours to visit a kiosk that orders four cases a month and we have 800 general trade outlets in the city center that we've never even registered." That's a route-to-market problem, not a headcount problem. Adding more reps wouldn't have fixed it. Redesigning the architecture would.
Route-to-market (RTM) is the system that connects a manufacturer's product to the point of sale. It determines which outlets you reach, at what frequency, at what cost, and through whose hands the product travels. Get it right and your field force compounds its coverage over time. Get it wrong and you're paying premium direct-delivery costs to reach sub-economic outlets while the outlets that drive category volume are being filled by a competitor's van sales team.
Most FMCG commercial directors inherit a route-to-market that was designed for a different market size, a different product mix, or a different competitive environment. The question isn't whether to have an RTM. It's whether the one you have is right for where the business is today.
The Six RTM Models
Key Facts
- Traditional general trade still accounts for 45% or more of FMCG sales across Asia Pacific and over 65% in Latin America, according to NielsenIQ's tracking of FMCG retail channel trends. That channel composition directly determines which RTM model is economically appropriate for each geography.
- Bain's research on emerging-market consumer goods shows that general-trade channel partners service the small retailers making up the majority of FMCG sales in developing economies, making distributor-led indirect the dominant model by volume in most non-urban territories.
- DSD economics typically require 25 to 40 outlet stops per vehicle per day to be cost-competitive with distributor-led indirect. Below that density threshold, direct delivery costs run two to five times higher per drop, as a rough planning benchmark for RTM boundary decisions.
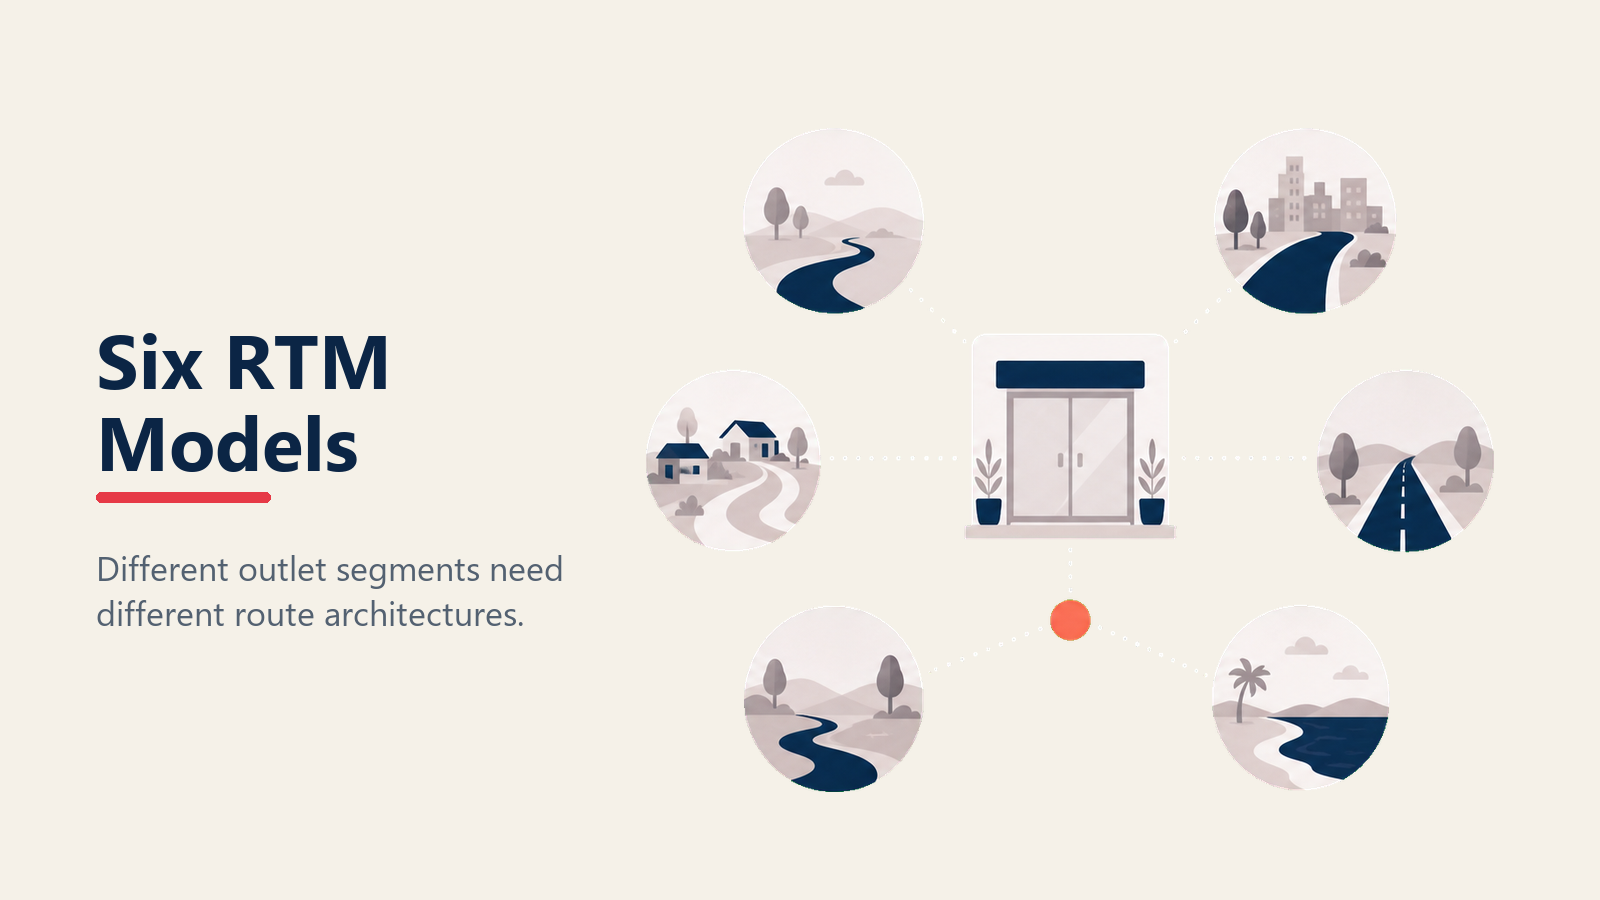
There's no single model that works for all channels, geographies, or volume tiers. Here's how the six main architectures work and where each one fits.
Direct Store Delivery (DSD)
The manufacturer's own fleet delivers product directly from a warehouse or depot to the outlet. The company employs the drivers, owns or leases the vehicles, and controls the delivery schedule.
DSD gives you the highest control over availability, freshness, and outlet-level data. It's the preferred model for products where freshness is a commercial differentiator (bread, dairy, fresh juices) or where brand standards require direct compliance monitoring. But it's expensive. Total cost per drop, including vehicle depreciation, driver salary, fuel, and supervisory overhead, typically runs two to four times higher than distributor-led delivery in comparable markets.
DSD makes economic sense when outlet density is high enough that one vehicle can cover enough stops per day to bring cost per drop below the breakeven threshold. In a dense urban market where a driver can complete 30 to 40 stops per route, DSD is defensible. In rural territory where the same driver covers 10 stops over the same distance, it almost never is. NielsenIQ's tracking of FMCG retail channel shifts across regions shows that even as e-commerce grows, traditional store-based channels continue to dominate volume in most emerging markets, which reinforces the economic case for getting DSD territory boundaries right.
Distributor-Led Indirect
The manufacturer sells to a distributor (also called a stockist or secondary partner), who then sells to outlets using their own sales force, vehicles, and working capital. The manufacturer's field team manages the distributor relationship, drives pull-through activity, and monitors secondary sales data.
This is the dominant model in most FMCG emerging markets because it transfers cost-to-serve to a third party who has local knowledge, existing outlet relationships, and infrastructure already in place. General-trade channel partners of this kind service the small mom-and-pop retailers that make up the majority of sales in many emerging-market product categories, according to Bain's research on emerging-market consumer goods. The trade-off is visibility: the manufacturer sees primary sales (what they sold to the distributor) but must work harder for secondary sales data (what the distributor sold to outlets).
Distributor management and ROI is the discipline that makes this model work. A well-managed distributor with clear target coverage, secondary sales reporting, and joint business planning outperforms a direct model in most non-urban FMCG markets. A poorly managed distributor sitting on stock and under-covering territory is worse than no distribution at all.
Van Sales (Cash-and-Carry Mobile)
A van sales rep loads a vehicle with stock at the start of the day and sells directly from the van to outlets on a defined beat. Payment is collected on the spot (or on credit terms depending on the account). No pre-order is placed; the rep loads based on historical data and sells what's available.
Van sales is efficient in markets with fragmented general trade where outlets have low average order values, irregular ordering behavior, or limited access to formal credit. The rep is simultaneously the salesperson, the delivery driver, and the credit manager. In Southeast Asia and parts of Africa and the Middle East, van sales remains the dominant model for general trade coverage.
The weakness of van sales is load accuracy. If the rep loads too much of the wrong SKUs, they return with stock that ties up working capital. If they underload a fast-moving line, they lose the sale. Beat redesign, daily loading reports, and SFA-driven stock recommendations are the tools that improve load accuracy over time.
Pre-Sell with Third-Party Delivery
The rep visits the outlet, takes the order, and captures it in an SFA or mobile ordering system. A separate delivery vehicle (owned by the company, a distributor, or a third-party logistics provider) fulfills the order the next day or within an agreed delivery window.
Pre-sell separates the commercial activity (the rep's visit and relationship management) from the logistics (physical delivery). It allows the rep to focus on execution quality, outlet education, and commercial conversation rather than managing a vehicle and cash. It also allows a higher call-per-day rate since the rep isn't constrained by vehicle capacity.
The limitation is the lag between order and delivery, which doesn't suit outlets that need immediate replenishment. Pre-sell works best in organized general trade, mid-volume outlets, and markets where outlets plan their ordering in advance rather than buying hand-to-mouth.
Wholesale Push
The manufacturer sells large quantities to a wholesale trader who distributes to smaller outlets through their own network. The manufacturer has minimal field presence; they rely on the wholesaler's reach and the pull created by consumer demand and brand equity.
Wholesale push is the model of last resort for most branded FMCG companies because it sacrifices visibility, execution control, and outlet-level relationships entirely. It's appropriate for low-margin commodity products, markets where no other model is economically viable, or as a transitional model while a company builds direct distribution capability.
The risk is that wholesale amplifies price instability (wholesalers undercut each other to move volume), enables unauthorized trade into markets you're trying to manage through a different channel, and leaves you with no data on where your product is actually going.
eB2B (Digital Ordering)
Retail outlets order digitally through a manufacturer-operated or third-party platform. The rep's role shifts from order-taking to relationship management, outlet activation, and compliance monitoring. Orders are fulfilled through an existing logistics network.
eB2B is gaining adoption in urban markets in Southeast Asia (Warung Pintar, Mitra Tokopedia in Indonesia), South Asia (Bijak, Udaan in India), and parts of the Middle East. It compresses the order cycle, reduces rep administrative burden, and creates digital outlet-level purchase data that transforms commercial planning. But it requires outlet digitization, a consistent logistics backbone, and a shift in rep capability from transactional order-taking to consultative relationship management.
RTM Decision Matrix
The Cost-per-Drop Break-Even Framework: a structured comparison that evaluates each RTM model against two variables for a given outlet segment: total daily delivery cost divided by stops per day (cost per drop), versus the distributor margin on the same average order value (effective cost per outlet served through a third party). The model that produces a lower number for a given outlet segment is economically preferred, all else equal. Non-cost factors (data visibility, compliance control, outlet relationship) are then applied as qualitative adjustments to that baseline comparison.
No model is universally superior. The right choice depends on four factors for each outlet segment:
| Factor | DSD | Distributor-Led | Van Sales | Pre-Sell | Wholesale | eB2B |
|---|---|---|---|---|---|---|
| Outlet density | Very high | Medium-High | Medium | Medium-High | Any | High (urban) |
| Average order value | High | Medium | Low-Medium | Medium | High | Any |
| Freshness criticality | High | Low | Low-Medium | Low | Low | Low |
| Geographic spread | Urban | All | Urban-semi | Urban-semi | Rural | Urban |
| Data visibility need | High | Medium | Medium | High | Low | Very high |
| Cost to serve | Highest | Low-Medium | Medium | Medium | Lowest | Low (at scale) |
The decision matrix doesn't produce a single answer. It produces a portfolio decision: which model covers which outlet segment in which geography at the right cost. And most markets of any scale need more than one answer running simultaneously.
Do You Need a Hybrid RTM? Almost Certainly Yes
Almost every market of meaningful scale requires a portfolio of RTM models operating in parallel. The honest answer to "which RTM should we use?" is almost always "more than one, depending on the outlet segment." A beverage company in Vietnam might run DSD into modern trade, van sales in Ho Chi Minh City's urban general trade, distributor-led indirect into provincial towns, and a sub-stockist network for rural coverage. That's four models running simultaneously, each with different economics, different field force roles, and different data requirements.
The hybrid model isn't a compromise. It's the correct answer when outlet segments genuinely differ in volume concentration, geographic spread, and margin structure. The commercial director's job is to design the portfolio so each model covers the segments where it's economically justified, to define the boundaries clearly enough that the field team doesn't overlap or leave gaps, and to build the reporting infrastructure that gives visibility across all models. The next question is whether the economics actually support the model you're running in each segment.
The FMCG sales growth model provides the strategic context for these choices: RTM is the lever that determines which outlets you reach, which is the foundation of distribution depth.
Cost-to-Serve Analysis: Calculating Cost per Drop
RTM decisions without cost-to-serve data are guesses. The cost per drop calculation tells you whether a model is economically sustainable for a given outlet segment.
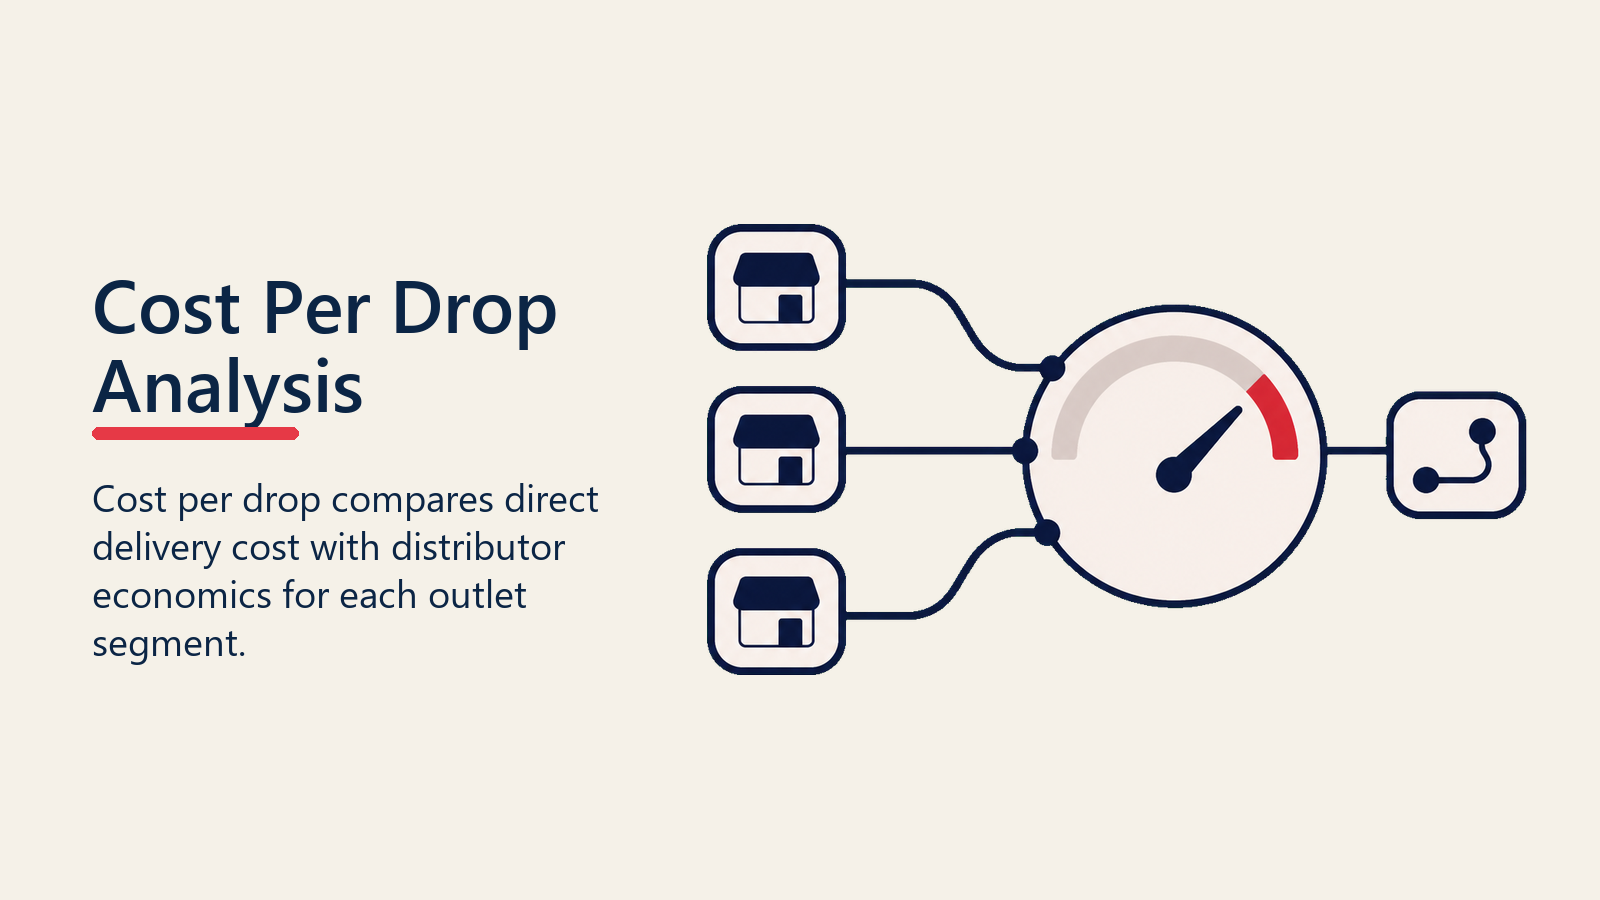
Cost per drop formula:
Cost per drop = (Direct delivery cost per day) / (Stops per day)
Where direct delivery cost includes vehicle depreciation or lease, fuel, driver or rep salary and allowances, and supervisor overhead allocation.
Example: Van sales vs distributor-led in urban general trade
Assume a van sales rep covers 25 stops per day in a dense urban beat.
| Cost element | Monthly amount |
|---|---|
| Rep salary and incentive | $800 |
| Vehicle lease and fuel | $600 |
| Phone and SFA tools | $50 |
| Supervisor overhead (1:8 span) | $150 |
| Total monthly cost | $1,600 |
If the rep works 22 days per month and covers 25 stops per day: 22 x 25 = 550 stops per month.
Cost per drop = $1,600 / 550 = $2.91 per drop
Now compare to distributor-led: the distributor margin is typically 5 to 8% of net selling price. If the average order value per outlet visit is $40, the effective cost per drop through the distributor is $2.00 to $3.20. At low order values, distributor-led is cheaper. As order values rise, the distributor margin becomes the more expensive option.
This calculation is the foundation of break-even analysis by outlet class: what minimum average order value justifies a direct visit vs channel delivery? For most FMCG categories in emerging markets, direct coverage becomes economically justified above $30 to $50 average order value per drop at current cost structures. Below that threshold, distributor-led or wholesale are more efficient.
The gap between a $2.91 direct cost per drop and a $2.00 to $3.20 effective distributor cost per outlet tells a story most commercial teams avoid looking at directly: in low-density and low-average-order-value markets, the distributor is structurally cheaper than direct, before accounting for the distributor's working capital and warehousing cost that the manufacturer doesn't pay at all. The only cases where direct is clearly cheaper are high-density urban routes, above the 25-stop threshold, serving outlets with average order values of $40 or more per visit. So as the business grows into new geographies, when does it make sense to change the model?
RTM Evolution Path
RTM architecture isn't set once. It evolves as the business grows, as market infrastructure improves, and as volume concentrations shift between channels.
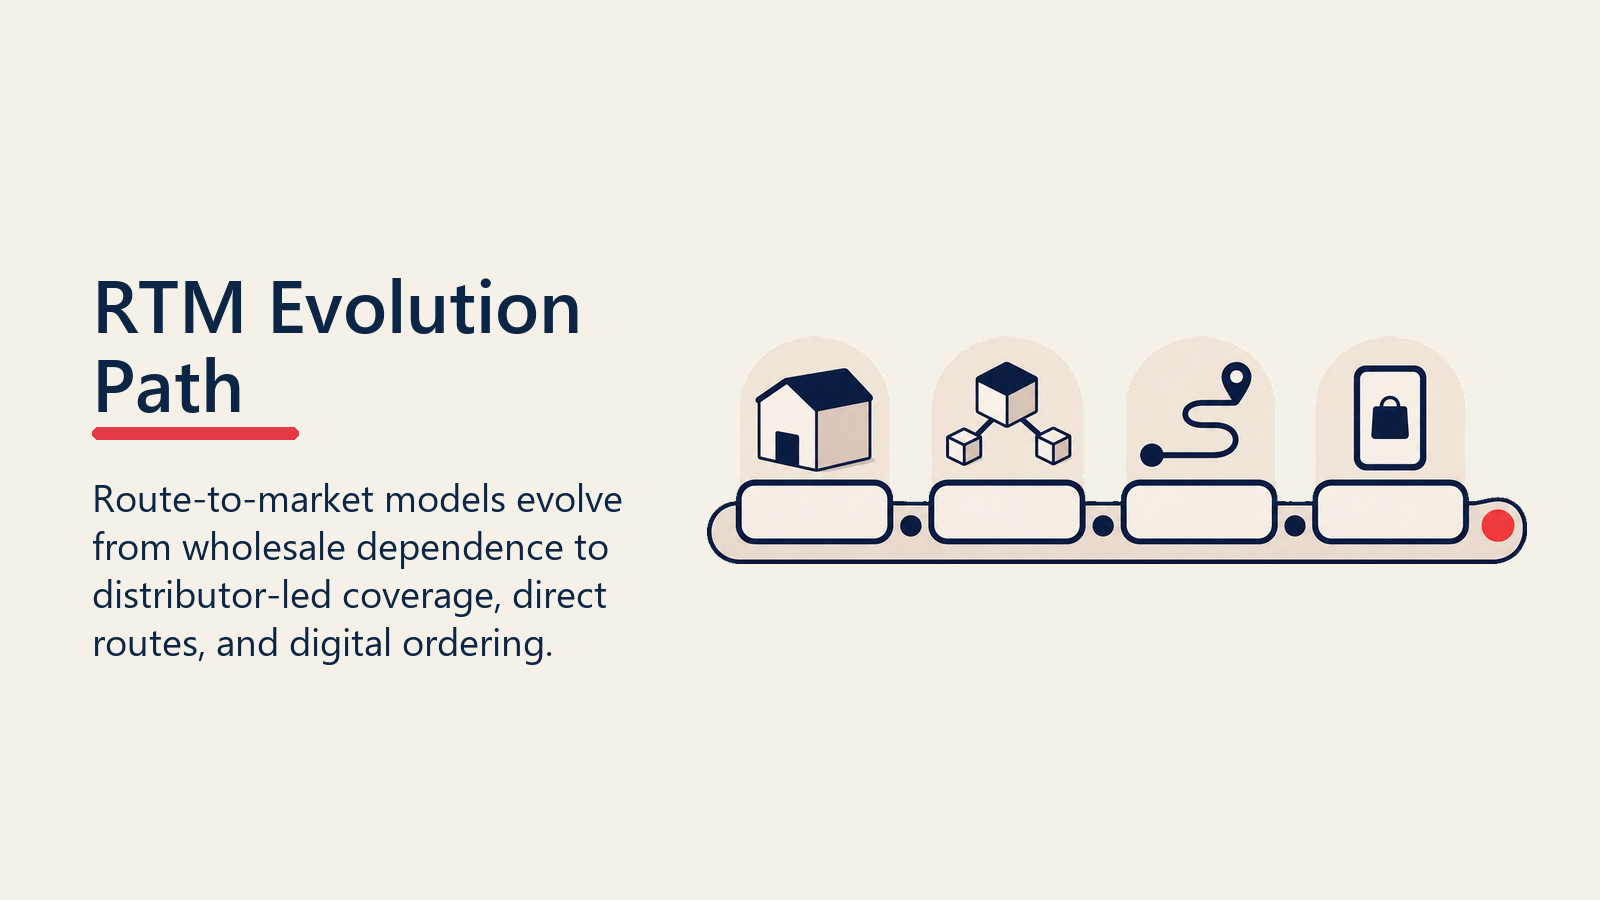
The typical evolution path looks like this:
Phase 1: Wholesale dependent. New market entry or small brands use wholesale as the primary channel. Low cost, low control. The goal is to build awareness and primary sales velocity.
Phase 2: Distributor-led with field team overlay. As volume grows, the company appoints distributors and assigns field reps to manage them. The reps focus on distributor fill rates, secondary sales tracking, and outlet-level execution. Coverage expands faster than a direct model could achieve.
Phase 3: Direct coverage in high-density segments. The company identifies the urban or high-volume outlet segments where direct coverage earns better economics than distributor-led. DSD or van sales are layered in for those segments. Distributors remain for lower-density geography.
Phase 4: Digital layer for order efficiency. eB2B platforms are piloted in urban general trade to shift rep activity from order-taking to relationship management. The logistics backbone (own or third-party) handles fulfillment.
The evolution is driven by volume, not time. Moving from Phase 2 to Phase 3 prematurely, before outlet density and average order values justify it, is the most common RTM over-investment mistake. See also rural distribution and sub-stockist models for the specific architecture required to cover the rural coverage gap that direct models can't reach economically.
Sales forecasting methods are the planning inputs that tell you when a new outlet segment has reached the volume threshold that justifies a model change.
Common Pitfalls
These failure patterns show where the wrong route-to-market model creates avoidable cost, complexity, or channel conflict.
Over-extending DSD into low-volume rural territory. DSD economics break down fast outside dense urban markets. A company that extends its direct delivery model into rural geography because "we want to own the outlet relationship" will find that cost per drop blows past any defensible threshold. The relationship is better owned through a well-managed sub-stockist under a regional distributor.
Under-investing in sub-stockist networks. In markets where the bottom tier of general trade is unreachable by the primary distributor's fleet, sub-stockists (smaller secondary distributors who buy from the primary distributor and sell locally) are the mechanism for depth. Companies that don't invest in mapping, appointing, and managing sub-stockists end up with strong urban numeric distribution and a rural gap that a competitor fills.
Letting distributor appointment become permanent without performance review. Distributor territories assigned five years ago may no longer match the company's geographic footprint, SKU mix, or volume ambitions. Annual RTM reviews should include distributor coverage audits, with reappointment or territory adjustments where performance doesn't meet the model. Distributor and stockist management frameworks provide the governance structure for these reviews.
Building the wrong hybrid. Running DSD, van sales, and distributor-led in the same outlet segment creates channel conflict, parallel pricing, and distributor resentment. The hybrid RTM model works when models cover clearly distinct outlet segments with minimal overlap, not when multiple models compete for the same outlet. Getting that distinction right is the annual RTM review's most important output.
Conclusion: RTM is a Strategic Asset
Route-to-market is not a logistics problem. It's a commercial architecture decision that determines your coverage ceiling, your cost structure, and your field team's effectiveness for the next three to five years.
The organizations that treat RTM as a living asset, reviewing it annually as volume grows, geography shifts, and digital infrastructure improves, consistently build more defensible market positions than those that set it once and inherit the misalignment for years. Direct store delivery, van sales, distributor-led indirect, and eB2B each have a role in the right market at the right scale. The discipline is knowing which model belongs where, and having the cost-to-serve data to make that call with evidence rather than preference.
Review your RTM the same way you review your commercial plan: annually, with data, against a clear set of economic and coverage criteria.
Frequently Asked Questions about Route-to-Market Models
What is a route-to-market model in FMCG?
An RTM model is the architecture that defines how a manufacturer's product moves from its production or storage point to the retail outlet where it's sold to consumers. It determines which intermediaries are involved (distributors, van sales reps, wholesale traders), how often outlets are visited, who delivers stock, and who owns the outlet relationship at each point in the chain.
When does DSD make sense vs distributor-led indirect?
DSD makes economic sense when outlet density is high enough to support 25 to 40 drops per vehicle per day, when freshness or compliance monitoring requires direct control, and when average order values are high enough that the direct delivery cost is lower than the distributor margin on the same volume. Below those thresholds, distributor-led indirect typically produces a lower cost per drop and faster coverage expansion.
What is cost per drop and how do you calculate it?
Cost per drop is the total cost of one delivery visit to one outlet. It's calculated by dividing the total daily cost of the delivery model (vehicle, driver, fuel, supervisor overhead) by the number of outlet stops completed per day. Comparing cost per drop across models, against the average order value per outlet, tells you which model is economically justified for each outlet segment.
How often should a company review its RTM architecture?
Annually is the minimum. Volume growth, new geographic expansion, changes in outlet mix (general trade declining vs modern trade growing), and improvements in digital infrastructure (eB2B platforms, SFA tools) all affect which RTM model is most appropriate. Companies that don't review RTM at least annually tend to find themselves running expensive direct coverage in markets that no longer justify it.
What is the main risk of wholesale push as an RTM model?
Wholesale push sacrifices visibility, execution control, and outlet-level data in exchange for lower cost-to-serve. The deeper risk is price instability: wholesalers undercut each other to move volume, which drives unauthorized trade across channel and geography boundaries, erodes brand pricing discipline, and leaves the manufacturer with no data on where product is actually flowing. It's the appropriate model for new market entry or commodity categories, but not for building a branded FMCG position in a market where you intend to compete on execution.
How is eB2B changing the RTM model in emerging markets?
eB2B platforms like Warung Pintar in Indonesia, Udaan in India, and similar operators in Southeast Asia and the Middle East are shifting the rep's role from order-taker to relationship manager. Outlets order digitally, which compresses the order cycle and creates outlet-level purchase data that transforms commercial planning. But eB2B requires outlet digitization, reliable logistics fulfillment, and a change in rep capability that many field teams haven't made yet. Urban penetration of eB2B remains significantly higher than semi-urban or rural, which is why it typically works as a Phase 4 overlay rather than a standalone model.
What's the most common RTM mistake in fast-growing markets?
Over-extending direct coverage into territory before the economics support it. Companies in high-growth markets often assume that owning the outlet relationship requires direct coverage everywhere. In practice, a well-managed distributor with clear target coverage, secondary sales reporting, and joint business planning produces better outcomes in non-urban markets than a direct model stretched beyond its economic density threshold. The expansion to direct in any segment should follow the cost-per-drop break-even analysis, not the organizational appetite for control.
Learn More

Senior Implementation Consultant
On this page
- The Six RTM Models
- Direct Store Delivery (DSD)
- Distributor-Led Indirect
- Van Sales (Cash-and-Carry Mobile)
- Pre-Sell with Third-Party Delivery
- Wholesale Push
- eB2B (Digital Ordering)
- RTM Decision Matrix
- Do You Need a Hybrid RTM? Almost Certainly Yes
- Cost-to-Serve Analysis: Calculating Cost per Drop
- RTM Evolution Path
- Common Pitfalls
- Conclusion: RTM is a Strategic Asset
- Learn More