FMCG Sales Growth Model: The Commercial Framework Every Sales Director Needs
Turn this article into takeaways for your work.


Each assistant summarizes the article only for you and suggests best practices for your work.
Walk into the monthly business review of almost any fast-moving consumer goods (FMCG) company and you'll see the same pattern. Revenue hit or missed. Then the conversation jumps to next quarter. What's missing is the architecture underneath. Which levers moved? Why did they move? And why those rather than others?
That gap between result and cause is where most FMCG commercial planning breaks down. Teams know the scoreboard. They don't know the game.
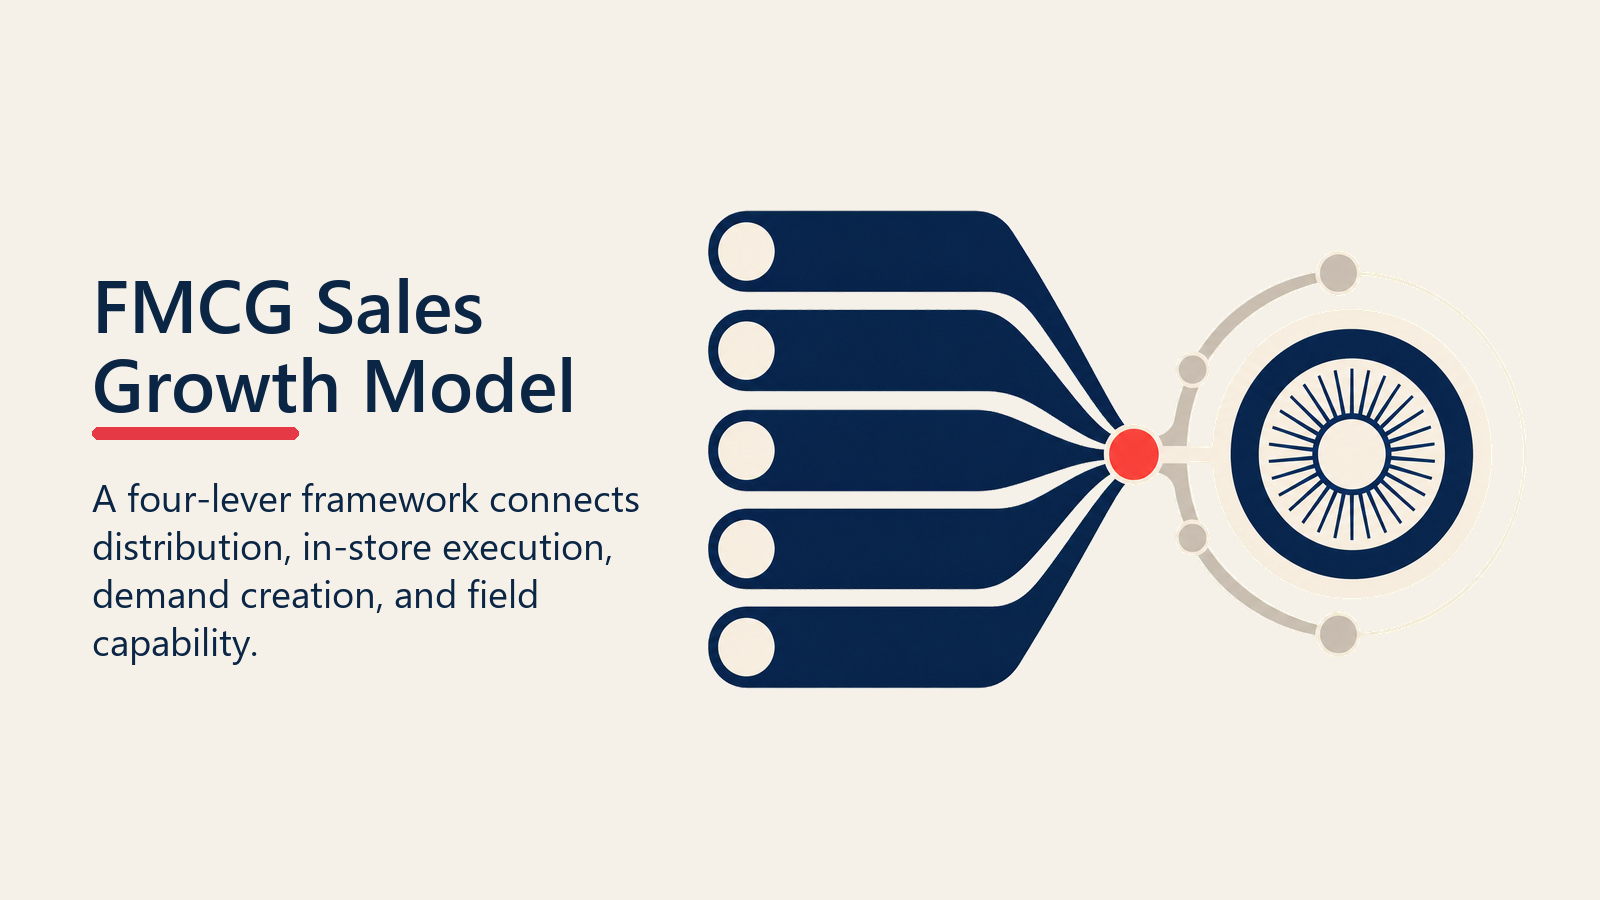
The FMCG Sales Growth Model is the commercial language that connects the two. It's not a forecasting tool. It's a shared framework that lets sales directors, regional managers, and distributor managers look at the same market and talk about the same things: which outlets you cover, how well you execute inside them, what you're doing to pull demand, and whether your organization has the capability to sustain the gains.
Why Market Share is Won at the Last Mile
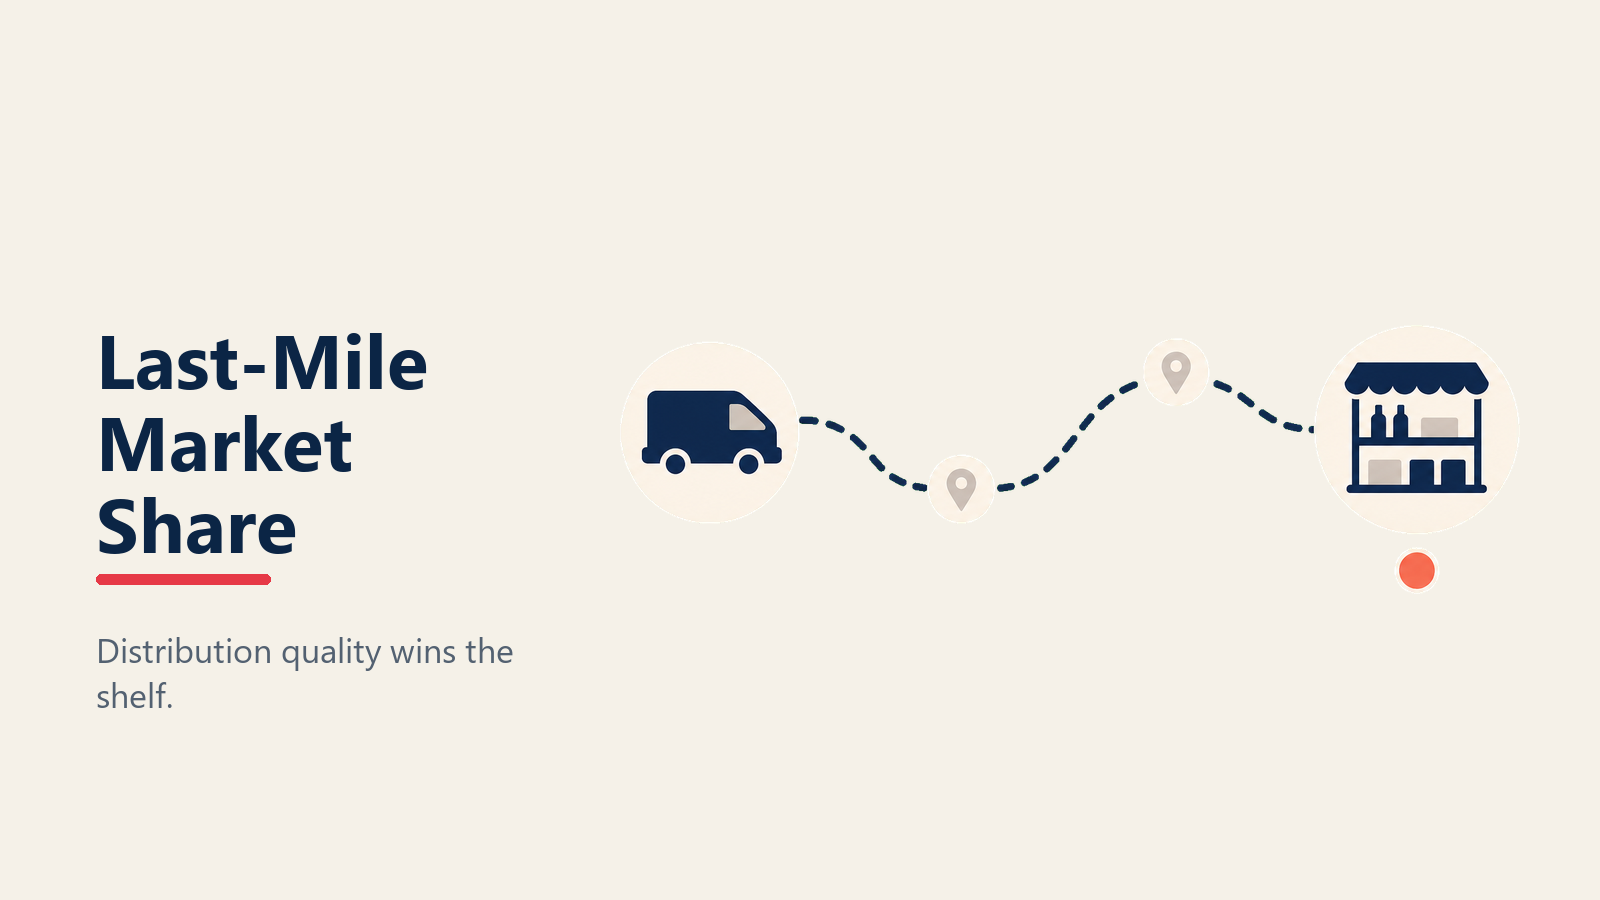
Pricing power, brand equity, and product innovation set the ceiling for what's possible. But the ceiling is meaningless if your product isn't on the right shelf at the right price in the right outlet when a shopper is standing in front of it.
Key Facts
- In one NielsenIQ Vietnam study, a manufacturer with 85% national numeric distribution was still absent from 44,000 high-value outlets that accounted for 57% of category sales, according to NielsenIQ's distribution analysis in Vietnam.
- In most emerging markets, traditional general trade channels still account for 60-70% of FMCG volume. Bain's research on consumer goods in developing economies confirms traditional trade will not lose relevance in semi-urban and rural areas any time soon.
- According to Bain's consumer-products commercial excellence practice, 90% of surveyed consumer products executives ranked in-store execution among their top five business priorities, yet fewer than half felt their field teams were operating at full potential.
In most FMCG markets, the top-performing sales organizations don't win because they have better products. They win because their field teams execute more consistently across more outlets, more often, across more SKUs. A beverage brand that achieves 85% weighted distribution in a target geography will outsell a competitor with 60% weighted distribution even when the competitor's product is marginally preferred in a taste test. A snack company whose van sales reps ensure secondary display compliance at 70% of their kirana accounts during promotion periods will see sales lifts that their trade marketing team can't replicate through in-store marketing alone. NielsenIQ's analysis of distribution strategy confirms that weighted distribution quality, not just numeric coverage breadth, is what determines return on distribution investment.
This is the last-mile reality of FMCG commercial growth. Strategy sets direction. Execution compounds the gains.
The Four Growth Levers
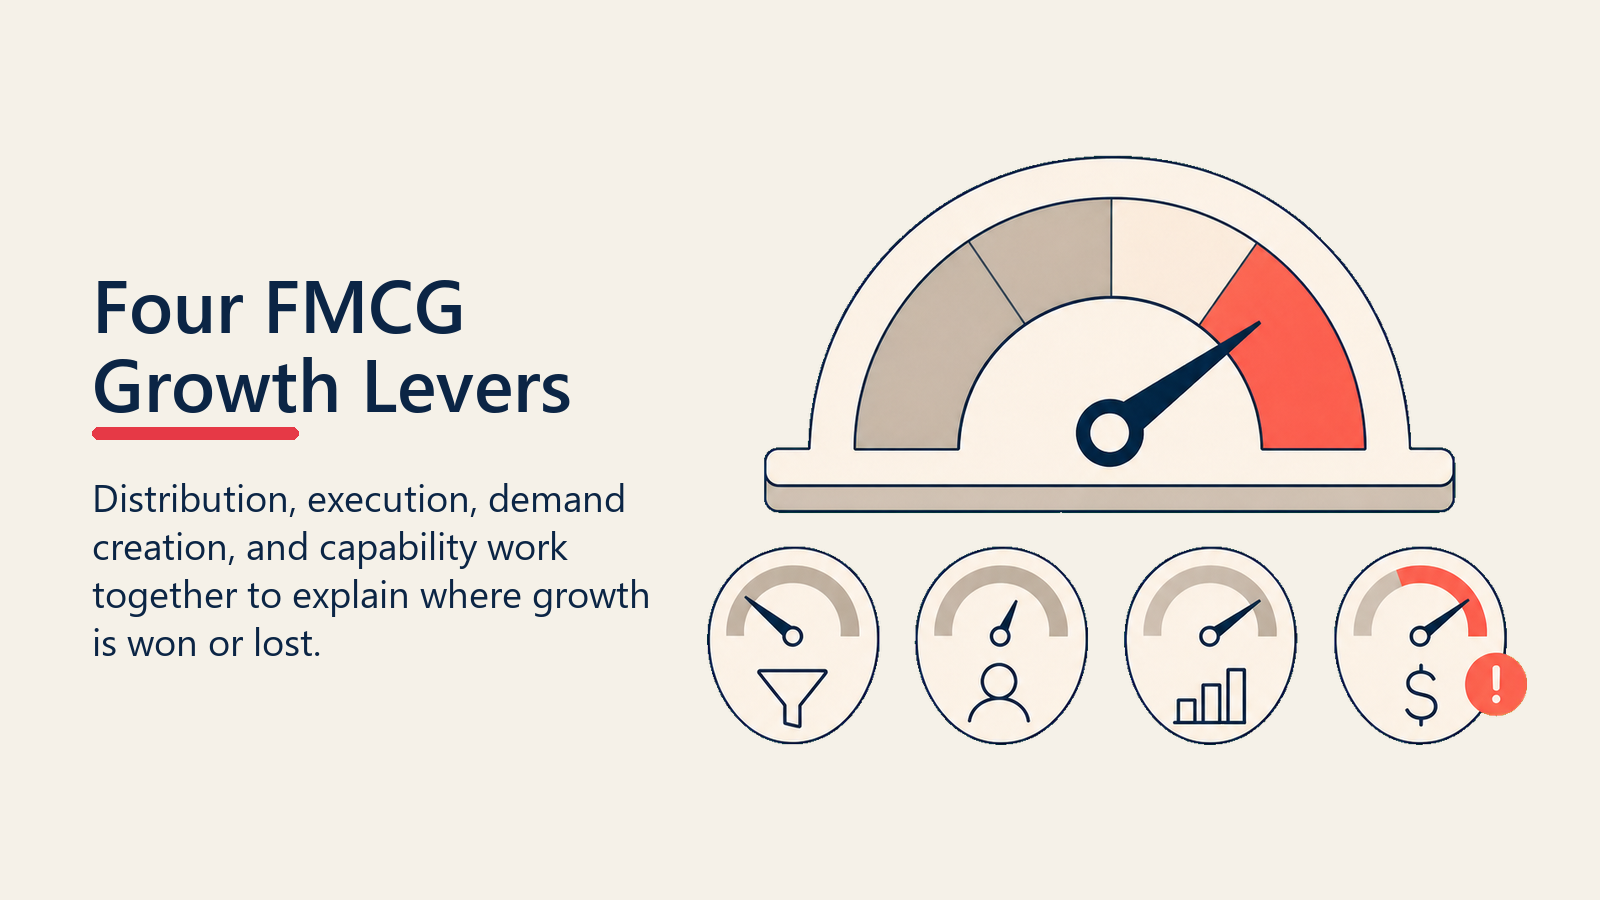
Every FMCG market, whether it's a mature organized retail environment or a fragmented general trade landscape built around kiranas and mom-and-pop stores, runs on the same four interlocking drivers of revenue.
Lever 1: Distribution Gain
Distribution is the foundation. You can't sell to an outlet that doesn't stock your product, and you can't build brand equity with a shopper who never sees it.
Distribution has two dimensions that matter differently to different parts of the commercial team. Numeric and weighted distribution are not interchangeable. Numeric coverage measures the percentage of outlets that carry at least one of your SKUs. Weighted distribution measures the percentage of category volume flowing through outlets where you're present. You can have strong numeric coverage and weak weighted distribution if your product is present in low-volume outlets but absent from the high-volume supermarkets and large grocers that drive the bulk of category sales.
Distribution gain includes: activating new outlets, expanding the SKU range within existing outlets, and maintaining distribution on core lines so that gaps don't erode the numeric base you've already built.
Lever 2: In-Store Execution
Having stock in the back room doesn't drive sales. Having it on the shelf, in the right position, at the right price, with the right POS, is what converts shopper traffic into revenue.
In-store execution covers availability (the product is on the shelf, not out-of-stock), visibility (it's positioned at eye level or in the priority facing position), and price compliance (it's sold at the recommended price or within an acceptable range). For modern trade channels, execution extends to planogram compliance and promotional display compliance. For general trade, it's simpler but no less important: the rep confirms the product is visible, priced correctly, and that the shelf facing hasn't been displaced by a competitor.
This is where field force discipline separates high-performing territories from average ones. A rep who confirms execution at every stop, logs the gaps, and raises out-of-stock and compliance issues in real time creates a feedback loop that management can act on. A rep who marks visits as complete without conducting a proper execution check is producing data that feels like activity but has no commercial value.
Lever 3: Demand Creation
Distribution and execution are necessary but not sufficient. Without demand creation, you're in the position of the outlet that stocks your product but sells it slowly enough that the distributor eventually drops it from their priority list.
Demand creation covers everything that pulls the shopper toward your product at the point of purchase: trade promotions, off-shelf display activations, consumer promotions, shopper marketing, and the rep's in-outlet engagement with the store owner or floor staff. In general trade environments, the rep's relationship with the kirana owner or grocery manager is itself a form of demand creation. An owner who understands your current promotion, knows the product's movement rate, and is reminded of the opportunity to display it prominently is a better commercial partner than one who simply receives stock and waits.
For modern trade and large-format retail, demand creation is more structured: promotional event calendars, category management agreements, co-funded in-store activity. But the principle is the same. Supply without pull creates stock, not sales.
Lever 4: Organizational Capability
The fourth lever is rarely discussed in commercial planning, but it's often the binding constraint. Field force effectiveness, distributor capability, and systems infrastructure are the organizational inputs that determine whether the first three levers can be executed at scale.
A field team that doesn't have route optimization, CRM tools, or a structured visit agenda will execute distribution and in-store activity inconsistently regardless of how clear the strategy is. A distributor that lacks the working capital, cold chain infrastructure, or administrative capability to manage secondary sales data won't give you the visibility you need to make decisions at the outlet level. These aren't performance problems. They're capability gaps, and they need different interventions than coverage targets and incentive plans.
The Revenue Equation
The FMCG Commercial Growth Framework: a four-lever model that connects outlet coverage (Distribution Gain), in-outlet conversion (In-Store Execution), pull-through activity (Demand Creation), and people and systems capacity (Organizational Capability) into a single diagnostic language for commercial teams. Each lever is both a growth driver and a failure mode, and the framework's core utility is identifying which one is the binding constraint before committing resources.
The four levers translate into a revenue formula that sales directors can use to structure monthly reviews:
| Component | What it measures | Formula |
|---|---|---|
| Outlet base | Total outlets covered by your route-to-market (RTM) | Active outlets at period end |
| Distribution depth | SKUs stocked per outlet | Total SKU-outlet combinations / Total outlets |
| Velocity per outlet | Volume sold per stocked outlet per period | Total secondary sales volume / Active stocked outlets |
| Price realization | Average selling price vs recommended | Actual net revenue / Units sold |
Revenue = Outlet base x Distribution depth x Velocity x Price realization
This formula is useful not because it produces a precise number (the real model requires data at the outlet or territory level), but because it tells you which factor changed and by how much. If revenue missed plan, the formula isolates the cause: was it a drop in active outlets (distribution lost), a decline in velocity (execution or demand problem), or a price realization gap (compliance or discount issue)?
That diagnostic clarity is what lets a sales director have a different conversation with a regional manager than "we missed by eight percent." Instead, it's "we missed because velocity per outlet in the North region dropped 12% and we have three identified execution gaps from the field audit. Here's the intervention plan."
Channel Architecture
The growth model operates across four channels that each contribute differently to the same commercial outcome.
General trade (kiranas, mom-and-pop stores, wet markets, independent grocers) typically accounts for 60 to 80 percent of volume in emerging markets. Bain's research on consumer goods in developing economies confirms that traditional trade won't lose relevance any time soon, particularly in semi-urban and rural areas where modern retail penetration remains low. In Indonesia alone, traditional trade held approximately 69% of FMCG market share as recently as 2023, according to Statista's FMCG channel distribution data for Indonesia (a subscriber-access dataset). It's high-frequency, low-value per transaction, and dependent on the rep relationship and distributor efficiency to function. Distribution gains here are hard-won and slow to build. But they compound: each outlet activated is a revenue base that persists across cycles as long as the rep maintains coverage.
Modern trade (supermarkets, hypermarkets, chain convenience stores) is lower in outlet count but higher in volume concentration. A single negotiated planogram compliance agreement with a national supermarket chain can drive more volume than 200 general trade activations. The trade-off is that modern trade requires structured account management, promotional investment, and compliance monitoring at scale. The general trade, modern trade and eB2B dynamics deserve a dedicated analysis for each market.
Wholesale functions as an amplification channel in markets where the company can't directly reach every outlet. A well-managed wholesale partner who actively pushes your product into the sub-stockist and small retailer network can extend your effective coverage at lower cost than direct field expansion. The risk is limited visibility: wholesale-driven volume is harder to trace to individual outlets or SKUs.
eB2B (digital ordering platforms for retailers) is the emerging channel in urban markets. It compresses the order cycle, reduces the rep's administrative load, and creates digital outlet-level data that the traditional model doesn't generate. But it requires outlet digitization that many general trade accounts in emerging markets haven't completed. Which raises a more fundamental question: regardless of channel, is the distribution you have today actually covering the outlets that move the most volume?
The Compounding Effect of Consistent Coverage
This is the insight that separates the sales directors who build durable market positions from those who chase quarterly targets. Distribution gains don't just add revenue in the period they're achieved. They compound.
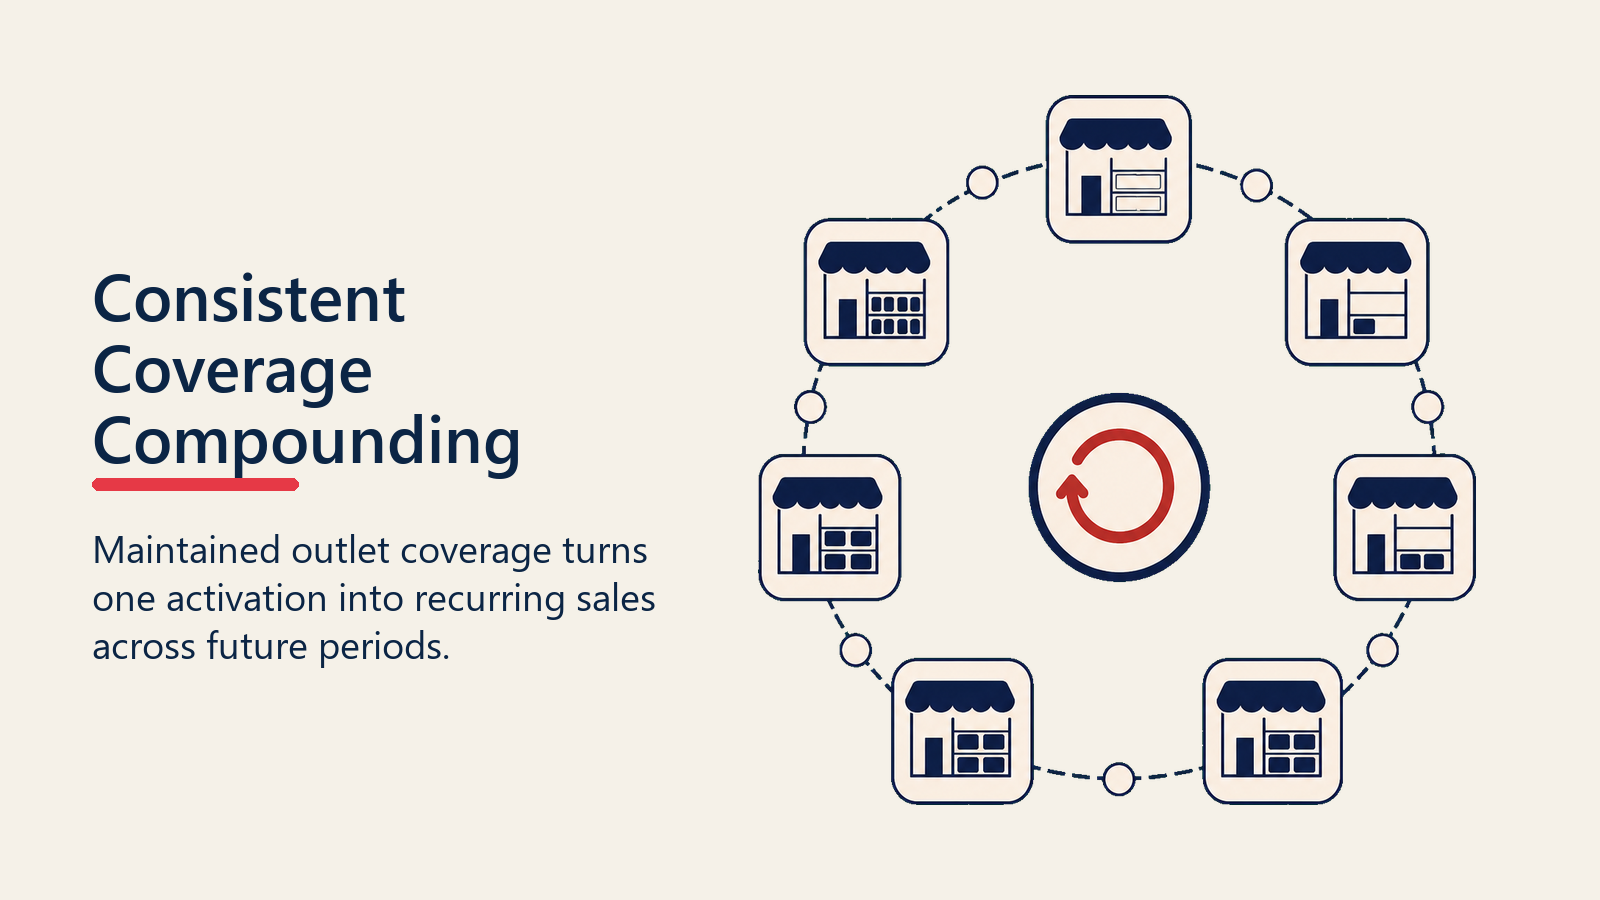
An outlet activated in January contributes revenue in every subsequent period. If the rep maintains coverage and execution in that outlet, the velocity per outlet tends to increase over time as the owner becomes familiar with the product, builds reorder confidence, and starts recommending it to customers. A 10% improvement in numeric distribution in Q1, sustained through consistent field coverage, delivers 10% more revenue-generating outlets in Q2, Q3, and Q4. Each of those periods adds incremental SKU depth and velocity gains on top of the original distribution win.
The math gets even more favorable when promotion periods arrive. A company with 80% numeric distribution in a target geography during a major consumer promotion captures 80% of the addressable promotion opportunity. A company with 55% coverage captures 55%, regardless of how well the promotion is designed.
That gap between nominal and effective distribution is precisely what the weighted distribution measure exposes. For a practical guide to measuring it, see numeric and weighted distribution. And once you know the gap, the next question is what it actually costs to close it.
Understanding the economics of this investment requires a solid grip on FMCG field sales economics, including what it actually costs to put a rep in front of each outlet and what return that investment generates over time.
What Maturity Stage Is Your Commercial Operation At?
Most FMCG commercial operations don't arrive at this growth model fully formed. They evolve through recognizable stages, and identifying where you sit determines what to fix first.
Stage 1: Reactive Firefighting The team tracks primary sales (factory shipments to distributors) but has limited visibility into secondary sales (distributor-to-outlet movement) or in-store execution. Decisions are made on distributor sell-in data, which can mask outlet-level gaps for months. Field force activity is measured by call count, not execution quality.
Stage 2: Activity-Driven Coverage The team has a structured beat plan and measures calls per day and call completion rate. Distribution is tracked at the territory level. But the data is mostly activity data rather than outcome data. The team knows where reps went; they don't know what happened at each outlet.
Stage 3: Execution Monitoring The team tracks execution quality at the outlet level through SFA data capture (availability, visibility, price compliance). Distributor secondary sales data is reconciled weekly. Area managers review outlet-level execution scores in weekly meetings and coach reps against specific gaps.
Stage 4: Data-Driven Commercial Planning The team runs the full growth model. Distribution, execution, demand creation, and organizational capability are all tracked with leading indicators. Territory plans are built from outlet-level data. Monthly business reviews are structured around the revenue formula, isolating which lever moved and why. Territory analytics and sales dashboards are the operational tools that make this possible.
Most FMCG commercial teams in emerging markets sit between Stage 1 and Stage 2. The jump to Stage 3 requires SFA adoption and distributor data integration. The jump to Stage 4 requires both. So before asking which growth lever to pull, it's worth asking: does your team have the data to even know if it moved?
Diagnostic Questions
Before committing to any commercial investment (headcount, promotion, distributor incentive, channel expansion), a sales director should be able to answer the questions that identify the binding constraint:
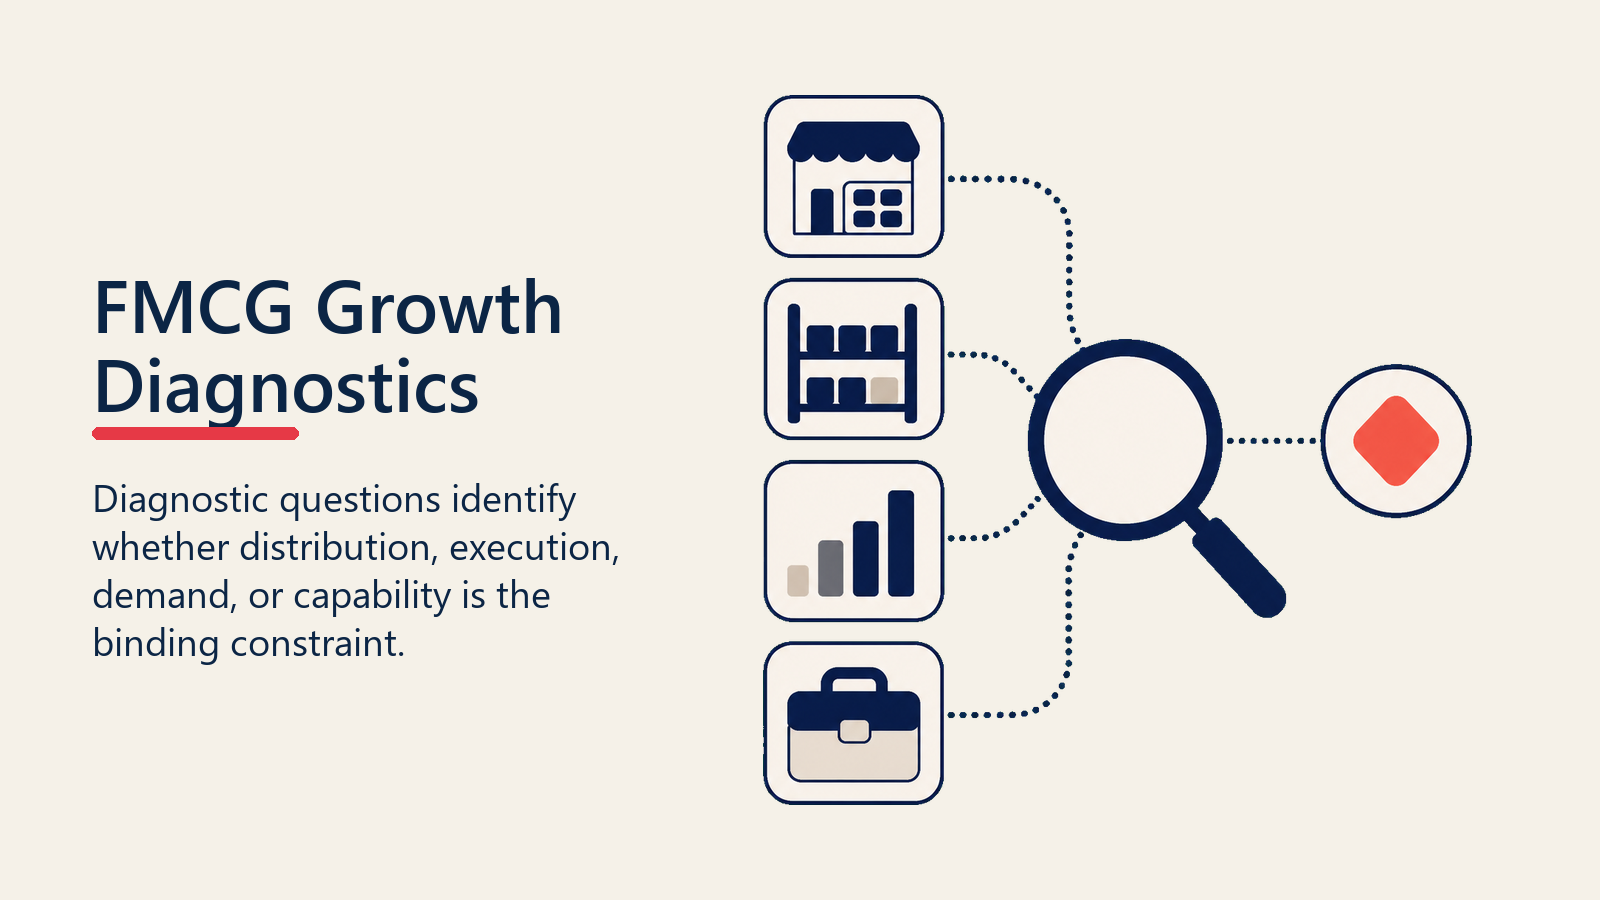
Distribution: What is your current numeric and weighted distribution in the target geography? Which outlet segments are underpenetrated relative to category volume? What's the activation rate for new outlets in the last three cycles?
In-store execution: What's your out-of-stock rate at the outlet level? What percentage of outlets are price-compliant? What's your share of shelf vs target in key accounts?
Demand creation: What's the pull-through rate on your current trade promotions? Are outlet owners aware of the current consumer offer? What's your secondary display compliance rate?
Organizational capability: What's your average calls per day per rep? What's the span of control for area managers? Do your distributors have real-time stock visibility? Is the sales capacity planning model aligned to the growth ambition?
If you can't answer these questions with data, the binding constraint is the fourth lever: organizational capability. Fix the visibility and measurement infrastructure before investing in the first three.
Conclusion: One Growth Model, One Commercial Language
The value of the FMCG Sales Growth Model isn't in the framework itself. It's in what happens when the entire commercial team, from the sales director to the regional manager to the area manager to the distributor's field supervisor, uses the same framework to talk about the same market.
When everyone understands that growth comes from distribution gain, execution quality, demand creation, and organizational capability working together, the conversations in business reviews change. Instead of debating whose fault the miss was, the team diagnoses which lever underperformed and what intervention addresses the root cause.
That shared commercial language is the foundation of what a sales pipeline should look like in an FMCG context. It's also the prerequisite for every tactical decision that follows, from route-to-market model design to field force sizing to distributor investment prioritization.
Build the framework first. Then build the plan.
Frequently Asked Questions about FMCG Sales Growth Model
What is the FMCG Sales Growth Model?
The FMCG Sales Growth Model is a commercial framework that connects four interlocking drivers of revenue: distribution gain, in-store execution, demand creation, and organizational capability. It gives sales directors a shared language for diagnosing what drove growth (or caused a miss) and for building plans that address root causes rather than just chasing the revenue number.
What's the difference between numeric and weighted distribution?
Numeric distribution measures the percentage of outlets in a territory that carry at least one of your SKUs. Weighted distribution measures the percentage of category volume flowing through outlets where you're present. Weighted distribution is more commercially relevant because it accounts for outlet size: being present in 80% of outlets that drive 90% of category sales is far better than being present in 80% of outlets that drive 40%.
Why do consistent distribution gains compound over time?
Once an outlet is activated and maintained, it contributes revenue in every subsequent period. Over time, the owner becomes familiar with the product, builds reorder confidence, and often increases their average order. Promotion periods amplify the effect: companies with broader distribution capture more of the promotion opportunity regardless of how well the promotion is designed.
What causes most FMCG commercial misses?
Most misses trace back to one of two root causes: a gap in the measurement system that hides execution problems until they become financial ones (Stage 1 or 2 maturity), or a genuine capability constraint in the field force or distributor network that limits how consistently the first three levers can be executed. Identifying which is which requires outlet-level data, not just territory-level revenue tracking.
How does organizational capability affect the other three growth levers?
Organizational capability is the fourth lever and often the binding constraint. A field team without route optimization tools, structured visit agendas, or SFA coverage will execute distribution and in-store activity inconsistently regardless of strategic clarity. A distributor without working capital or secondary sales visibility can't support the execution standards the other levers require. Before investing in coverage, promotions, or headcount, it's worth asking whether the organizational infrastructure can actually deliver what those investments require.
What is the difference between primary and secondary sales in FMCG?
Primary sales refers to manufacturer sell-in to the distributor or stockist. Secondary sales refers to what the distributor then sells to retail outlets. Teams that only track primary sales can look healthy on the revenue line while distributor inventory builds and outlet coverage quietly collapses. Secondary sales data, reconciled weekly, is the early-warning system that primary-only reporting can't provide.
How should a sales director structure a monthly business review around the growth model?
The review should start with the revenue formula: which component changed and by how much? A miss traced to declining velocity per outlet in a specific region is a different conversation than one caused by a drop in active outlets. Once the lever is identified, the next question is whether the root cause is execution quality, organizational capability, or an external market shift. That diagnostic sequence converts the review from a results debrief into an action-planning session.
Learn More

Senior Implementation Consultant
On this page
- Why Market Share is Won at the Last Mile
- The Four Growth Levers
- Lever 1: Distribution Gain
- Lever 2: In-Store Execution
- Lever 3: Demand Creation
- Lever 4: Organizational Capability
- The Revenue Equation
- Channel Architecture
- The Compounding Effect of Consistent Coverage
- What Maturity Stage Is Your Commercial Operation At?
- Diagnostic Questions
- Conclusion: One Growth Model, One Commercial Language
- Learn More