General Trade, Modern Trade and eB2B: Building a Multi-Channel FMCG Distribution Strategy
Turn this article into takeaways for your work.


Each assistant summarizes the article only for you and suggests best practices for your work.
Here's a question most FMCG commercial leaders can't answer cleanly: what percentage of your trade spend is going to modern trade versus general trade, and why is that the right split for your markets?
If the answer is "that's roughly what we've always done," you've already identified the problem. Modern trade growth in Southeast Asia, South Asia, and Sub-Saharan Africa has captured executive attention over the past decade, and understandably so. Hypermarkets and supermarket chains offer cleaner data, formal promotional agreements, and visible shelf presence. But the shift toward modern trade focus has led many FMCG brands to systematically underinvest in the channels where they actually move most of their volume.
In most emerging markets, general trade still accounts for the majority of FMCG volume. That figure shifts by category and geography, but the pattern is consistent enough that a strategy oriented primarily around modern trade wins is, in most markets, a strategy that leaves the majority of the market underserved. And now eB2B (electronic business-to-business) platforms are adding a third channel dynamic that changes how general trade gets served in the first place.
This article gives you a channel-by-channel playbook: how to define each channel, compare their economics, set execution standards, and allocate resources so your multi-channel operation functions as a system rather than three separate campaigns fighting for the same budget.
General Trade Defined
General trade is the universe of independent, small-format retailers: kiranas in India, warungs in Indonesia, sari-sari stores in the Philippines, dukas in East Africa, mama-ntambos in West Africa. In China, the term covers the millions of small neighborhood shops that have coexisted alongside modern formats since the hypermarket boom.
These outlets are typically owner-operated, carry limited shelf space, serve a tight neighborhood catchment, and buy in small quantities. Their competitive advantage isn't price or assortment depth. It's proximity, credit extension to regular customers, and the kind of flexible service that supermarkets can't replicate. The auntie who runs the kirana at the end of the street knows that her neighbor buys the same cooking oil every Saturday and will break a case if the customer needs one bottle.
For FMCG brands, general trade matters for several reasons beyond volume. It provides distribution breadth into neighborhoods and semi-urban areas that modern trade doesn't reach. It's the primary purchase point for daily consumables across most income segments. And it requires a fundamentally different commercial model: smaller drop sizes, higher call frequency, distributor-mediated coverage, and field force activity focused on outlet-level visibility and compliance.
Your route-to-market models framework determines how your product reaches these outlets, whether through a distributor's van sales team, a sub-stockist network, or a hybrid approach. The execution standard for general trade centers on numeric distribution, shelf offtake, and in-store display compliance, not category management presentations or promotional calendar negotiations.
Modern trade operates on a completely different commercial logic, and that gap between channels is where the coordination problems start.
Key Facts: Multi-Channel FMCG Distribution
- General trade accounts for approximately 65-85% of FMCG volume in most emerging markets, with Indonesia specifically at 69% traditional trade share as of Q3 2023 (NielsenIQ channel analysis, 2022; Statista Indonesia FMCG channel data, 2024).
- Modern trade's share of FMCG has grown in emerging markets but remains below 30% of total volume in most Southeast Asian and South Asian markets, with Asia FMCG overall growing 2.7% through 2024 with general trade still leading volume contribution (Kantar Worldpanel Asia FMCG Monitor, 2024).
- eB2B platforms are transforming fragmented retail in emerging markets: McKinsey's analysis of digital disruption in fragmented retail uses $2.8 trillion as a definitional scale estimate for the total opportunity, framing it as the size of the addressable market rather than a precisely measured figure. The analysis identifies eB2B players as the disruptors reshaping how small retailers source FMCG products, with platforms like Udaan (India) and Alibaba LST (China) already reaching millions of small-format outlets. (McKinsey, Digital Disruption: The Rise of eB2B in Fragmented Retail)
Modern Trade Defined
Modern trade is organized retail: hypermarkets, supermarkets, minimarkets, and convenience store chains. Formats include large-format players like Carrefour, Tesco, and local equivalents; mid-format chains; and the rapidly expanding convenience networks (7-Eleven, Alfamart, FamilyMart) that have blurred the boundary between modern and traditional in many Asian markets.
The commercial model for modern trade is structurally different from general trade. Buyers negotiate listings, slotting fees, promotional contributions, and category management commitments. Planograms determine where your product sits on the shelf. Promotional calendars set the tempo for price reductions and in-store activation. And the data feedback loop is real: modern trade retailers share weekly or monthly scan data that tells you exactly what's selling and what's sitting.
Sales and modern trade alignment is a discipline in itself. The risk in modern trade is cost escalation. Listing fees, promotional investments, gondola end placements, and logistics costs can erode margin to a point where the channel is volume-positive but profit-negative for specific SKUs. Every modern trade negotiation requires clear understanding of the profitability floor below which the listing doesn't make commercial sense.
Modern trade also has a halo effect consideration. A brand that's visible and well-presented in a major hypermarket chain builds consumer familiarity that benefits its general trade sales. But this halo effect doesn't justify indefinite losses in the MT channel, and it doesn't automatically translate into GT shelf placement. The two channels need to be managed on their own commercial logic.
eB2B is the newest channel in this mix, and it changes the economics of the other two.
eB2B Defined
eB2B platforms are digital ordering systems that allow general trade retailers (kiranas, warungs, small shops) to order directly from a digital platform rather than waiting for a van sales visit. The platform aggregates demand from thousands of small retailers, negotiates supply terms with manufacturers and distributors, and handles logistics, credit, and sometimes last-mile delivery.
Major platforms include Udaan in India, Jumbotail in India, Ula in Indonesia, and a range of others across Southeast Asia and Africa. Some are pure-play aggregators; others have built their own warehouse and logistics networks. The model varies but the commercial proposition to the small retailer is consistent: better assortment, competitive pricing, faster reordering, and access to credit without the relationship dependency on a local distributor.
For FMCG brands, eB2B creates both opportunity and complexity. The opportunity is reach: a single platform integration can connect a brand to tens of thousands of small retailers that a field force couldn't economically visit directly. The complexity is channel governance. If your brand's eB2B price undercuts the distributor's price, you've created a structural conflict that will damage your distributor relationships. And if eB2B margins compress below distributor economics, you'll face pressure to differentiate the SKU mix or the promotional terms between channels.
Understanding how each channel's economics compare is the starting point for making those trade-offs deliberately.
How Do Channel Economics Compare Across GT, MT, and eB2B?
The decision about how to allocate resources across channels starts with understanding the economics of each.
| Channel | Gross Margin Contribution | Cost-to-Serve | Payment Terms | Promotional Investment Requirement |
|---|---|---|---|---|
| General Trade (direct coverage) | High | High (small drops, high frequency) | Cash or short credit via distributor | Moderate (in-store displays, scheme incentives) |
| General Trade (distributor-served) | Moderate-High | Moderate (distributor absorbs logistics) | Distributor extends credit to retailer | Moderate (pushed through distributor scheme) |
| Modern Trade | Moderate | Moderate-High (logistics, compliance) | 30-90 day payment cycles | High (listing fees, promotions, planogram costs) |
| eB2B (platform-mediated) | Variable | Low per unit (platform handles logistics) | Platform handles retailer credit | Low-Moderate (digital promotional slots) |
The cost-to-serve calculation for general trade changes significantly depending on whether you're covering it directly through your own or distributor's van sales team, or relying on a sub-stockist network or eB2B platform as the primary reach mechanism. Direct coverage gives you execution control; it also carries the highest fixed cost per outlet reached.
Modern trade's payment terms deserve particular attention. The 30-to-90-day payment cycle in organized retail is a working capital drag that often doesn't get modeled into channel-level profitability analysis. A brand that allocates 40 percent of its trade spend to modern trade but takes 60 days to collect revenue from that channel is effectively subsidizing a capital-intensive route to market.
Value selling principles apply to the MT negotiation. You need to walk into a buyer meeting knowing your channel-level economics, the traffic and basket data that justifies your planogram ask, and the floor below which the promotional co-investment doesn't generate a return.
Channel-Specific Execution Standards
Each channel requires different execution standards and different metrics to confirm that the standard is being met.
General Trade Execution Standards
- Numeric distribution: target outlet coverage within each distributor territory, tracked weekly
- Shelf compliance: correct SKU range stocked, primary SKU visible at eye level
- Display compliance: branded display units or shelf talkers present and undamaged
- Out-of-stock rate: below 5% for primary SKUs at visited outlets
- Distributor van call frequency: minimum weekly for A-outlets, bi-weekly for B-outlets
Numeric and weighted distribution are the foundational metrics for GT coverage. Numeric tells you how many outlets stock your product. Weighted tells you whether those outlets are high-volume. Both matter; weighted distribution is the sharper signal for commercial performance.
Modern Trade Execution Standards
- Planogram compliance: correct placement verified at each store visit
- Promotional execution compliance: agreed promotional price in place, gondola end executed on schedule
- Days-out-of-stock: zero for primary SKUs, less than 5% for secondary range
- New listing rollout speed: target days from listing agreement to shelf-ready across the chain
- Category share of shelf: tracked against negotiated planogram share
eB2B Execution Standards
- Listing penetration: percentage of target outlets on the platform ordering at least one SKU monthly
- Active buyer rate: percentage of registered retailers placing at least one order per month
- Order fill rate: percentage of ordered SKUs dispatched in full within the SLA
- Digital shelf visibility: product images, descriptions, and pricing accurate and current on the platform
Resource Allocation Framework
How you split your field force, trade spend, and assortment across channels should follow market maturity logic, not historical habit.
Market Maturity Stage 1: General Trade Dominant
In markets where modern trade penetration is below 15 percent and eB2B is nascent, the primary resource allocation should favor GT coverage depth. This means a large portion of your field sales representatives focused on distributor management and outlet-level GT execution, with minimal modern trade key account resources. Trade spend prioritizes GT scheme incentives and distributor support. eB2B investment is experimental, limited to pilot partnerships.
Market Maturity Stage 2: Dual-Channel Balance
In markets where modern trade has reached 15 to 30 percent of volume and eB2B platforms have established meaningful retailer bases, resource allocation shifts. Modern trade gets dedicated key account managers and promotional budgets. GT coverage becomes more efficient through eB2B platform partnerships that reduce the per-outlet cost of reaching fragmented retailers. The field force mix includes MT-specialized negotiators alongside GT coverage managers.
Market Maturity Stage 3: Three-Channel Coordination
In markets with modern trade above 30 percent and established eB2B ecosystems, the management challenge is coordination rather than coverage. Each channel needs its own commercial lead, its own promotional calendar, and its own P&L view. The risk is channel conflict: promotional pricing in one channel leaking into another, or MT listings undermining GT distributor economics. Governance frameworks for price architecture and promotional differentiation become critical.
Trade marketing and field alignment is what ties channel execution together at the operational level. Without it, GT field reps and MT key account managers operate independently, run conflicting promotions, and erode each other's margins.
A practical allocation starting point for a mature multi-channel operation:
| Resource | GT (Distributor) | MT Key Accounts | eB2B |
|---|---|---|---|
| Field force headcount | 60-70% | 20-25% | 5-10% |
| Trade spend | 45-55% | 35-45% | 5-15% |
| Marketing investment | 30-40% | 40-50% | 10-20% |
These ranges are illustrative starting points. Your actual split should be calibrated against channel-level revenue contribution, growth trajectory, and category-specific dynamics. A high-frequency impulse category in a mature urban market will look very different from a cooking ingredient in a rural market where modern trade barely registers.
Avoiding Channel Conflict
The structural risk in a multi-channel FMCG operation is that each channel's trade terms create arbitrage opportunities that erode the others. A wholesaler who buys at distributor price and sells to retailers at a margin that undercuts the distributor's retail price is one example. A modern trade chain that negotiates below-cost promotions funded by trade spend that effectively subsidizes MT at GT's expense is another.
Wholesale channel management has its own discipline around preventing gray-market flow and price bleed between channels. The principles are similar across the channel map: set price floors by channel type, monitor through field audits, and enforce through supply discipline when violations occur.
For eB2B specifically, the platform pricing governance is critical. Many eB2B platforms compete aggressively on price to win retailer loyalty, and the pressure on the manufacturer to fund below-market pricing is real. If your eB2B channel price consistently undercuts the distributor's selling price, you're teaching traditional retailers that the platform is always cheaper and undermining the distributor's ability to invest in your brand.
The independent vs chain pharmacy tension in pharmaceutical distribution mirrors this exactly: when chains get better terms than independents, independent loyalty erodes. The FMCG analog is the relationship between modern trade and general trade economics. A retailer who can buy from a GT distributor or order through eB2B at meaningfully different prices will route toward the cheaper channel, and your channel map will shift in ways you didn't plan. (See Learn More below for the pharma channel governance framework.)
The Market Maturity Channel Sequencing Model
The sequencing model links channel investment to market structure, so resources follow where consumers actually buy.
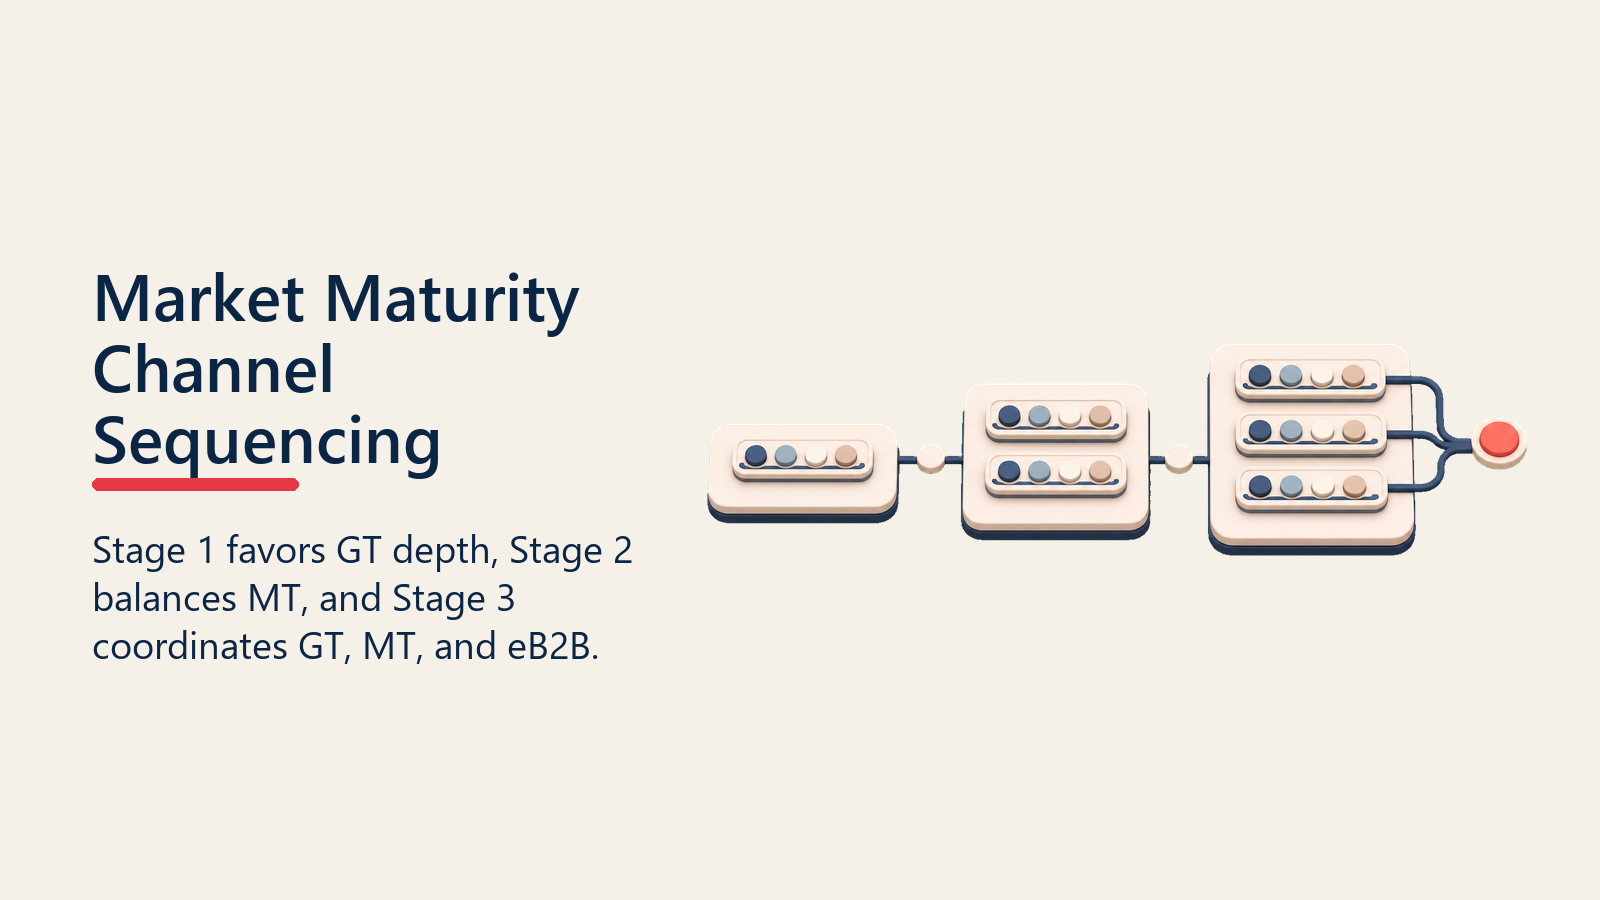
The Market Maturity Channel Sequencing Model: Channel resource allocation should follow market development stage, not historical habit or headquarters preference. In Stage 1 markets (modern trade penetration below 15%), the priority is general trade depth: the field force, distributor incentives, and trade spend should concentrate there because that is where the volume is. Stage 2 markets (15-30% modern trade) call for dual-channel investment, with MT getting dedicated key account resources alongside GT coverage management. Stage 3 markets (above 30% modern trade with an established eB2B ecosystem) require three-channel coordination with a unified price architecture and shared promotional calendar. The mistake most multi-national FMCG teams make is applying a Stage 2 or Stage 3 commercial model to a Stage 1 market because headquarters is more comfortable with organized retail. The volume doesn't follow the model preference; it follows where consumers actually buy.
A Coordinated Multi-Channel Approach
The instinct to optimize each channel independently, with its own team, its own targets, and its own trade spend bucket, is understandable. It's cleaner to manage. But it consistently produces suboptimal outcomes because the channels aren't independent. Consumer behavior crosses them. Retailer behavior responds to price signals across them. And your brand's equity is built or eroded across all of them simultaneously. Bain's emerging market research documents the dual-channel requirement clearly: FMCG companies that succeed in emerging markets maintain distinct but coordinated go-to-market models for traditional and modern trade, not a unified approach that averages between the two.
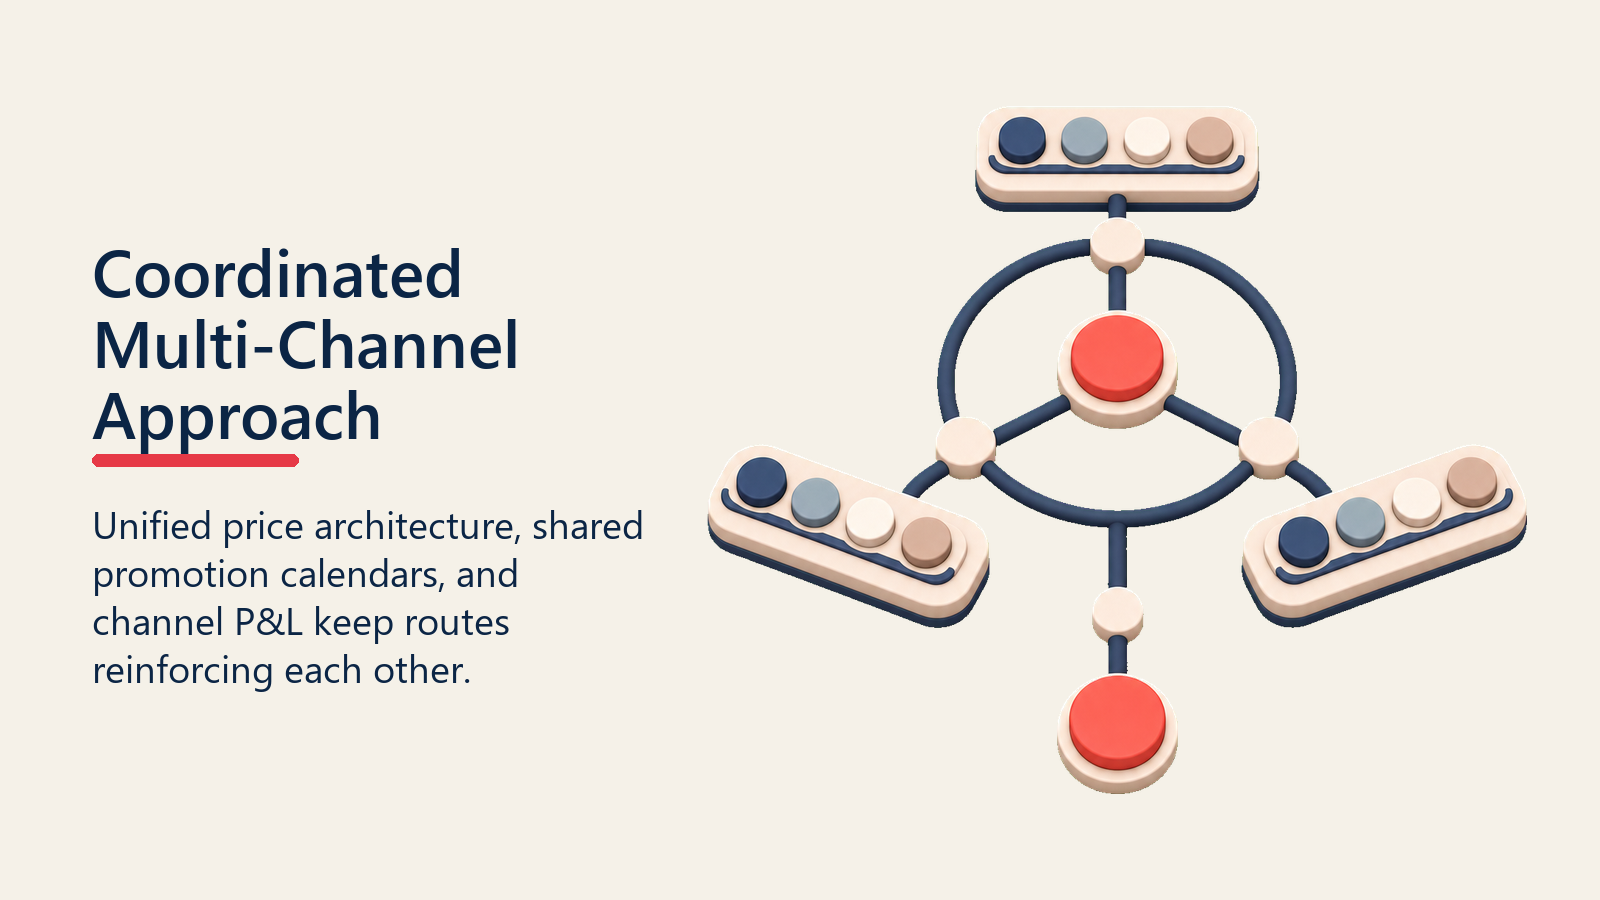
A coordinated multi-channel approach means three things in practice. First, a unified price architecture that defines the manufacturer-to-distributor, distributor-to-retailer, and retailer-to-consumer price flow across all channels, with deliberate differentiation only where it reflects genuine value differences. Second, shared promotional calendars so that a GT scheme and an MT promotion don't run simultaneously on the same SKU in the same market. Third, a single commercial leadership view of channel-level P&L, so that decisions about where to invest are made with full visibility into the cost and revenue of each channel, not just the headline volume.
The brands that win across general trade, modern trade, and eB2B aren't the ones that found the perfect channel. They're the ones that built a channel system where each route to market plays its role, covers its economics, and reinforces the others rather than eroding them.
"In most emerging markets, general trade will represent 65-85% of FMCG volume for the foreseeable future. A strategy oriented primarily around modern trade wins is a strategy that leaves the majority of the market underserved."
"The question most FMCG leaders can't answer cleanly: what percentage of trade spend goes to modern trade versus general trade, and why is that the right split? If the answer is 'that's roughly what we've always done,' you've found the problem."
"eB2B doesn't replace the distributor model. It changes the economics of reaching the last-mile general trade outlet. FMCG brands that treat eB2B as a threat to their distributors will lose; those that use it to extend distributor reach will gain coverage their field force could never justify on its own." (Based on McKinsey eB2B analysis, 2021, and Bain emerging-market channel research, 2023.)
Frequently Asked Questions about General Trade, Modern Trade and eB2B
What is the difference between general trade and modern trade in FMCG?
General trade refers to independent, small-format retailers: kiranas, warungs, sari-sari stores, and neighborhood shops. Modern trade refers to organized retail chains: hypermarkets, supermarkets, minimarkets, and convenience store networks. The commercial model differs fundamentally. General trade is distributor-mediated, requires high visit frequency, and rewards coverage breadth. Modern trade involves formal buyer negotiations, listing agreements, planograms, and promotional calendars with longer payment cycles.
What is eB2B in FMCG distribution?
eB2B (electronic business-to-business) platforms are digital ordering systems that allow small retailers to order FMCG products directly through a mobile app or web interface rather than waiting for a van sales visit. Platforms like Udaan in India or Ula in Indonesia aggregate demand from thousands of retailers, negotiate supply terms with manufacturers, and handle logistics and credit. For FMCG brands, eB2B can extend reach into fragmented general trade at lower cost-to-serve per outlet than direct van coverage.
How should FMCG brands allocate trade spend across channels?
Trade spend allocation should follow revenue contribution and growth potential by channel, adjusted for cost-to-serve and strategic priority. In most emerging markets, general trade will receive the largest share of field force investment given its volume dominance, while modern trade may absorb a disproportionate share of promotional spend due to listing fee and planogram requirements. eB2B investment should be treated as a coverage efficiency tool and calibrated against the incremental reach it provides versus distributor alternatives.
How do you prevent channel conflict between GT, MT, and eB2B?
Channel conflict prevention starts with a unified price architecture that sets floor prices by channel type and governs promotional terms so that one channel's trade investment doesn't bleed into another. Field audits that monitor retail selling prices across channels, promotional calendar coordination to prevent simultaneous discounting on the same SKU, and supply discipline when a distributor or platform consistently undercuts agreed prices are the primary enforcement mechanisms.
What is the right resource allocation split between general trade and modern trade?
There's no universal split, but the allocation should follow market maturity and volume contribution. In markets where general trade represents 70% or more of volume, field force headcount should mirror that weight, with 60-70% of commercial sales resources focused on GT and distributor management. Modern trade gets dedicated key account resources but a smaller headcount share. As markets develop and modern trade share grows above 30%, the allocation rebalances. The error is applying a headquarters model to markets at a different maturity stage.
When does eB2B reduce cost-to-serve and when does it create channel conflict?
eB2B reduces cost-to-serve when it reaches outlets a distributor's van can't economically serve, extending coverage without adding headcount. It creates conflict when the platform undercuts the distributor's selling price, trains retailers to route around their established supplier, or erodes the distributor's working capital by pulling volume into a channel that bypasses them entirely. The governance question is whether the eB2B platform's pricing terms are consistent with the price architecture your distributor channel requires to remain viable.
How is the modern trade halo effect calculated in FMCG?
The halo effect from modern trade on general trade sales is real but rarely quantified. The best proxy is to compare general trade sell-through velocity in territories with strong modern trade brand presence versus territories with weak or no modern trade listing, holding distribution and pricing variables constant. If general trade velocity is consistently 10-15% higher in territories with modern trade visibility, that's a credible halo signal worth modeling into the channel allocation case for modern trade investment.
Learn More

Senior Implementation Consultant